OrbitalHub

Where curiosity reaches escape velocity.

Domain is for sale. $50,000,000.00 USD. Direct any inquiries to contact@orbitalhub.com.

Archive for September, 2026


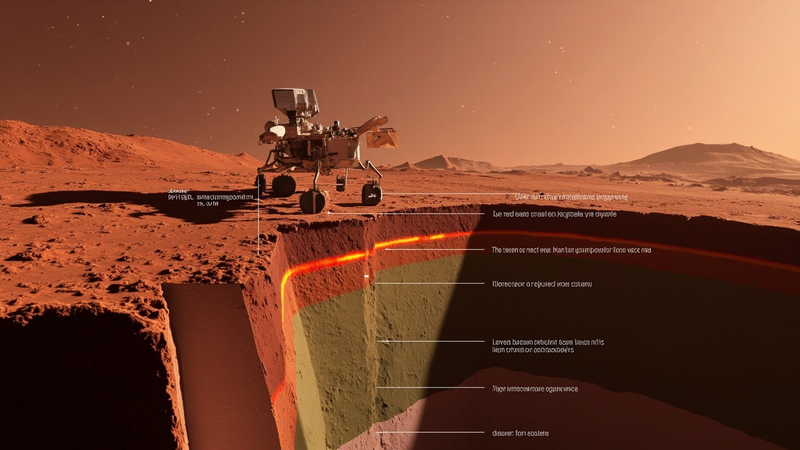
Cross-section of the Martian interior beneath the InSight lander: rust-red regolith above a 24-kilometer-thick basaltic upper crust, a sharp chemical discontinuity shown as a glowing orange line, and an olive-grey ultramafic lower crust descending into the mantle — all under one unbroken stagnant-lid shell.


A seismometer about the size of a basketball, planted on the Martian surface in late 2018, has just handed Earth-bound geophysicists a result that overturns a thirty-year assumption about how rocky planets assemble their crust. Nested inside the tremor record from NASA’s Interior Exploration using Seismic Investigations, Geodesy and Heat Transport (InSight) lander, a team at the University of Oxford has identified a chemical boundary roughly 24 kilometers below the Martian surface that looks suspiciously like the differentiated roots beneath Earth’s volcanic arcs. The implication, published this summer in Nature Astronomy, is that Mars once ran something close to Earth’s transcrustal magmatic systems — without any of the moving plates that geologists have long treated as a prerequisite for that level of crustal complexity (Mackay-Champion et al., Nature Astronomy, 2026).

Why this matters goes well beyond a footnote about Martian geology. If a planet with a single, unbroken lithospheric shell can still drive large, long-lived systems of melt accumulation, crystal settling, and chemical differentiation across its crust, then the basic recipe for building “evolved” crust does not require plate tectonics at all. That has direct consequences for how researchers rank the habitability of rocky exoplanets around other stars: a planet need not have a subdivided, mobile lid to keep its interior hot, recycle volatiles into the crust, and supply surface chemistry for billions of years of geologic time (University of Oxford press release, 24 June 2026).

The story that produced the result starts with InSight’s touchdown in Elysium Planitia on 26 November 2018. The lander deployed SEIS — a three-axis broadband seismometer built by CNES with contributions from IPGP and the Max Planck Institute for Solar System Research, weighing roughly 30 kilograms including its wind and thermal shield — directly onto the regolith using a small robotic arm. For the next four Earth years, until dust on the solar panels throttled power generation and ended nominal operations in late 2022, the instrument listened for marsquakes and the rumble of distant meteoroid impacts, gradually assembling a seismic catalog that geophysicists are still mining (Banerdt et al., Nature Geoscience, 2020). By mission end SEIS had recorded more than 1,300 candidate events distributed across the planet, the bulk of which were the high-frequency surface waves generated when mid-sized space rocks punched through the thin Martian atmosphere and detonated at the surface. What the new study does is take that catalog back to a question that has hung over Mars geophysics since the Viking era: what does the boundary detected by earlier receiver-function analyses, sitting somewhere between 20 and 30 kilometers depth, actually represent? Older interpretations ranged from a layer of frozen groundwater to a contact between volcanic flows and older basement rock. The Oxford group, led by Tobermory Mackay-Champion (now at the University of Bristol) with co-authors Mike Kendall and Jon Wade, reframed the question. They asked whether the discontinuity could be matched by a change in bulk rock chemistry rather than by an abrupt change in porosity or fluid content — and they did it by treating the receiver functions as a chemical assay rather than a structural one.

To answer that, the team assembled hundreds of plausible mineral assemblages — basaltic, andesitic, ultramafic, and exotic carbonatitic end-members — and ran each through thermodynamic equilibrium calculations at Martian crustal pressures and temperatures to determine stable mineralogy. They then predicted the seismic velocities those mineralogies should produce, using the standard relation V_p = sqrt((K + 4*mu/3)/rho) for compressional-wave speed, where K is the bulk modulus, mu the shear modulus, and rho the rock density, and the analogous V_s = sqrt(mu/rho) for shear. Because each mineral has a different temperature- and pressure-dependent stiffness, two compositionally distinct layers can have measurably different Vp/Vs ratios even at the same average density — and that is the lever the new study is pulling. Comparing those predictions with the actual P- and S-wave travel times picked out of marsquake and impact waveforms, the team found that the signal was systematic rather than scattered. The match that best explained the velocities above and below the boundary amounted, in plain terms, to a chemical sandwich. Below roughly 24 km, the seismic properties fit ultramafic assemblages dominated by olivine and low-calcium pyroxene — rocks high in iron and magnesium, low in silica, with densities around 3,200 to 3,300 kilograms per cubic meter. Above the boundary, the velocities matched basalt-like mafic compositions: higher silica, plagioclase-rich, with densities closer to 2,900 kilograms per cubic meter. The transition is on the order of a five to ten percent jump in Vp and a sharper change in Vp/Vs — the exact fingerprint you would expect if a deep cumulate pile sat beneath a more differentiated upper crust (Phys.org coverage of Mackay-Champion et al., 2026).

The way Earth geologists read that pattern is by analogy with what happens beneath active volcanic arcs on our own planet. A magmatic system that persists across the whole thickness of the crust tends to leave a chemical stratigraphy behind in its cooled roots. Dense, primitive cumulates settle out at depth; buoyant, silica-enriched differentiates rise through buoyancy-driven flow. What you end up with is a basalt-rich upper crust sitting on top of an ultramafic residue — exactly the layering the InSight data imply at the Martian mid-crustal discontinuity, except that on Earth the pattern is usually sustained for tens of millions of years by the steady down-going flux of subducting oceanic slabs. On Mars there is nothing sliding under anything.

The constraint that gives the result its bite is horizontal scale. The receiver functions that defined the 24 km boundary stacked across multiple marsquakes recorded at the same lander over several years, with the same converted-phase polarity and amplitude showing up across the catalog, which means the boundary must be laterally continuous over hundreds, possibly thousands, of kilometers across the northern lowlands (Khan et al., JGR Planets, 2023). Combined with the velocity match, the most parsimonious reading is a transcrustal magmatic system of the kind Earth hosts beneath the Andes or the Cascades — but operating within a stagnant lid, where heat is lost by conduction through the lithosphere rather than by advection in subduction zones.

What this changes looking forward is partly about Mars and partly about every rocky world sitting in the temperate zones around other stars. The classical assumption that habitability requires plate tectonics to recycle carbon, water, and other volatiles through a long-lived surface-interior cycle is no longer looking ironclad. A planet can plausibly keep its crust chemically active for billions of years through a different engine — one driven by mantle plumes, heat-pipe volcanism, or stagnant-lid overturn — that does not depend on a moving lid. The next two decades of exoplanet science — the era of the Nancy Grace Roman Space Telescope coronagraph, JWST atmospheric spectra of rocky habitable-zone targets, and eventually thirty-meter-class ground-based reconnaissance that may pick up volcanic outgassing signatures directly — will inherit a rubric where internal dynamics are an axis of habitability, but not the same axis as Earth’s. The next Mars geophysics flagship, be it a network mission like the proposed FSSM/Seismic Mars or a geodetic successor to InSight, will be designed to ask a follow-on question that the single-station SEIS catalog could not: how many such layers are there, and did the chemistry of the upper crust keep evolving through the Hesperian and into the Amazonian, or did the transcrustal engine shut down a billion years ago? Mars, in this reading, looks less like a frozen failed Earth and more like a different successful one — a planet that ran a long-lived chemical factory without ever needing to crack its lid.
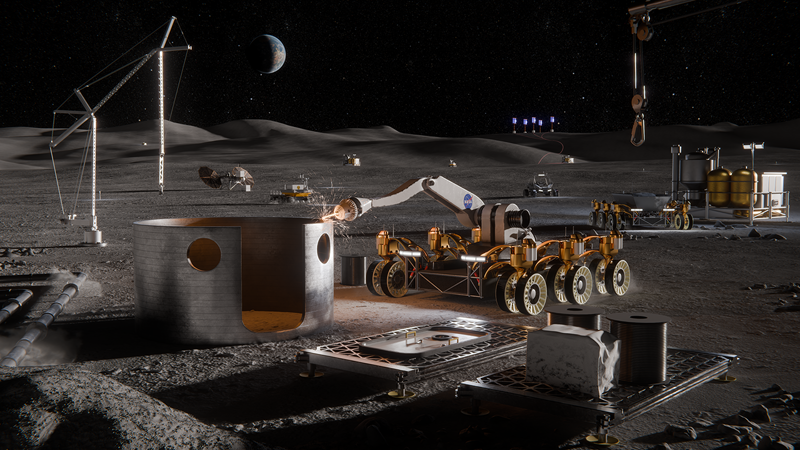


NASA seeks industry help for five Moon Base tech gaps. Image: 2026 09 11 nasa lunar surface tech call.


On September 8, 2026, NASA opened a formal industry solicitation aimed not at the rocket that gets astronauts to the Moon, but at the quiet hardware that has to keep them alive once they are there. The NextSTEP-3 Appendix A solicitation, branded the Lunar Enabling Infrastructure Accelerator, asks U.S. companies, universities, and not-for-profit teams to mature five specific technologies: vertical solar arrays, oxygen extracted from lunar regolith, radioisotope Stirling generators, in-space manufacturing, and innovative nanomaterials, areas that NASA considers the most stubborn gaps on the path to a sustained human presence near the lunar South Pole. The announcement was made under NASA news release RELEASE 26-072, “NASA Calls for Proposals to Accelerate Lunar Surface Technologies”, with proposals due back to the agency by 5 p.m. EDT on October 8, 2026.

The framing matters. NASA is not buying finished hardware with this call; it is buying the demonstrations and the data that show a competing set of approaches can reach Technology Readiness Level 5 to 6, the band where a system has been validated in a relevant environment and is ready to be bolted into a flight article. The agency’s NextSTEP-3 Appendix A program page describes the goal as “closing key technology gaps and maturing competing solutions” so that when NASA does commit to flight hardware, it can do so from a small set of demonstrated options rather than a paper study. The five capability areas named in the final solicitation are the same ones the agency laid out in its June 29, 2026 draft BAA, which followed a May 19 synopsis under procurement identifier 80GRC026R0008, a long drafting cycle by NASA’s usual standards, and a hint that the final wording reflects substantial industry feedback.

The five capability areas, named in the press release, are deliberately heterogeneous: a vertical solar array technology that can provide consistent power generation, management, distribution, and energy storage; in-situ resource utilization oxygen from regolith production to extract usable oxygen molecularly bonded to rock and dust covering the Moon’s surface; a radioisotope Stirling generator, a type of nuclear energy technology that uses heat from fissile materials to produce electric power for operating spacecraft systems in the darkest, dustiest, and most remote places; in-space advanced manufacturing to reduce reliance on resupply missions from Earth and to optimize mission flexibility and resilience on the Moon; and innovative nanomaterials production to advance the commercial availability and quality of nanomaterials that can be used in lunar exploration. Three of the five (oxygen extraction, radioisotope power, advanced manufacturing) were already on NASA’s lunar-technology roadmap before 2024; the vertical solar array and the nanomaterials line are newer entries, which signals the agency is looking outward at commercial capabilities rather than only downward at its own R&D centers.

Why this matters is the gap the announcement is trying to close. The NASA Moon Base reference page describes a near-polar outpost to be built in three phases: robotic exploration through 2029, infrastructure construction by 2032, and long-term astronaut habitation after that. Each phase rests on a different assumption about how much of the base can be supplied from Earth versus produced locally. Artemis IV, currently planned for 2028 per the Aviation Week writeup, is supposed to deliver the first pressurized surface habitat elements. Anything that arrives on that lander, however, still needs power at night, oxygen to breathe, and replacement parts when something breaks, since a single 384-hour lunar night at the pole is too long for any solar+battery architecture to survive without either massive storage mass or a complementary non-solar source. The five capability areas in this solicitation are NASA’s bets on which of those problems get solved by industry in time for the 2028-2032 build-out window.

The story behind the timing is that the broader Artemis program is under budget pressure, and this is the solicitation where NASA is trying to spend smaller amounts of money on a wider set of competing industry approaches rather than continuing to concentrate the work inside a handful of NASA centers. Greg Stover, director of NASA’s Advanced Research and Technology Division, is quoted in the release: “NASA is accelerating the development of key technologies and closing critical gaps needed for long-term human exploration at the Moon. Partnering with industry will strengthen the U.S. industrial base as we mature the capabilities and infrastructure needed for a sustainable lunar presence.” The “U.S. industrial base” phrasing is deliberate; the Appendix A announcement specifies that the solicitation “intends to cultivate U.S.-led capabilities while maintaining full and open competition among private industry, academic institutions, and not-for-profit entities, as well as international partners participating through U.S.-led teams.” International partners are allowed, but only through a U.S. prime, which is the language NASA uses when it wants to widen competition without ceding intellectual property control.

The science and engineering question underneath the solicitation is whether these five capability areas are actually independent or whether they have to mature together. They are not independent. The vertical solar array and the radioisotope Stirling generator are competing answers to the same problem (night-side power at the pole), and a base design that picks one will not need the other at full scale. In-situ oxygen extraction and in-space manufacturing share feedstock: the oxygen a regolith-processing plant pulls out of ilmenite or volcanic glass leaves behind a metal-rich slag that is, in principle, feedstock for additive manufacturing of structural parts. Innovative nanomaterials cut across all three: better cathode materials for the Stirling generator’s thermocouples, lighter radiation shielding for the habitat, higher-strength binders for the regolith-derived construction materials. The solicitation does not formally require joint proposals across areas, but the implicit pressure is on industry teams that can show how their work in one area plugs into the others. NASA may apply insights gained from the resulting contracts, the release notes, with “such as technical data, and demonstration results, to shape future acquisition strategies,” which is unusually candid agency language for “we will pick the winners in a second-round flight buy.”

The five areas also correspond to where the agency’s internal R&D has struggled the most. NASA’s in-house oxygen extraction work, dating back to the canceled Resource Prospector rover in 2018, has consistently run into the problem that the energy needed to crack oxides out of regolith exceeds what a small surface plant can deliver from solar panels alone. Pairing an oxygen plant with a Stirling generator is the obvious answer, but only if the Stirling generator’s heat source can be packaged small enough to land on a Commercial Lunar Payload Services flight. The vertical solar array is NASA trying to specify a different solution: a deployable tower that lifts panels above the dusty surface layer where direct sunlight is available for more hours per day, because traditional rover-deployed arrays have been repeatedly sandblasted by plume ejecta from nearby landings. None of these are problems the 2026 solicitation will solve, but the demonstrations the contracts buy will at least narrow the menu of credible solutions before the agency has to commit to a flight configuration for the 2030s.

The takeaway is that the September 8 solicitation is best read as a procurement shape rather than a flight milestone. NASA is not promising any of the five technologies will reach the Moon before Artemis IV, and it is not committing to a particular contractor; it is signaling that the menu of options will be wide and that the agency plans to make its architecture choices later, from the demonstrated set. Proposals are due October 8, and Aviation Week reports NASA does not plan to hold an industry day exchange, which is a hint that the agency considers the June draft and the August 20 “Responses to Industry Feedback” attachment sufficient background for offerors. If funded contracts cluster around one or two of the five capability areas, that will be the most informative signal, since it will tell observers which of the Moon Base’s hardest problems the agency now thinks an industry team can plausibly solve before the 2032 infrastructure-construction phase begins.


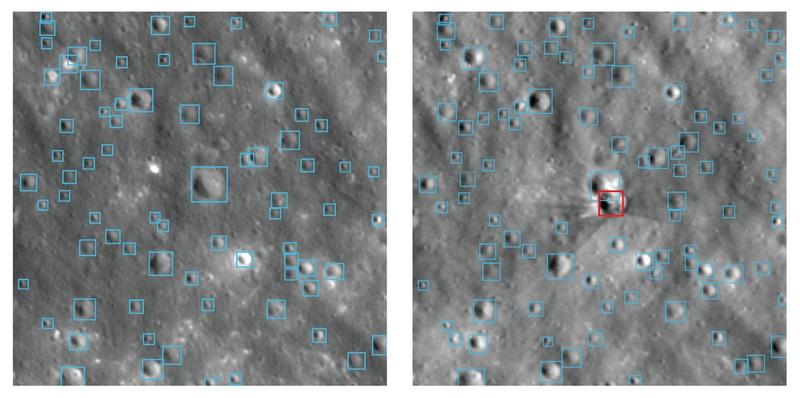
NASA-IBM Lunar Foundation Model blue-outlined crater detections overlaid on a Lunar Reconnaissance Orbiter mosaic near Einstein crater, illustrating the model's ability to survey impact features at meter scale.


In 2009, the Lunar Reconnaissance Orbiter finished its commissioning burns and started taking the highest-resolution pictures of the Moon anyone had ever made. Seventeen years later, on 10 September 2026, IBM and NASA published a free neural network that reads those pictures better than anything before it. The NASA-IBM Lunar Foundation Model, released under Apache 2.0 on Hugging Face, identifies lunar ice with 22 percent less error than the strongest dedicated algorithm, maps craters 19 percent more accurately at coarse resolution using half the labelled data, and traces volcanic deposits about 3 percent more cleanly with less fine-tuning (NASA Science and IBM Research, 10 September 2026). For the first time, planetary science has a single foundation model built specifically for Earth’s oldest companion.

The work matters because the next humans on the Moon are scheduled to land somewhere most maps refuse to draw. The Artemis program targets the lunar south pole, a region ringed by permanently shadowed regions — craters so deep that the Sun never rises more than a few degrees above their rims. Floor temperatures there bottom out near 40 kelvin, cold enough that water molecules arriving on the solar wind or from cometary impacts can survive for billions of years instead of sublimating away (Vasavada et al., Icarus, 1999). NASA estimates that the lunar north pole alone may hold roughly 600 million metric tons of water ice, enough to fill at least 240,000 Olympic swimming pools; the south pole is expected to hold comparable reserves (IBM Research, 10 September 2026). Ice is propellant, drinking water, and oxygen in waiting. Every kilogram of hydrogen and oxygen a crew can mine on the surface is a kilogram a Falcon Heavy does not have to lift off Earth. The economic case for Artemis depends on how cleanly geologists can rank those PSRs before a lander commits to one.

What the new model solves is a different problem that has quietly paralyzed the field: data fragmentation. LRO has produced more raw imaging data than every other NASA planetary mission combined (NASA Science, 10 September 2026). Some of it is camera imagery at one-meter-per-pixel ground sampling in seven spectral bands. GRAIL, in 2012, mapped the gravity field at roughly 20 kilometers per pixel — the shape of the interior rather than the surface. Japan’s SELENE (Kaguya) orbiter layered in mineralogical maps and laser altimetry. For sixty years, lunar science has lived in a stack of incompatible file formats. Combining them was a graduate student’s summer project, repeated for every paper.

The Foundation Model replaces that summer project with one download. IBM and NASA call the accompanying release SomBench, the first open-source, machine-learning-ready unified lunar dataset (Hugging Face, NASA-IBM-Lunar-Foundation-Model, 2026). SomBench aggregates more than 30 spatially aligned data layers from nine instruments across four missions — principally LRO and GRAIL plus complementary observations from SELENE — into roughly two million co-registered image tiles (CNET, 10 September 2026). The training corpus itself exceeds one million high-resolution images at one-meter resolution and close to 964,000 multispectral tiles at 100-meter resolution (NASA Science, 10 September 2026). Tiles have already been re-projected onto a common grid.

The people behind the release come from a partnership that reaches back to Apollo. IBM and NASA have worked together since the 1960s, when IBM guidance computers flew on Saturn V. Kevin Murphy, NASA’s chief science data officer, said in the joint release: “We also have to make data easier for scientists to explore and use” (NASA Science, 10 September 2026). Campbell Watson, the IBM Research senior manager who led the build, told CNET the team wanted a “shared foundation that researchers can adapt” (CNET, 10 September 2026). Juan Bernabé-Moreno of IBM Research put it as travel advice: “Experienced travelers know to get the lay of the land before setting out for a foreign destination” (IBM Research, 10 September 2026).

The machine-learning choices under the hood explain why the gains are real. The architecture is a Vision Transformer Base encoder-decoder — 768 hidden dimensions, 12 transformer layers, 12 attention heads — adapted from TerraMind, the Earth-observation foundation model IBM had previously built with ESA (Tech Times, 11 September 2026). The transformer self-attention operator at the heart of each block computes pairwise token affinities scaled by 1/sqrt(d_k), with d_k set to 64 in the 12-head configuration; the softmax of those affinities is what lets the network learn which patches of the input relate to which. TerraMind’s special sauce is its cross-modal pretraining, which forces the model to learn correlations between disparate sensor streams, so that a noisy radar channel can be reconstructed by attending to what a multispectral camera saw of the same surface. On the Moon, that trick becomes a way to fill in what the PSRs will not give an optical camera: a thermal map from the Diviner instrument over a shadowed crater can be cross-referenced with a gravity anomaly from GRAIL, and the model learns that combination as a single latent representation rather than two independent ones.

Training was masked-autoencoder pretraining on the full two-million-tile corpus, where the model is asked to reconstruct randomly masked patches and in doing so must learn the statistics of lunar terrain. To prevent the network from memorising a few well-imaged tiles, the team held out distinct geographic “wedges” of the Moon for testing (Time News, 11 September 2026). The technical report lists three downstream gains. For ice detection, the model cut root-mean-square error by up to 22 percent over a SwinV2-B transformer pretrained on ImageNet. For crater detection at 100-meter context, it outperformed the same baseline by nearly 19 percent with half the labelled training tiles; at meter scale it matches state-of-the-art head-to-head. For irregular mare patches — the subtle volcanic features whose ages are reshaping the chronology of lunar cooling — the model improved extent accuracy by about 3 percent at lower fine-tuning cost (NASA-IBM Lunar Foundation Model technical report, Hugging Face, 2026).

The physics gives those percentages meaning. Ice stability inside a PSR depends on local temperature integrated over a full precession cycle and on burial depth below the gardening reach of micrometeorite impacts. A model that has internalised those thermophysical correlations can rank candidate deposits the way a specialist would, across the whole Moon. Crater counts age a surface because the impact flux is approximately known, and a model trained on the full LRO catalogue has absorbed what an impact signature looks like at every illumination angle — critical for a sensor whose parent body has a 29.5-day day-night cycle. Even IMP detection improves because the model has learned that young volcanic features are defined by a bundle of morphological and compositional cues, not by any single texture.

What changes because of this release is the slope of the field. The model is not a substitute for a graduate-level lunar geologist; it lets researchers who previously spent six months pre-processing a single tile bundle ask questions across the whole catalogue in an afternoon. Apache 2.0 means any team — a Chinese lunar university, an Indian student, a Brazilian startup — can build on the same backbone. The Prithvi family IBM and NASA open-sourced for Earth observation will likely pick up a lunar cousin by year’s end, and the codebase sits on GitHub at NASA-IMPACT, where custom fine-tunes for new instruments (Lunar Trailblazer, India’s Chandrayaan follow-ons, China’s Chang’e 7 imaging) can be trained without revisiting the data-integration problem. If the 22 percent lead against SwinV2-B holds once independent teams retrain on their own data, the rest of the 2020s will inherit a Moon that, for the first time, is machine-readable at planetary scale.


September 12, 2026

The loneliest arrival of the decade

Posted by


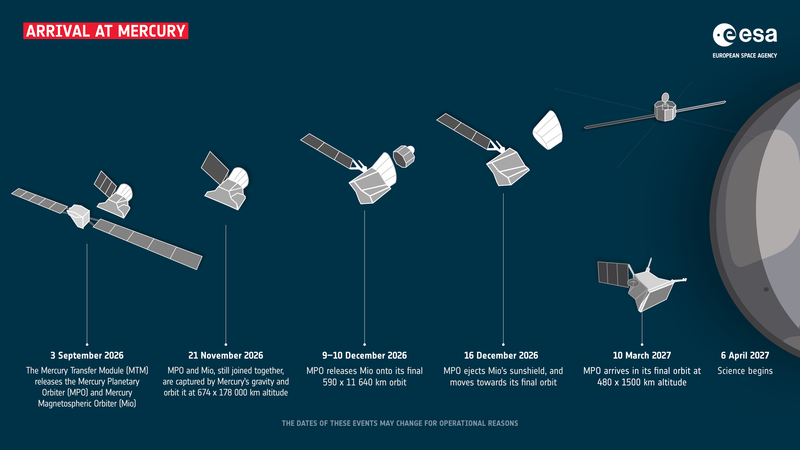
BepiColombo's arrival at Mercury, showing the four-stage separation sequence from MTM separation on 3 September 2026 through science operations beginning on 6 April 2027. (ESA)


On 15 June 2026, at 15:24 CEST, a spacecraft 100 million kilometers from Earth received a single command through ESA’s Estrack deep-space antennas: stop firing. After almost eight years of nearly continuous thrust, the four QinetiQ T6 ion engines on the Mercury Transfer Module shut down for the last time. With that, the European/Japanese BepiColombo mission crossed an invisible line. From that moment, the spacecraft was on a ballistic trajectory, coasting with no propulsion toward the deepest gravity well in the inner Solar System. Mercury orbit insertion is scheduled for 21 November 2026 (ESA BepiColombo mission timeline, July 2026 update). What used to be a braking problem became a falling problem, and falling problems don’t have throttle knobs.

Mercury is the least explored planet in the inner Solar System, and the hardest one to reach without surrendering. It sits deep inside the Sun’s gravity well, moving at 47 km/s on average, more than three times Earth’s orbital speed. To fall into orbit around it rather than whip past it, a spacecraft must shed almost all of the kinetic energy it gained falling toward the Sun from Earth. NASA managed the trick with Mariner 10 in 1974 and MESSENGER in 2011. The Soviets never made it. The Japanese never tried. If BepiColombo succeeds, it will be only the third spacecraft in history to enter orbit around Mercury, and the first from Europe or Japan (ESA BepiColombo overview).

The mission also carries the heaviest scientific payload ever sent to Mercury, sixteen instruments distributed across two orbiters stacked on a propulsion bus. The trajectory they are flying is, by itself, an engineering demonstration: a multi-year, multi-flyby spiral through nine planetary encounters that uses gravity assists from Earth, Venus, and Mercury itself to bleed off energy without spending propellant.

BepiColombo launched from Kourou on 19 October 2018 aboard Ariane 5, lifting a 4,100-kilogram composite spacecraft into a series of looping escape orbits. The plan was, in spirit, simple: spiral inward. In practice, the MTM had to do most of the braking. Its four T6 ion thrusters, each producing only about 145 millinewtons of thrust (about the weight of a sheet of paper resting on a hand), fired almost continuously for years, accumulating more than 15 kilometers per second of total delta-v.

Then, in April 2024, the system lost a fight with itself. A short circuit in the MTM power conditioning unit reduced available thrust to roughly 90 percent of nominal. The original December 2025 arrival was no longer reachable. ESA’s flight dynamics team at ESOC in Darmstadt had to rebuild the entire interplanetary approach from the ground up, slicing flyby altitudes closer to Mercury by about 35 kilometers to recover the energy deficit through sharper gravity assists. The sixth and final Mercury flyby, on 8 January 2025, came in at just 295 kilometers above the night-side surface. Close enough that the spacecraft’s M-CAM monitoring cameras caught permanently shadowed craters at the north pole that may hold frozen water (ESA, January 2025 flyby report).

What happens between now and April 2027 is a four-stage separation sequence that ESA’s infographic captures cleanly. On 3 September 2026, still on approach, the MTM detaches and falls away, its job done and its xenon tanks empty. On 21 November 2026, a stack of two science orbiters fires a chemical-propellant braking burn and is captured into a high-altitude polar orbit. On 9–10 December 2026, ESA’s Mercury Planetary Orbiter (MPO) ejects the shielded Japanese Mio spacecraft onto its own elliptical polar trajectory. On 16 December 2026, MPO jettisons Mio’s protective sunshield (MOSIF). Over the next three months, MPO uses its own thrusters to lower itself to its working orbit of roughly 400 by 1,500 kilometers, arriving on 10 March 2027. Routine science begins on 6 April 2027 (ESA BepiColombo arrival timeline, July 2026).

The propulsion architecture is the story. The T6 ion thruster, built by QinetiQ Space in the UK, ionizes xenon and accelerates the ions through a grid biased at roughly 2,000 volts. Specific impulse runs around 4,300 seconds, about five times better than the best chemical bipropellant engine on the spacecraft. The trade is brutal: thrust is so low that BepiColombo had to spiral inward for eight years to make the maneuver work. The reward is propellant efficiency. The MTM carried only about 580 kilograms of xenon, and that modest tank delivered the equivalent delta-v of tens of metric tons of hydrazine.

Once the MTM separates, MPO has to handle the rest of the braking with its own chemical propulsion: a hydrazine-based system capable of producing about 1,000 newtons of total thrust across four 22-newton thrusters. To enter Mercury orbit, MPO must dissipate roughly 1.8 km/s of hyperbolic excess velocity in a series of maneuvers spread over weeks. Because Mercury’s gravity well is so deep, an error of even one meter per second in the insertion burn propagates into hundreds of kilometers of orbital drift by the end of the commissioning phase.

The two orbiters work at very different altitudes on purpose. Mio, the JAXA Mercury Magnetospheric Orbiter (formerly MMO), sits in a highly elliptical 400 by 12,000 kilometer orbit that swings it through the magnetosphere to sample solar wind interactions. MPO, in a tighter near-circular polar orbit, holds its instruments nadir-pointed at the surface. Eleven instruments on MPO and five on Mio together cover imaging (SIMBIO-SYS), X-ray fluorescence (MIXS), gamma-ray and neutron spectroscopy (MGNS), laser altimetry (BELA), magnetometry (MERMAG), and exospheric sampling (SERENA, PHEBUS). Temperatures range from about -180°C on the night side to +430°C on the day side, so most optical and infrared instruments sit behind thermal blankets and, where needed, gold-coated mirrors.

The water-in-shadow question is one of the cleaner open cases. Earth-based radar returns from Mercury’s polar craters are consistent with volatile ices buried under regolith. BepiColombo’s MGNS and MIXS instruments should, in principle, detect hydrogen directly through neutron moderation and detect elemental composition through characteristic X-ray emission. The permanently shadowed craters (Prokofiev, Kandinsky, Tolkien, and Gordimer at the north) were imaged by M-CAM 1 during the January 2025 flyby. Their rims just catch the sun, while their floors stay below 100 K year-round.

Three months from now, an interplanetary spacecraft that has spent almost a quarter of its life quietly thrusting through the inner Solar System is going to fall into the smallest planet’s gravity well. Whether the chemical insertion burn works depends on years of trajectory redesign, on the integrity of a 90-percent-power propulsion system that engineers coaxed across nine planetary encounters, and on a separation sequence that has to be executed cleanly four times in two months. If it works, BepiColombo will spend the next several Earth years mapping an airless, 430-degree-Celsius world whose permanently shadowed craters might, just maybe, hold enough water to matter for human exploration later this century.

If it doesn’t work, the spacecraft will whip around Mercury on a flyby trajectory, and the data already gathered by M-CAM during the six gravity assists will have to carry more of the mission’s scientific weight. As ESOC mission operators Ignacio Tanco and Nacho Clerigo have stressed in briefings, the arrival phase is not a single event but a six-month sequence of one-of-a-kind operations, each of which has to go right in the right order.


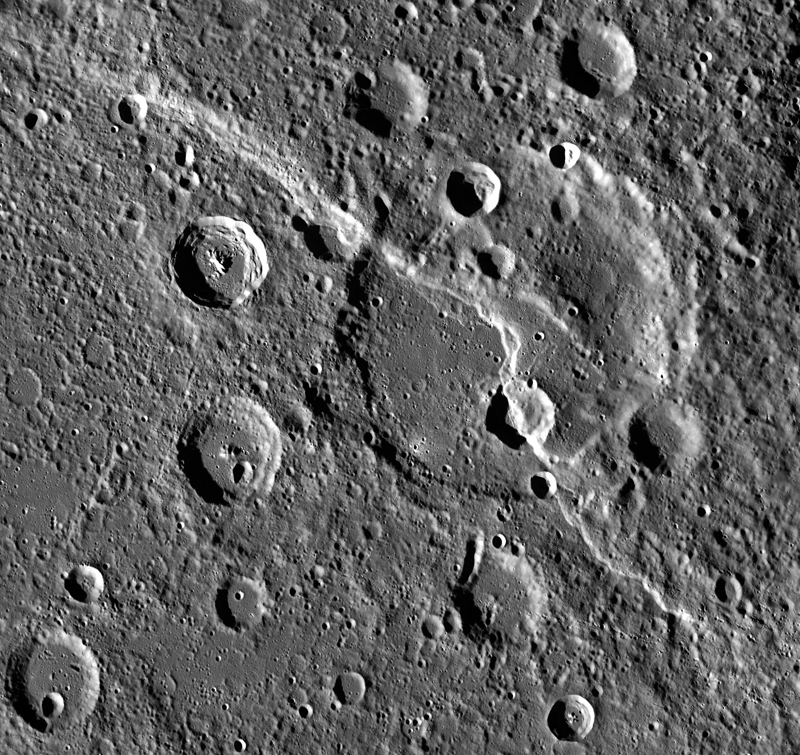
The lobate scarp Carnegie Rupes cuts across a heavily cratered plain on Mercury, with the rim of the small crater Duccio visible where the cliff slices through it. The ridge is roughly 270 kilometres long and rises several kilometres above the surrounding volcanic plain, and it formed as the planet's interior cooled and its outer shell shortened. Image: NASA / JHUAPL / Carnegie Institution, MESSENGER spacecraft, PIA19279, full resolution on Wikimedia Commons.


A fresh look at Mercury’s wrinkled face suggests the innermost planet is a tighter squeeze than anyone had measured. A team led by Gaku Nishiyama at the German Aerospace Center (DLR) reports on 10 September 2026 in Geophysical Research Letters that Mercury’s radius has shrunk by somewhere between 6.9 and 11.6 kilometres (about 4.3 to 7.2 miles) since the planet finished forming, up to 30% more shrinkage than the previous best estimate. The new number does not mean Mercury suddenly started cooling faster. It means the team has been able to count landforms that earlier surveys could not see, in places that earlier surveys did not look. (Phys.org, Space.com)

The cooling and contraction of a rocky planet are not abstract. They leave a written record on the surface. As the hot interior of a world like Mercury gives up heat to space, its iron core and silicate mantle both contract, and the cold brittle outer shell has to buckle and shorten to keep covering the smaller interior. On Mercury that shortening shows up as long curving cliffs called lobate scarps and as the smaller, bunched-up wrinkles that run across the volcanic plains. Each of those structures corresponds to a known amount of horizontal shortening, and the cumulative shortening of all of them tells you how much the planet’s radius has changed.

The problem is that some of those wrinkle ridges are buried under rubble. Mercury is the most heavily cratered surface in the Solar System besides the Moon, and each impact spreads a blanket of broken rock over a wide area. Where the surface is rough, the short scarps get masked by impact debris and are no longer visible from orbit. Earlier global surveys counted only the ridges they could see in smooth volcanic plains and used that visible population to estimate the global total. Nishiyama’s team did something different: they overlaid Mercury’s contraction-related fault map with a high-resolution surface roughness map, found that the roughest patches are systematically missing the scarps the smoother patches have, and used that correlation to estimate how much contraction the rough terrain is hiding.

The corrected total is 4.3 to 7.2 km of radial contraction, depending on how the unmapped regions are extrapolated. The upper end is about 30% larger than the previous widely cited figure, and the lower end is broadly consistent with the older estimate. Either way, the planet’s interior has gone through more total cooling than the existing record implied. That matters for what scientists think is going on inside Mercury today. A planet that has lost more heat over its lifetime is consistent with an iron core that has fewer light elements mixed into it, or with a higher starting temperature, or both. Lead author Nishiyama, in statements accompanying the paper release published via the American Geophysical Union’s media release, lays the implications out plainly: “More shrinking means Mercury could have a larger metal core, less light elements like silicon mixed into the metal core, or a higher starting temperature.” (Time)

The story behind the paper is at least as interesting as the headline number, because the data set the team used is mostly the same one that supported the earlier, smaller contraction estimate. NASA’s MESSENGER spacecraft orbited Mercury from 2011 until it ran out of fuel in 2015, and its Mercury Dual Imaging System returned the global monochrome and colour mosaics that almost every modern Mercury paper still leans on. The MESSENGER Laser Altimeter (MLA) produced a topographic map of the northern hemisphere but could not see all the way to the south. The team behind the new paper combined MESSENGER imagery with a recent roughness map derived from those same images, cross-checked with the older Byrne et al. 2014 estimate from Carnegie Institution and Smithsonian, and identified which kinds of terrain were systematically underrepresented in the historical contraction count.

The surface structures this work is about are dramatic at human scale even if they are subtle in orbit. The Wikipedia entry for Carnegie Rupes, a textbook lobate scarp in Mercury’s northern volcanic plains, describes an escarpment about 267 kilometres long with several kilometres of vertical relief. The image NASA’s MESSENGER spacecraft captured of that scarp cutting through the small crater Duccio (PIA19279, public domain, NASA / Johns Hopkins Applied Physics Laboratory / Carnegie Institution) is reproduced below. The curving bright ridge in the middle of the frame is the scarp itself. Each kilometre of vertical throw on a scarp like that one corresponds to a known amount of horizontal shortening, and the cumulative throw across thousands of such features is what gets converted, at the end, into a single radius change for the whole planet.

The instrument that will close the question is now on its way. ESA’s BepiColombo mission, launched in October 2018 and scheduled to enter orbit around Mercury in late 2026, dropped its cruising platform on 3 September 2026 after a flyby and is closing in for orbit insertion in November. It carries the BepiColombo Laser Altimeter (BELA), a German-Swiss instrument led by the same DLR group that authored the contraction paper. BELA is designed to map Mercury’s topography from the equator to the south pole at roughly ten times the vertical resolution of MESSENGER’s MLA, and Nishiyama is a member of the BepiColombo science team. He has been explicit about what the new data will buy. “Future data from laser altimetry on BepiColombo will collect more information on planetary contraction by measuring topography more precisely,” he said in the paper’s release materials, and the broader BepiColombo topographic record will let the team test whether the corrected 6.9 to 11.6 km figure is the final answer or itself an underestimate. (Phys.org)

The deeper question, beyond Mercury’s own radius, is what kind of planet Mercury is. It is the smallest planet in the Solar System by radius, the second-densest after Earth, and the only one with a fully liquid iron core that generates an active magnetic field. Its high density combined with its low mass implies an oversized metal core, and the surface contraction is one of the cleanest windows into how that core has been cooling for the past 4.5 billion years. A planet that has lost more heat than its visible faults suggest is a planet whose interior has been more efficient at giving up its primordial warmth. For models of planetary dynamos, of core composition, and of the thermal history of rocky worlds in general, that 30% revision is a meaningful step.

The lesson is also methodological. Planetary geologists working on Mars, the Moon, and the icy satellites of the outer planets face the same problem of counting only the faults that happen to be visible on the surface. Mercury’s case, where the obscuring layer is impact debris rather than vegetation or ice, is unusually clean. The team’s correlation between contraction feature density and surface roughness gives them, and anyone who follows them on other worlds, a concrete way to estimate how much of a planet’s tectonic record is hidden in plain sight. That kind of correction does not invalidate the earlier surveys; it shows that those surveys were working from the right kind of data and the right kind of reasoning, but with incomplete coverage.

By the end of November 2026, BELA will start returning the topographic map that turns Nishiyama’s 6.9 to 11.6 km range into a single number with much smaller error bars. If the BepiColombo topographic record confirms the upper end of the contraction range, the standard thermal-history models for Mercury will need to be revised in much the same way the contraction estimate itself just was. If it confirms the lower end, the new paper becomes a careful quantification of how much a single observational bias was understating a real measurement. Either way, the figure that planetary scientists will quote for Mercury’s shrinkage from now on is not the number they were quoting last week.


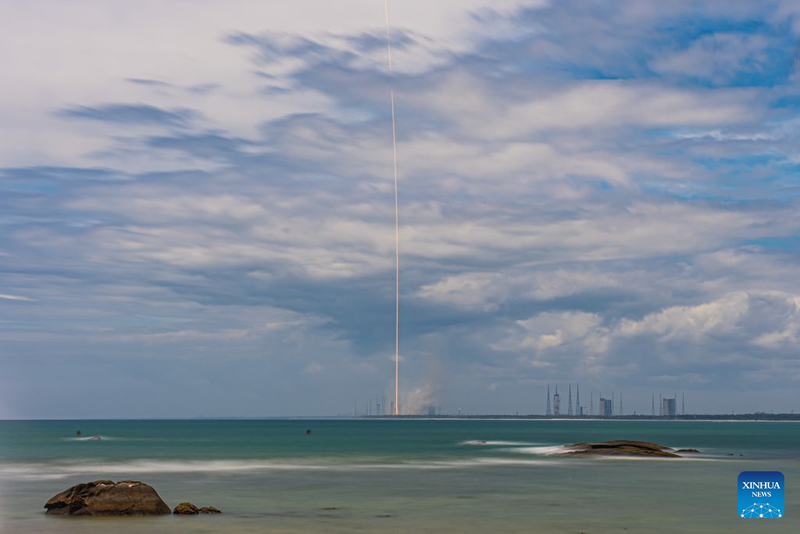
A Long March-10B rocket lifts off from Hainan on July 10, 2026, in a long-exposure photograph taken from across the bay. (Xinhua/Pu Xiaoxu)


On the morning of July 10, 2026, a 63-meter rocket climbed off a brand-new launch pad on Hainan Island, deposited an unnamed payload into a low orbit, and then — six minutes later — fell back out of the sky and let a steel net on a ship catch it. The vehicle was the Long March 10B, designated CZ-10B in China’s rocket catalog, and the flight was its maiden voyage. Both halves of the mission succeeded, which made China only the second country, after the United States, to propulsively recover an orbital-class booster. The second thing that mattered was that the recovery hardware was nothing like SpaceX’s drone-ship landings: no deployable legs, no tower catch, no hover-slam. The booster carried four hooks and used them to latch onto a cross-shaped steel cable net strung across the deck of a ship called Linghangzhe. Chinese state media called it the world’s first successful wire-arrestment recovery of a carrier rocket (Xinhua, July 10, 2026). For an industry that has spent the last decade copying the Falcon 9 playbook, the choice to do something different is the story.

Reusability is no longer optional in the commercial launch market. Reusing a first stage is the single largest lever on launch cost, and the cost gap between an expendable booster and a flight-proven one is roughly a factor of two on Falcon 9 (SpaceX stated figures cited in SpaceNews, 2025). The industry consensus for the last decade has been that vertical propulsive landing is the only path: relight a few engines, fall ballistically through the upper atmosphere, use grid fins to keep the stack on course, throttle down, set down on legs. China has just demonstrated a working alternative, which suggests the engineers at CALT made a deliberate trade.

The arguments are mostly about mass. Landing legs, deployment hinges, hydraulic dampers, the extra beef in the engine bay to absorb landing loads, and the reserve propellant for a hoverslam all eat into payload. Falcon 9 sets aside on the order of 6% of its first-stage propellant load for a drone-ship landing and roughly 30% for a return-to-launch-site profile (SpaceX public estimates; Flight Club reconstructions). A booster that does not have to carry legs can carry more propellant or more payload. CALT’s published commentary frames the net as a way to “shift the structural burden from the vehicle to the sea-based platform.” The ship, not the rocket, holds the arrestment load.

Geography helps. Wenchang sits on the east coast of Hainan, and the standard launch azimuths send boosters downrange over the South China Sea. A recovery vessel can sit offshore and the booster has a flat ocean to fall into, with no populated land downrange and no steep boostback burn. Linghangzhe is the first ship purpose-built for this. It is 144 meters long, 50 meters wide, displaces 25,000 tonnes at full load, has DP2 dynamic positioning, and carries the arrestment net on a steel frame taller than a six-story building (CASC, July 2026). LiDAR units at the corners of the frame feed an automated capture loop. No one on deck is steering.

Liftoff came at 12:15 p.m. Beijing time on July 10. Seven YF-100K engines, each rated at about 1,250 kilonewtons of sea-level thrust, lit together to push the 760-tonne stack off the pad (Xinhua, July 10, 2026; CALT engine specifications, 2024). The seven-engine cluster is notable: this is the LOX-kerosene YF-100 in its latest pump-back-swing variant, with the thrust chamber gimbaled while the turbopumps stay fixed. That rearrangement is what lets CALT fit seven of them into a 5-meter core. About 150 seconds into the flight, at roughly 100 kilometers of altitude, the first stage separated and the second stage’s single YF-219 methane-LOX engine took over to deliver the satellite. The first stage then began a six-minute return: unpowered coast to apogee, attitude turn using cold-gas thrusters, a reentry burn to scrub velocity, aerodynamic deceleration with titanium grid fins steering, and then a final descent burn that cut off just before the hooks met the cables.

The flight was an operational test of the recovery system and engines. The booster caught in the net has to be inspected, refurbished, and flown again. CASC said it intends to refly this exact first stage before the end of 2026. If that happens, China will have skipped the long Falcon 9 march from 2013 to 2017 that SpaceX needed to land and re-fly the same booster.

The CZ-10B is the middle child of a three-rocket family. The crew-rated CZ-10A will launch astronauts in the Mengzhou spacecraft to the Tiangong station. The heavy-lift CZ-10 — three cores bundled together, 92.5 meters tall, 21 engines — will eventually carry the Mengzhou and Lanyue lander to the Moon with roughly 27 tonnes on a trans-lunar trajectory. The 10B is the test bed: same diameter, same first-stage engines, with a methane upper stage optimized for commercial missions rather than crew.

The trick that makes the architecture work is the propulsion. Specific impulse is the engine-design figure of merit: how many seconds of thrust one kilogram of propellant produces. The YF-100K runs an oxidizer-rich staged combustion cycle at a chamber pressure near 18 megapascals, with a sea-level specific impulse around 302 seconds and a vacuum number near 338 seconds (CALT YF-100K specification sheet, 2024). For comparison, the Merlin 1D on Falcon 9 produces about 282 seconds at sea level. Higher Isp means less propellant mass buys a given delta-v, which the rocket equation makes unforgiving:

Δv = v_e * ln(m_0 / m_f)

Every kilogram of dead mass stripped off the first stage translates, through that logarithm, into more kilograms of payload at orbit.

Methane on the upper stage is the second bet. LOX-methane engines run cooler, leave less coking residue, and are easier to turn around between flights than kerolox. That matters more for an upper stage than for a booster, because the upper stage burns for several minutes and accumulates more thermal soak-back. The YF-219 has been a long-running CALT development, and the 10B flight is its first orbital demonstration.

The recovery system is the engineering story most worth lingering on. The cross-shaped net is built from high-strength steel cables with hydraulic buffers at the four corners that absorb kinetic energy. Four hooks on the booster engage the cables at low speed (the descent burn throttles the booster down to a few meters per second before capture). Once the cables take the load, hydraulic winches stabilize the booster against wind and waves, and an automated locking platform clamps it for the trip back to port. The sequence is unmanned: LiDAR tracks the booster, the position-keeping system holds the ship steady, and the capture happens in software.

The CZ-10B was a single Friday-morning launch, but the chain it pulls on is longer. The 10A will use the same first stage (minus the net hardware) to put Mengzhou crews into low orbit; the heavy CZ-10 will use it again, three at a time, to support China’s crewed lunar program before 2030. If CASC can fly, catch, inspect, and re-fly a first stage in 2026, the company buys a launch cadence for the Guowang megaconstellation and Tiangong that costs a fraction of an expendable fleet. The United States spent the better part of a decade proving booster reuse was physically possible. China has, in a single afternoon, suggested there is more than one way.

The lesson for the rest of the industry is straightforward. Reusability is the destination, not the route. The path that SpaceX blazed — vertical landing on legs — is one road. A net on a ship is another. Both work. Both have trade-offs. The only thing that no longer works is to keep throwing away 70% of a rocket.