OrbitalHub

Where curiosity reaches escape velocity.

Domain is for sale. $50,000,000.00 USD. Direct any inquiries to contact@orbitalhub.com.

Archive for the Earth Science category


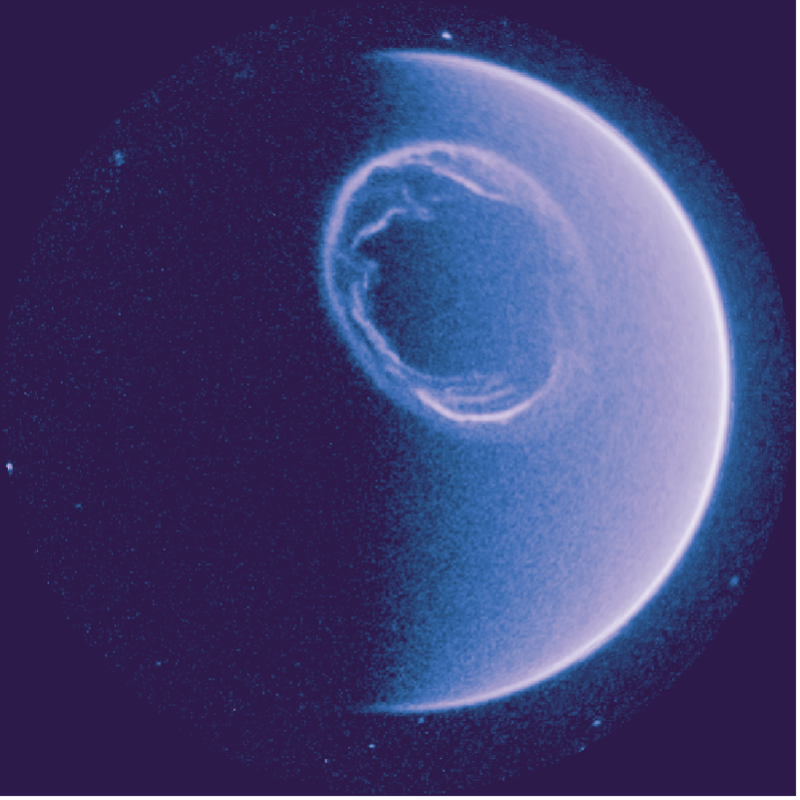
Earth's northern hemisphere as seen by SMILE's UVI camera on 24 July 2026, showing the dayside and nightside auroral oval in ultraviolet light. (Image credit: ESA & CAS/Smile/UVI)


For most of the last eighteen years, anyone wanting to see the whole northern auroral oval at once has had to piece together images from low-Earth orbit, stitching narrow camera swaths into a quilt. The ultraviolet imager on the new SMILE spacecraft ended that gap on 24 July 2026, and on 30 September 2026 the European Space Agency released the result: a 45-hour ultraviolet movie of the entire ring of northern lights, dayside and nightside together, with an auroral substorm frozen mid-ripple. It is the first complete ultraviolet portrait of the oval since NASA’s Polar mission ended in 2008, and the early frames are already changing how researchers think about the boundary between the solar wind and Earth’s magnetic shield.

SMILE, the Solar wind Magnetosphere Ionosphere Link Explorer, is the first space mission jointly selected, funded, built, launched, and operated by ESA and the Chinese Academy of Sciences. It launched on 19 May 2026 aboard a Vega-C from Europe’s Spaceport in French Guiana, reached its science orbit on 20 June, and on 23 September 2026 ESA declared the spacecraft ready to start routine science operations. The mission is built around a question that has lingered since the magnetosphere was first sketched in the 1960s: how does the Sun’s wind of charged particles couple, end to end, to the bright auroras people watch from the ground. Past missions like ESA’s Cluster constellation and NASA’s IMAGE have studied pieces of that problem. SMILE is the first to watch the whole system in one go.

The instrument that produced the released image is UVI, the ultraviolet aurora imager, one of four science payloads aboard the 2,300-kilogram spacecraft (1,580 kilograms of that is propellant used to climb to its operational orbit). UVI was switched on 16 July 2026 and began returning data on 24 July, when the spacecraft caught a substorm in progress. Substorms are short disturbances in the magnetosphere, produced when a pulse of solar wind compresses Earth’s magnetic field lines, fires a burst of energetic particles down toward both poles, and lights up the oval for tens of minutes. The released 58-second clip covers 00:00 to 00:58 Universal Time, with the timestamp ticking in the upper left corner and distant ultraviolet stars drifting in the background. The way the bright ring ripples and brightens across those 58 seconds is the signature of a substorm loading and unloading the magnetotail.

The image at the top of this post is a single frame from that clip. The crescent Earth is light blue, the way it always looks in the ultraviolet Lyman-alpha and far-ultraviolet bands UVI is tuned to. Around the north pole, the white swirl is the auroral oval itself, including the dayside arc that ground cameras cannot see because the Sun drowns it out. The image is square because UVI’s field of view is roughly 10 degrees across, and the spacecraft’s highly inclined, highly elliptical orbit takes it as far as 121,000 km above the North Pole at apogee, nearly a third of the way to the Moon. From that height, the camera can frame the entire oval in a single exposure. The other three instruments contribute context that UVI alone cannot: SXI, a soft X-ray imager led by the University of Leicester, will map the magnetopause, the boundary where the solar wind meets Earth’s magnetic field, by imaging X-rays produced when solar wind ions swap charge with neutral atoms in the geocorona. MAG, a boom-mounted magnetometer, samples the local field strength. LIA, a light ion analyzer on the platform, counts the solar wind particles themselves. The combination is what makes SMILE different: it is a magnetosphere-wide camera, not a single-region probe.

The science the mission is built to chase is space weather. Solar storms can knock out satellites, drag down power grids, and force airlines to reroute polar flights, and the most damaging ones are the hardest to predict because the chain from solar wind to ground-level aurora runs through a magnetosphere that nobody has watched in its entirety. SMILE’s 45-hour continuous ultraviolet sessions are aimed at filling that gap, capturing the oval through enough of a solar rotation to see how the magnetosphere responds as the wind direction and density shift. ESA expects about 300 substorms across the three-year nominal mission, more than usual because the Sun is at the peak of its eleven-year cycle. The mission consortium, reported by India Today, includes more than 250 European and Chinese scientists and 14 contributing countries, with Airbus Defence and Space leading the payload module assembly at ESA’s ESTEC technical centre in the Netherlands. The mission also carries the first instrument ever designed to look at the magnetopause in X-ray light, opening a window that no previous mission has had.

There are open questions that no amount of engineering has answered yet. SXI, the soft X-ray imager, is currently too sensitive to stray light when pointed at Earth, and the team is uploading new settings and software to the spacecraft to bring the background down. The good news is that the unwanted light is dropping on its own as SMILE’s orbit carries it farther from Earth and as the north pole tilts into winter darkness. Mid-October 2026 should bring SXI’s first clean view of the magnetopause or the northern polar cusp, the funnel-shaped hole in the magnetic field above the pole through which solar wind ions rain down. Once SXI lights up, SMILE will be returning simultaneous X-ray and ultraviolet movies of the same events, the first time anyone has correlated the two views frame by frame. The auroral substorm clip itself, covered by Space.com on 2 October, is what put SMILE in front of a public audience that had not heard of the mission before.

What comes out of the next few months is going to be a database, not a single picture. The first ultraviolet still is the proof that the camera and the orbit work, and the GIF of the 24 July substorm is a teaser for the kind of change the camera can resolve. The real work begins in late October 2026, when SXI is expected to deliver its first usable magnetopause image and the four-instrument observation campaign gets underway. Three years from now, the dataset SMILE accumulates should let researchers tie specific solar wind conditions to specific ground-level disturbances in a way that current models, which lean heavily on extrapolation, cannot. That is the kind of data that takes the guesswork out of space weather forecasts, and that is what the mission was conceived to deliver. The first still was the postcard; the science database is what the postcard is advertising.

 

October 10, 2026

Falcon Heavy flies its first NRO mission

Posted by


A Falcon Heavy rocket climbs off Launch Complex 39A at night, its 27-engine plume glowing bright orange against the dark Florida sky and reflecting off the water beside the pad.


A Falcon Heavy lifted off from Launch Complex 39A at NASA’s Kennedy Space Center at 11:54 p.m. EDT on Thursday, October 1, 2026 (0354 UTC on October 2), carrying the NROL-97 mission into orbit for the National Reconnaissance Office, the U.S. agency that builds and operates the country’s spy satellites. It was the first time the NRO has flown a payload on Falcon Heavy rather than on a single-stick Falcon 9, and it was the first national-security mission procured under the National Security Space Launch Phase 3 Lane 2 contract that the U.S. Space Force awarded in 2025.

The mission was the third SpaceX launch in a thirteen-hour stretch that also saw a Falcon 9 carry the Crew-13 astronauts to the International Space Station from the Cape at 11:10 a.m. ET and another Falcon 9 send 130 smallsat payloads into sun-synchronous orbit on the Transporter-18 rideshare from Vandenberg at 11:32 a.m. PT, per Spaceflight Now’s launch report. The triple-header ended with four booster landings inside a single calendar, the first time SpaceX has brought that many first stages back in twenty-four hours.

Falcon Heavy is the three-booster variant of the Falcon 9: a single core stage flanked by two strap-on boosters that are themselves flight-proven Falcon 9 first stages. Twenty-seven Merlin 1D engines fire at liftoff, producing roughly 22,800 kilonewtons of thrust, and the side boosters separate from the core about two and a quarter minutes into flight before flipping, boosting back toward Cape Canaveral, and returning to land. The Heavy flew for the first time in February 2018, made its second flight in April 2019 carrying the Arabsat-6A satellite, and reached its fourteenth flight on the NROL-97 mission, according to the SpaceX official NROL-97 mission page and the launch archive.

The two side boosters that flew NROL-97 had both flown before. The NRO mission reused them just a month after their last flight, which lofted NASA’s Nancy Grace Roman Space Telescope to L2 in early September 2026. B1104 made its second flight and B1072 its fourth. The new core stage, B1106, was brand new and was expended on the NROL-97 mission; the trajectory required the core to do a disposal burn that did not bring it back to a landing site. After stage separation, the side boosters made their way back. Both returned to Landing Zones 1 and 2 at Cape Canaveral Space Force Station, and the landings produced the audible sonic booms that anyone in central Florida heard three minutes before midnight local time. SpaceX had returned LZ-1 to service for this mission after that pad had been replaced for a stretch of LZs at Space Launch Complex 40, and the SLC-40 landing pad was used earlier in the day by the booster returning from the Crew-13 mission.

Little about the payload itself is public, which is the standard posture for NRO missions. The NRO rarely publishes technical details beyond launch and landing confirmations, and the live SpaceX broadcast carried only the standard hazard area and trajectory notes. It was the first NRO mission to launch under the new procurement structure the agency adopted. The agency bought the launch in 2025 through the competitive NSSL Phase 3 Lane 2 process, and that contract structure is the mechanism the U.S. Space Force uses to buy launches for the majority of its national-security payloads. Lane 2 covers the medium-to-heavy class of missions for which Falcon Heavy is now the baseline ride. ULA’s Vulcan rocket and Blue Origin’s New Glenn are the other Lane 2 providers, and the contract split is the reason Falcon Heavy (rather than first-class Vulcan) flew this payload.

The payload fairing had flown before as well. SpaceX and the NRO confirmed the fairing was previously used on the NROL-95 mission in July, another example of the steady refurbishment and reuse pattern that SpaceX has applied across the Falcon 9 fleet and is now extending into the more delicate fairing hardware. The cost model on a mission like NROL-97 is unusual for the agency context, because the contract is fixed-price rather than cost-plus: the U.S. Space Force’s published Lane 2 task order values run into the hundreds of millions of dollars per mission, with Falcon Heavy missions priced in the $97 million range per the NextSpaceflight launch entry, although the actual NRO contract value has not been disclosed for NROL-97 specifically. The economic argument for the NRO in choosing Falcon Heavy over the alternatives is the standard one in the launch market right now: it is the cheapest heavy-lift rocket that already has a flight history, and the side boosters are reused flight-proven hardware that has already amortized its development cost.

The mission is the third Falcon Heavy launch of 2026, which is shaping up to be a relatively slow year for the rocket compared to 2024 and 2025, both of which saw the vehicle fly close to a head-to-head cadence with the rest of the Falcon fleet. The pace has been limited by payload availability more than by launch capability; the heavy-lift market is dominated by geostationary communications satellites, NASA flagship missions like Roman and Europa Clipper, and a small number of national-security payloads, and there are simply not that many of those missions in any given year. Looking at SpaceX’s published manifest for the rest of 2026 and the early months of 2027, the company has only a couple more Falcon Heavy launches booked in that window [unverified], which would put the rocket on track for one of its quietest years since 2021 so far. The NROL-97 mission is the kind of flight Falcon Heavy exists to handle, and the fact that it was the NRO’s first choice of the rocket suggests that 2027 and 2028 will see the cadence pick up further as the Lane 2 contract awardees ramp their flight rates.

The triple-header that ended with NROL-97 also gave SpaceX a small operational benchmark. Three Falcon-family launches inside thirteen hours, four booster recoveries, two different launch complexes (SLC-40 for Crew-13, LC-39A for NROL-97, and SLC-4E at Vandenberg for Transporter-18), and three different mission profiles (crewed, rideshare, classified heavy-lift), per the Space.com launch report. It was the operational shape of the Falcon program in late 2026, and it was the first NROL mission ever to ride on a Heavy rocket. The next national-security mission on the manifest is likely to be a Lane 1 contract (meaning a Vulcan or a National Rocket), unless the Space Force decides to push more Lane 2 weight onto Falcon Heavy next year. That decision will tell us whether NROL-97 was a one-off or a real sign of the future for the agency’s Falcon Heavy launcher.


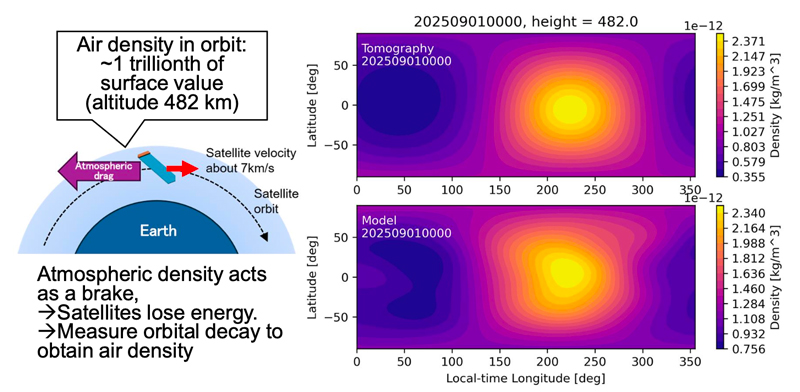
A two-panel world map showing thermospheric density reconstructed from Starlink orbital decay at 482 km altitude on 1 September 2025 (top) compared with a reference model (bottom), with a schematic on the left showing how atmospheric drag decelerates a satellite in orbit.


For decades the thermosphere, the broad band of electrically neutral gas that sits between roughly 100 and 1,000 km above the ground, has been one of the most expensive places on Earth to study. A handful of in-situ instruments on satellites like ESA’s SWARM constellation have nibbled at it one orbit at a time. Atmospheric models fill the gaps, but with rising space traffic the gaps have grown political: collision avoidance, reentry forecasting, and space-weather alerts all need accurate thermospheric density on short timescales, and the measurements feeding those models are sparse. A team at Kyoto University has now shown that the same orbital data SpaceX publishes for free to coordinate its Starlink constellation can be turned into a continent-scale thermospheric density snapshot, using a method borrowed from medical imaging. The result, published 30 July 2026 in Earth, Planets and Space, is the first latitude-by-longitude map of thermospheric density reconstructed entirely from the orbital decay of commercial broadband satellites.

The thermosphere matters because every spacecraft in low Earth orbit lives inside it. Even at 500 km altitude the gas is thin enough that an astronaut on an EVA suit would consider it vacuum, but it is dense enough that a 250-kilogram satellite experiences a steady, measurable aerodynamic drag. That drag pulls satellites down, which is why the International Space Station and thousands of debris fragments eventually reenter. It is also why precise orbit prediction is so hard: a small change in thermospheric density can shave minutes off a predicted pass, and during a geomagnetic storm a single high-speed plasma plume from the Sun can change density at satellite altitude by a factor of two in less than an hour.

The economic stakes have grown with Starlink, OneWeb, Kuiper, and the Chinese Guowang constellation. As of mid-2026 there are roughly 9,000 active satellites in low Earth orbit, with another 50,000 pieces of tracked debris larger than 10 cm. Every collision risk assessment, every conjunction warning, every debris-reentry prediction depends on knowing how dense the air is along each object’s path. Today, most operational systems rely on either accelerometer data from a few sentinel satellites or on empirical density models calibrated against historical storms, which means they tend to miss local structure in the thermosphere: the day-night asymmetry, the geomagnetic-latitude bite, the traveling atmospheric disturbances that follow a sunrise terminator around the globe.

A method that turns routine commercial satellite tracking into a near-real-time thermospheric density map would change that. It would also change what counts as “ground truth” for the physics of the upper atmosphere: the same data set that lets SpaceX coordinate its own orbital slot allocation could now be re-used by every atmospheric scientist with a Python notebook and access to a public ephemeris feed.

The Kyoto University group, led by space engineer Mamoru Yamamoto with first author Takuya Sori, had already pushed in this direction. In an earlier paper they showed that they could estimate how thermospheric density varies over time and altitude using public Two-Line Element (TLE) data, the short text records that amateur satellite trackers use to find the ISS. The technique was time-honored: a satellite in a decaying orbit loses energy at a rate set by the local air density, so inverting the decay curve gives density as a function of height and time.

The 2026 paper takes the next step. Instead of treating each satellite as a single measurement, the team treated the constellation as a moving grid of sensors. For roughly 1,200 Starlink satellites at an altitude of 482 km, they calculated orbital energy loss from publicly broadcast ephemeris messages over a chosen interval and fed the resulting drag estimates into a tomographic inversion. Tomography, the same family of math that turns a CT scanner’s one-dimensional projections into a 3-D image, is good at reconstructing a 2-D field from many intersecting 1-D lines. Here the lines are satellite ground tracks across the globe.

The reconstruction, anchored on a single day of data from 1 September 2025, produced a full two-dimensional density map of the thermosphere at roughly 500 km altitude, with peaks over the sunlit mid-latitudes and lower density on the night side. When the Kyoto team compared their tomographic result against density profiles recorded along their tracks by the European Space Agency’s SWARM satellites, the agreement was within the noise floor of the comparison: both showed the same high-density lobes over the daytime side of the Earth, and the same minima near the dawn terminator.

The work, formally titled “Tomography of thermospheric density from Starlink Ephemeris: initial report”, appeared in Earth, Planets and Space on 30 July 2026. Kyoto University’s research news office published a press release on 4 August, and the result was picked up across space and Earth-science outlets including ScienceDaily and Phys.org. A KURENAI repository copy is available without paywall.

The “ephemeris” in the new paper is not the same thing as a TLE. A TLE is a compact orbital state vector published by the U.S. Space Force’s Space-Track catalog; it is good to roughly a kilometer of position accuracy and is updated a few times a day. SpaceX publishes a higher-precision ephemeris for each Starlink satellite, broadcast continuously over the same radio link the satellites use for internet traffic, which includes predicted position and velocity to a fraction of a meter. It is the kind of data that, until now, was treated as operational infrastructure rather than science data.

Drag at 482 km is dominated by collisions with atomic oxygen, the dominant species in the upper thermosphere. The momentum transfer rate per unit density for a satellite at typical Starlink ballistic coefficients has been measured in orbit many times; the Kyoto team leans on those calibrations rather than computing from first principles. The bigger problem is geometry. A single satellite samples density along a single line on the globe. To reconstruct a 2-D field you need many satellites crossing many different latitudes and local solar times in the same interval. With about 1,200 Starlinks in a near-polar orbit that circles the Earth every 90 minutes or so, the constellation completed more than a hundred full ground tracks during the chosen 24-hour window, which is enough to populate every 5-degree latitude-longitude cell at least a few times.

The “tomographic inversion” itself is a weighted least-squares fit with a smoothness prior. Weights come from each satellite’s expected drag uncertainty (a function of mass, frontal area, and atmospheric composition model), and the smoothness prior prevents the optimizer from inventing small-scale structure the data cannot resolve. The output is a single snapshot, not a movie. A time series would need the inversion repeated on a rolling window.

Independent validation mattered. The European Space Agency’s SWARM mission, launched in 2013, has been measuring thermospheric density along its three orbital tracks for over a decade. SWARM reads a non-gravitational acceleration directly with an onboard accelerometer, which is the gold standard for in-situ density measurements. On 1 September 2025 SWARM’s tracks happened to fall inside the latitude-longitude cells the Kyoto inversion had populated. The two density fields agreed at the level expected from SWARM’s own noise floor, plus some extra uncertainty the Kyoto team acknowledged from their assumption that every Starlink satellite has the same effective ballistic coefficient.

The remaining bottleneck is uniform ballistic coefficient. Real Starlinks vary slightly in mass and orientation, and not all of them have their ephemeris precision documented publicly. The Kyoto group flags this as the next refinement to chase.

Three numbers summarize the work: 1,200 satellites, 482 km altitude, one day of data. Together they describe the smallest possible demonstration that a global commercial broadband network can be repurposed into a free, passive, science-grade sensor for the upper atmosphere.

A near-real-time implementation would need only an automatic ephemeris ingestion pipeline and a routine inversion, something the team has indicated they are working on. If such a pipeline goes operational, atmospheric modelers will have far more ground truth on the quiet-day thermosphere than they have today, and the same data will feed directly into space-weather products that already serve satellite operators.

For now the result is a proof of concept: enough to show it works on one day, not yet a system that rewires upper-atmosphere science.


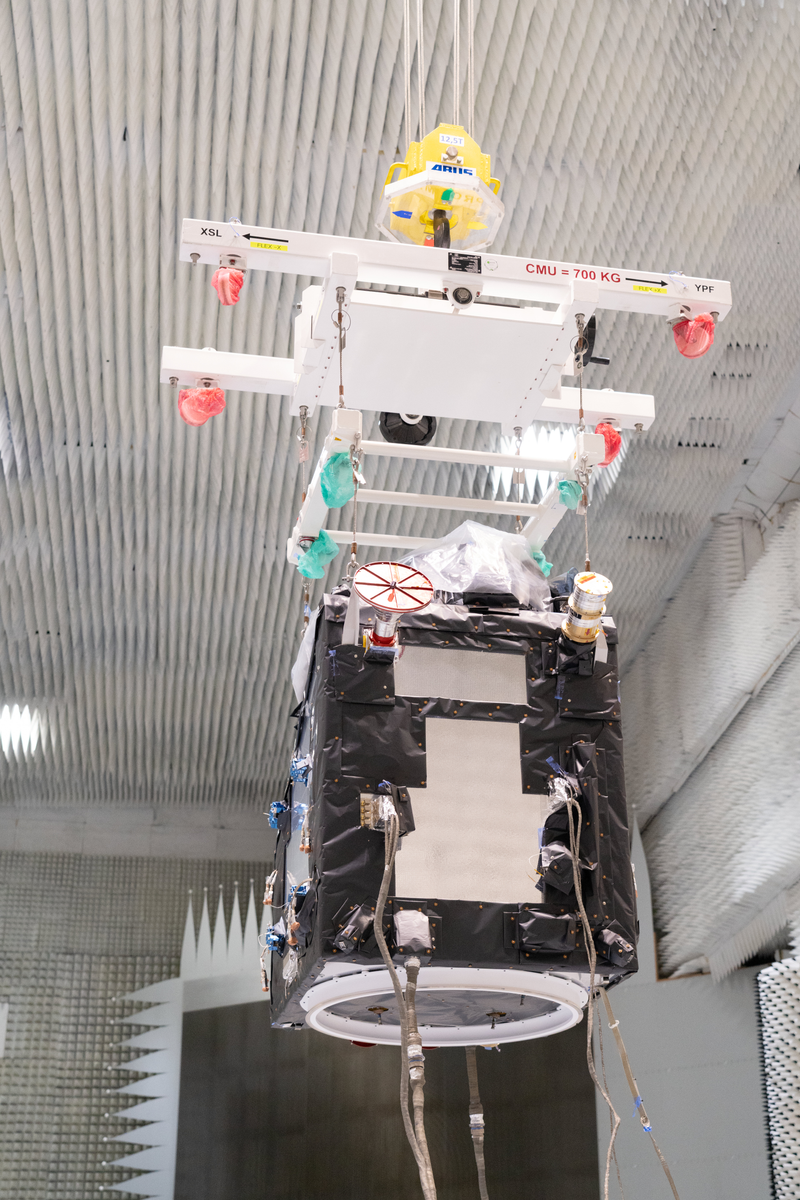
ESA's Fluorescence Explorer satellite FLEX on display at a Thales Alenia Space cleanroom in Cannes, France, April 2026. Credit: ESA


In late August 2026, inside a clean tent at the Ensemble de Lancement Vega in Kourou, French Guiana, technicians finished filling a small Italian-built satellite with 30 kilograms of hydrazine. The spacecraft had crossed the Atlantic once already, aboard the MN Colibri, departing Cannes on 9 July and arriving at Pariacabo harbour on 12 July (Wikipedia, “FLEX (satellite),” August 2026). On 15 September 2026 it leaves the ground on a Vega-C, alongside the Copernicus Sentinel-3C satellite (ESA FLEX facts and figures, 2026). The mission has a 3.5-year design life, an 814-kilometre sun-synchronous orbit, and a 400-kilogram dry mass. Its job is not imaging clouds or measuring sea level. It will stare down at forests and croplands and try to measure a faint red glow that plants produce when they photosynthesise, a signal too dim to see with the eye and almost too dim to see from low Earth orbit.

Roughly 120 gigatonnes of carbon per year move between the atmosphere and terrestrial vegetation through photosynthesis, more than ten times the mass of all the carbon humanity emits from fossil fuels (Le Quéré et al., Earth System Science Data, 2024). Almost every climate projection depends on getting that number right, and the spread across current carbon-cycle models is on the order of ±20 GtC/yr. Sun-induced chlorophyll fluorescence, the 1–2% of absorbed light that leaves re-emit at wavelengths around 685 nm and 740 nm, is a direct optical window onto photosynthetic efficiency, because every absorbed photon ends up in one of three places: photochemistry, heat, or fluorescence (Wikipedia, “Chlorophyll fluorescence,” 2026). In a healthy leaf, roughly 82% of absorbed photons drive carbon fixation; the rest is split between heat and this faint red glow.

Until now, fluorescence has been measured with bench-top instruments or aircraft campaigns like HyPlant flown out of Forschungszentrum Jülich (eoportal, FLEX, 2017). There is no global, repeatable, satellite-derived fluorescence product for the terrestrial biosphere. ESA selected FLEX as the eighth Earth Explorer in November 2015, and the satellite has spent a decade working up to one question: can you read the productivity of a soybean field, a larch forest, and a millet plot, all from 800 kilometres up, using only sunlight the leaf itself emitted back?

The hardware story of FLEX starts in November 2016, when ESA awarded the main instrument contract to Leonardo. In January 2019, Thales Alenia Space in Cannes became prime contractor for both spacecraft and instrument integration. The bus is an evolution of the Myriade family that flew COROT and PARASOL, but the avionics come from the Sentinel-3 line. In orbit the satellite measures 1.5 m × 4.9 m × 1.6 m, mass is 400 kg, end-of-life power is 950 W from a deployable solar array backed by a 57.6 Ah Li-ion battery (ESA FLEX facts and figures). The single instrument, the FLuorescence Imaging Spectrometer (FLORIS), covers 500–780 nm with variable spectral sampling: 0.1 nm in the two telluric oxygen absorption bands (O2-A at 759–769 nm and O2-B at 686–697 nm), 0.5–0.65 nm across the red edge, and 2.0 nm in the photochemical reflectance index band (500–600 nm). Spatial resolution is 300 m on a 150 km swath (eoportal, FLEX).

The clever trick is the tandem formation with Sentinel-3. FLEX orbits 40–100 km ahead of a Sentinel-3 platform, so that OLCI and SLSTR look at the same footprint within 6–15 seconds of FLORIS (eoportal, FLEX). Sentinel-3’s broad-band radiance is used to estimate the reflected sunlight contribution inside the O2-A and O2-B absorption lines, which can otherwise swamp the fluorescence signal at the 1–3 mW m⁻² nm⁻¹ sr⁻¹ level the mission is trying to recover. Two spacecraft, two spectrometers, one number.

Late summer 2026 was the home stretch. By April 2026, the integrated satellite had passed functional and environmental testing at Cannes (ESA, “FLEX shows off,” April 2026). It shipped on the MN Colibri to Pariacabo in early July 2026, was uncrated on 21 July, and was fuelled in late August. The launch is scheduled for 15 September 2026 at 22:21 local time from the ELV pad at the Guiana Space Centre on flight VV30 of the Vega-C, alongside Sentinel-3C (ESA press release N° 35–2026, 20 July 2026).

Vega-C is a four-stage European workhorse: a P120C solid first stage (4,323 kN, 279 s Isp, 141.6 t of HTPB propellant), a Zefiro 40 solid second stage (1,304 kN, 293.5 s Isp), a Zefiro 9 solid third stage (317 kN, 295.9 s Isp), and a storable AVUM+ upper stage (RD-843 engine, UDMH/N₂O₄, 2.42 kN, up to five restarts) (Wikipedia, “Vega C,” 2026). FLEX at 400 kg plus Sentinel-3C at roughly 1,250 kg fits inside the rocket’s 2,300 kg sun-synchronous capability.

The fluorescence signal is small because most absorbed light goes to chemistry and heat. Under steady-state illumination, leaf-level energy partitioning is

Y_PSI + Y_NPQ + Y_F = 1

where Y_PSI is the quantum yield of photochemistry through Photosystem II, Y_NPQ is non-photochemical quenching (heat dissipation via the xanthophyll cycle and PsbS protein), and Y_F is the fluorescence yield. FLEX measures Y_F directly; the carbon flux GPP (gross primary production) is then typically inferred as

GPP ≈ APAR × Y_PSI

with APAR (absorbed photosynthetically active radiation) reconstructed from FLORIS’s PRI and red-edge bands plus Sentinel-3’s OLCI/SLSTR radiances.

The reason the O2-A band (759–769 nm) matters is that molecular oxygen in the atmosphere absorbs sunlight there. Inside that absorption feature, any photons reaching the satellite must have been re-emitted at the surface, by the leaf. The depth of the absorption line in a downward-looking spectrum tells you how much extra radiance fluorescence is adding, after correcting for surface reflectance and atmospheric scattering. The Fraunhofer IOF in Jena built the double-slit assembly that defines FLORIS’s spectral resolution in those bands down to 0.1 nm. The narrower the slit, the cleaner the line-depth measurement, but the weaker the signal-to-noise ratio (Wikipedia, “FLEX (satellite),” 2026).

The 27-day repeat cycle at 814 km and 98.64° inclination matches Sentinel-3A’s ground track, so every 27 days the tandem pair sees the same vegetation at the same local time of day and solar geometry. That is essential for separating fluorescence from bidirectional reflectance effects. The 814 km altitude was chosen to give a 27-day repeat with 14+ orbits per day, and to keep the 300 m pixel footprint compatible with Sentinel-3 OLCI.

The third axis of the engineering is calibration stability. FLORIS is an imaging spectrometer, so pixel-to-pixel and band-to-band gain drift will alias straight into apparent fluorescence trends. On-board calibration uses solar diffuser references plus periodic lunar looks. The Sentinel-3 OLCI instrument flies the same calibration philosophy, which is one reason ESA reused its avionics and reference samples on FLEX.

Once commissioned, FLEX is expected to deliver monthly global maps of sun-induced chlorophyll fluorescence at 300 m × 300 m, the first such dataset produced routinely from orbit (ESA FLEX facts and figures). For plant physiologists, the result will be a four-dimensional look at photosynthetic efficiency, with direct implications for drought monitoring, agricultural yield forecasting, and the calibration of dynamic global vegetation models. For the carbon-cycle community, the value is a top-down constraint on GPP that does not depend on meteorological reanalysis.

If FLEX works, it will retire a long-standing assumption baked into climate models, that the greenness of a canopy, measured by NDVI or similar indices, is a proxy for what the canopy is actually doing. Two fields can look equally green and yet be photosynthesising at very different rates, depending on water stress, nutrient status, and temperature. FLEX will measure the difference. The world has never watched photosynthesis happen from space in real time. In three weeks, it will start to.


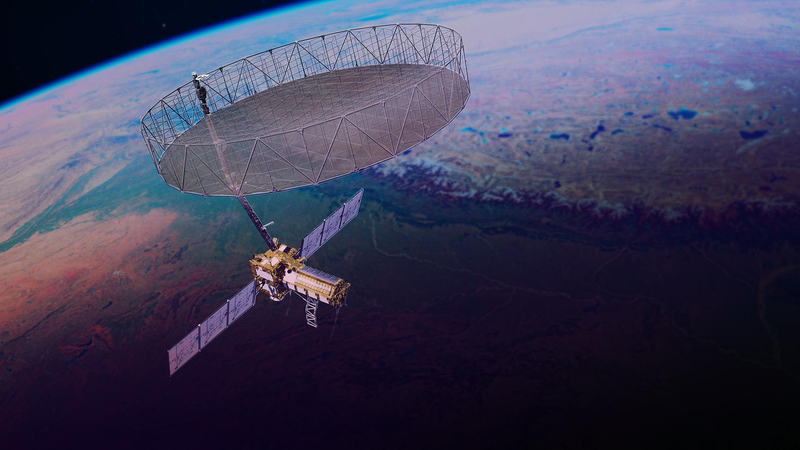
A radar satellite carrying a large drum-shaped mesh reflector on a boom flies above a false-colour landscape of river valleys and lakes.


The GSLV Mk II is not, on paper, the most glamorous rocket in the world. It does not chase Falcon 9 reuse statistics, and it has historically been used for the unglamorous work of dropping navigation payloads into geostationary transfer orbit. On July 30, 2026, at 8:10 a.m. Eastern, an Indian GSLV F-16 lifted off from Satish Dhawan Space Centre on the Palk Strait coast, and for the first time in the vehicle’s history it pointed its cryogenic upper stage south-southwest, toward a 747-kilometer sun-synchronous orbit. The payload was a 2,800-kilogram stack that NASA and the Indian Space Research Organisation (ISRO) had spent eleven years building together. NASA called it the most expensive single instrument it had ever flown; ISRO called it the heaviest foreign payload it had ever launched. Within twenty minutes, both ground stations had signal. The spacecraft, NISAR, was healthy on orbit, and the largest unfurlable radar reflector ever launched was still folded against its side (SpaceNews, July 21, 2026).

Earth-observing radar is not new. The European Space Agency’s ERS-1 flew a C-band synthetic aperture radar in 1991. Japan’s ALOS, Germany’s TerraSAR-X, and the Copernicus Sentinel-1 constellation have, between them, turned interferometric SAR (InSAR) into a routine tool for tracking millimeter-scale ground motion across continents. What NISAR adds is two capabilities stacked together: it is the first civilian radar satellite to carry both an L-band system at 1.257 gigahertz (about 24 centimeters wavelength) and an S-band system at 3.2 gigahertz (about 9 centimeters), sharing one 12-meter mesh reflector and one 9-meter boom (NASA, 2026 mission fact sheet).

That dual-frequency design closes a gap that has bedeviled the field for thirty years. L-band penetrates vegetation and dry soil, so it stays coherent over forests and crops long enough to measure slow tectonic creep. S-band is more sensitive to the top surface, so it tracks flood extent, snow wetness, and crop structure. Flying them together means a single pass produces two interferograms that can be differenced to remove atmospheric phase noise. The mission is set to map nearly all of Earth’s land and ice surfaces twice every twelve days, every cycle of 173 orbits, for at least three years (NASA, 2026).

The cost is real: NASA’s contribution sits at roughly $1.2 billion, ISRO’s share at about 7.88 billion rupees ($91 million) in 2017 terms, though the actual figure is higher now (SpaceNews, July 21, 2026). That is the price of joining two cautious space agencies into one program that survived an antenna repair that required a round-trip shipping container between Bangalore and California.

The GSLV F-16’s profile looked normal on paper: liftoff mass around 420 tonnes, the standard S9.4 cryogenic third stage burning liquid hydrogen and liquid oxygen, a 17-meter payload fairing. What was not standard was the orbit. The Satish Dhawan range usually targets 36,000-kilometer geostationary slots, and the polar corridor is dominated by the smaller, solid-fueled PSLV. Pushing a 2,800-kilogram payload with a stowed 12-meter mesh reflector into a sun-synchronous orbit required every kilogram of performance the cryogenic upper stage could deliver, and a launch window that avoided the eclipse season that would have left the stowed reflector swinging through 200-degree temperature swings during deployment.

The earlier slipped target of March 2025 was abandoned because engineers discovered during thermal-vacuum testing that the reflector’s black structural rods would absorb too much solar heat stowed. NASA shipped the antenna back to Goddard Space Flight Center, where technicians applied strips of reflective tape to the rods, and put it on a C-130 back to India in October 2024 (SpaceNews, December 2024). After that, the schedule bowed to ISRO’s launch cadence: the NVS-02 navigation satellite needed the same pad first, six to eight weeks of pad refurbishment followed, and then a slot had to be picked that would keep the spacecraft out of eclipse for at least the first weeks of its commissioning.

When the rocket climbed off the pad on July 30, it did so against a backdrop few in the West paid attention to. ISRO had lost the EOS-09 radar imaging satellite on a PSLV third-stage failure on May 17, 2026, and the NVS-02 navigation satellite had been stranded in the wrong orbit in January after a propellant valve failed to open. Neither hardware line is shared with GSLV, but the question of process discipline was in the air. The July 21 press conference that confirmed the launch date did not include a single ISRO representative, a fact NASA attributed to the time difference but which industry sources flagged as unusual (SpaceNews, July 21, 2026). Two days after launch, both parties confirmed that the spacecraft was operating normally and that solar array deployment had succeeded.

The most counter-intuitive thing about NISAR is that it is not, strictly, an imaging instrument. A SAR builds an image by emitting a chirped radar pulse, listening to the echo, and using the platform’s forward motion to synthesize an antenna tens of kilometers long. Range resolution comes from the chirp bandwidth (NISAR’s L-band transmits 80 megahertz of bandwidth, giving roughly 2 meters of slant-range resolution; S-band transmits 37.5 megahertz for about 5 meters). Azimuth resolution comes from Doppler processing of the returns along the flight track. The signal is recorded in phase, so a second pass from almost the same position lets you subtract two images and recover ground displacement to the centimeter level. The relation is:

Δr = λ / (4π) * Δφ

where λ is the radar wavelength and Δφ is the wrapped interferometric phase. At L-band, a phase change of one radian corresponds to about two centimeters of line-of-sight motion.

The reflector is the engineering showpiece. Stowed, it fits inside a 1.5-meter collar; deployed, it becomes a 12-meter ribbed disk covered in gold-plated molybdenum wire mesh. The 9-meter boom that holds the feed assembly is built from composite truss segments that unfold in a sequence to avoid contact with the reflector surface; the whole assembly weighs about 145 kilograms. NASA and Astro Aerospace invented a new hinge mechanism because earlier mesh reflectors of this diameter were not designed for the thermal cycling of a sun-synchronous dawn-dusk orbit.

The orbit itself is part of the engineering story. NISAR flies in a 6 a.m. / 6 p.m. ascending-node sun-synchronous configuration, which gives consistent illumination across the 12-day cycle. The exact repeat of 173 orbits in 12 days constrains the swath to about 242 kilometers, which in turn constrains the antenna geometry. The mission team designed a ScanSAR mode in which the radar beam is electronically steered across five sub-swaths in elevation, then assembled into a wide swath at the cost of coarser azimuth resolution. NISAR will operate primarily in this mode.

Finally, the data pipeline. NASA’s Alaska Satellite Facility DAAC will host the L-band data; ISRO’s Bhoonidhi portal will host the S-band data. Both agencies committed to a 24-hour urgent-acquisition capability: within a day of a magnitude-7 earthquake, NISAR could re-point to map the coseismic deformation field over hundreds of kilometers.

If commissioning goes as planned, NISAR will begin science operations in October 2026, after roughly ninety days of radar calibrations, antenna deployments, and orbit trim maneuvers. Early months of data will be dominated by earthquakes, glacier flow, and agricultural calibration campaigns over the US Corn Belt. Within a year, NISAR should be producing the most consistent global interferometric stack ever assembled, a baseline that will outlast Sentinel-1C and ALOS-4.

The broader lesson is older than radar. Eleven years, two agencies, 2,800 kilograms, one reflector, two frequencies. Earth observation at this scale is no longer a single-country program. What NISAR proves is that two different bureaucracies can still agree on what a centimeter means.


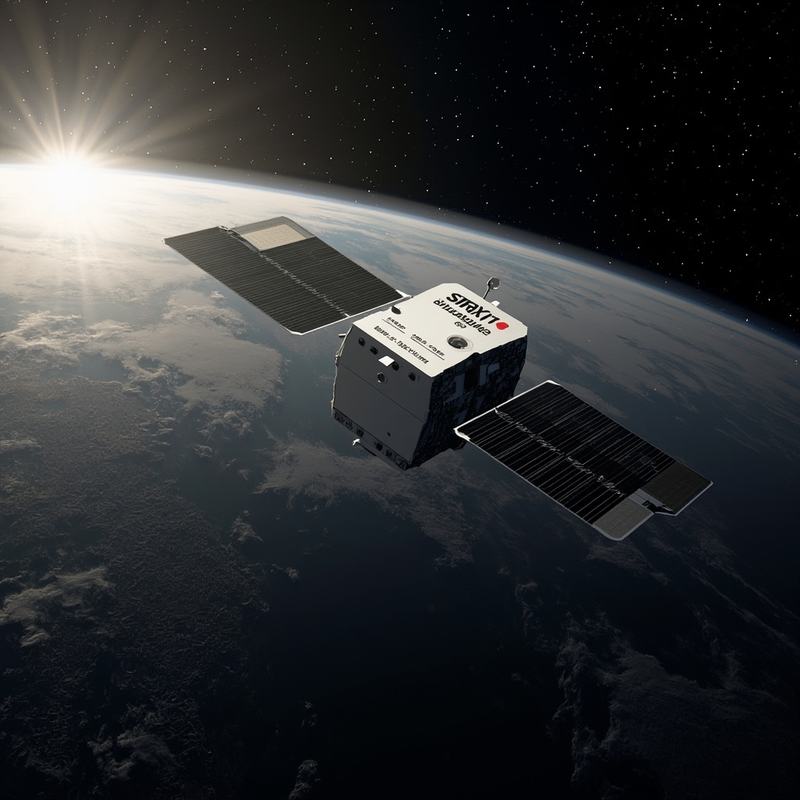
Synspective's StriX-12 synthetic aperture radar (SAR) satellite in low Earth orbit at ~500 km altitude in sun-synchronous orbit, its deployable X-band slot-array antenna extended and two solar arrays deployed, with Earth below rendered in muted grayscale SAR-backscatter tones (urban areas bright, water dark, terrain in mid-tones).

Rocket Lab’s 96th Electron mission, named “Owl By The Dozen,” lifted off from Launch Complex 1 in Mahia, New Zealand, at 3:22 PM New Zealand Standard Time on September 19, 2026, and placed a single Synspective StriX satellite into a precise 572 km sun-synchronous orbit (Rocket Lab, September 19, 2026). One satellite, one mission, one line in the launch log. The line below it matters more. Synspective is no longer a constellation-builder pitching a future roadmap; it is now a constellation-operator pitching capacity to anyone who can sign a contract.


The reason it took twelve satellites to get there is the reason synthetic aperture radar (SAR) was the most expensive way to look down at Earth for most of its history. SAR works through cloud, through rain, and through the polar night — three failure modes that optical imaging cannot survive. The instruments that proved it could be done were government-funded and large: Canada’s RADARSAT-2, Germany’s TerraSAR-X, Europe’s Sentinel-1 family, and the just-launched NASA-ISRO NISAR, which reached orbit in July 2026 on an Indian GSLV with a $1.2 billion NASA contribution (SpaceNews, 2026). Those are flagship observatories, not commercial services. Synspective’s bet since its 2018 founding has been that X-band SAR could be done on a 100-kilogram-class satellite with a foldable planar slot-array antenna that opens to roughly five meters across once on orbit, at one-tenth the mass and one-twentieth the cost of a large SAR satellite (Synspective press release, March 2026). Twelve operational satellites later, that bet is producing 1-3 meter ground-resolution imagery across Stripmap and Sliding Spotlight modes, in any weather, day or night.

The company was founded on February 22, 2018, when Keio University space-policy professor Seiko Shirasaka met small-satellite engineer Motoyuki Arai, who had been running SAR technology development inside Japan’s Cabinet Office ImPACT initiative (Synspective corporate history, 2024). The ImPACT program had spent eight years funding compact SAR architectures through JAXA and the Tokyo Institute of Technology. Shirasaka brought the policy and commercial framing; Arai brought the hardware. StriX-1 reached orbit in September 2022. The four years since have been about factory cadence: StriX-α and StriX-β as demonstrators, then operational satellites through 2024, 2025, and 2026 — StriX-9 in May 2026, StriX-10 in June, StriX-11 on September 15, and now StriX-12 four days later (Synspective press releases, 2026). The cadence is the headline. A constellation that grows by one every few weeks can be refilled, replaced, and reshaped on a commercial timetable.

September 2026 is also the month Synspective changed what it sells. On September 16, the company announced Synspective OMNIA, a program that lets partners — national space agencies, prime contractors, regional governments — lease a dedicated share of StriX capacity, the same way cloud customers lease dedicated server instances rather than renting virtual machines by the hour (Synspective corporate site, September 16, 2026). Two days later, on September 18, the company signed a launch services agreement with Mitsubishi Heavy Industries for two additional StriX satellites on the H3 rocket, the Japanese flagship launcher that has been flying cleanly since its 2023 maiden flight (SpaceWatch Global, September 18, 2026). And on September 19, the Rocket Lab mission placed the latest StriX into the orbit plane Synspective’s operations team had assigned it. Three milestones, one direction: from building capacity to renting it.

The competitive context is unavoidable. Finnish operator ICEYE has built the largest commercial SAR constellation in the world, with more than thirty satellites in orbit and a deep backlog of customer contracts. American operators Capella Space and Umbra are scaling their own X-band fleets, with government and commercial customers on both sides of the Atlantic. Synspective’s pitch is different in two ways: Japanese-government alignment on procurement and export, and a deep partnership with NTT DOCOMO for emergency-response data that gives the company a domestic anchor no foreign operator can match. Publicly announced customers include Nihon Suido Consultants for water-infrastructure monitoring and several ASEAN disaster-management agencies (Synspective press releases, 2021-2026). OMNIA is the formal mechanism that turns those relationships into a product.

What makes a 100-kilogram radar satellite actually useful is the same thing that makes a five-meter antenna possible in a refrigerator-sized box: synthetic aperture. Range resolution is bounded by the bandwidth of the chirped pulse the radar transmits, following Δr = c / (2B), where c is the speed of light and B is the chirp bandwidth. StriX’s published maximum bandwidth at X-band is around 300 MHz, which gives a slant-range resolution near 0.5 meters, equivalent to roughly 0.7 meters on the ground at typical incidence angles (Synspective SAR Data Product Guide v13.0, 2025).

Azimuth resolution is the harder problem, because the synthetic aperture is what lets the small real antenna behave like a much larger one. As the radar moves along its orbital track, it transmits a pulse, listens to the echo, moves on, and repeats. Coherently combining returns accumulated across a synthetic length L_synth produces a synthesized beamwidth θ_synth = λ / (2 L_synth). For StriX’s X-band frequency around 9.65 GHz, λ is approximately 3.1 centimeters; a one-kilometer integration length gives azimuth resolution near 1.5 centimeters in slant range, which projects to the 1-3 meter ground resolution Synspective advertises once geometric corrections are applied (Cumming & Wong, Digital Processing of SAR Data, 2005).

The trade-off between the two acquisition modes is the trade-off between area and detail. In Stripmap, the antenna points at a fixed angle off-nadir and the swath width is set by the elevation beamwidth — typically 10-30 kilometers for StriX at this altitude. In Sliding Spotlight, the antenna steers backwards as the satellite moves forward, lengthening the synthetic aperture and shrinking the pixel size at the cost of a smaller illuminated footprint. StriX’s documented resolution floor sits near 1 meter in Sliding Spotlight and closer to 3 meters in Stripmap (Synspective SAR Data Product Guide v13.0, 2025). A tenfold reduction in swath width buys you a threefold improvement in pixel size, which is roughly the trade-off the operators of every compact SAR constellation have accepted since the late 1990s.

The reason any deployable antenna is needed at all is the fundamental constraint of small satellites. A real-aperture radar’s azimuth resolution is set by the physical length of the antenna along the flight direction. At 572 km altitude and X-band, a 5-meter real antenna gives roughly 60 meters of azimuth resolution — useless for sub-3-meter products. The foldable planar slot-array design lets that 5-meter structure launch inside a 100-kilogram spacecraft roughly the size of a small refrigerator and unfurl once on orbit. The same physical trick that has made commercial SAR affordable is what makes every modern low-Earth-orbit constellation economical: folding space into the rocket fairing, then unfolding it once there.

What changes because of this is the texture of the commercial Earth-observation market. Through 2025, the data vendors in this space sold finished imagery — a one-time product, delivered as a GeoTIFF or a processed surface-change map. With OMNIA, Synspective has moved up the stack to selling committed observation time and the right to task specific satellites, which is closer to selling bandwidth than to selling print. The two H3-launched StriX satellites scheduled for late 2027 will push the operational constellation past fourteen satellites on the way to a planned thirty-satellite fleet. Each additional plane reduces revisit time for any point on Earth from days to hours. Inside Japan, that means faster response to typhoons and landslides; across Southeast Asia, it means disaster-management agencies can ask what a flood looks like right now and get an answer before the clouds clear. The flattening of remote sensing into a utility has been forecast for a decade. The orbit-stop of September 2026 is when that forecast started becoming an operational reality.