OrbitalHub

Where curiosity reaches escape velocity.

Domain is for sale. $50,000,000.00 USD. Direct any inquiries to contact@orbitalhub.com.


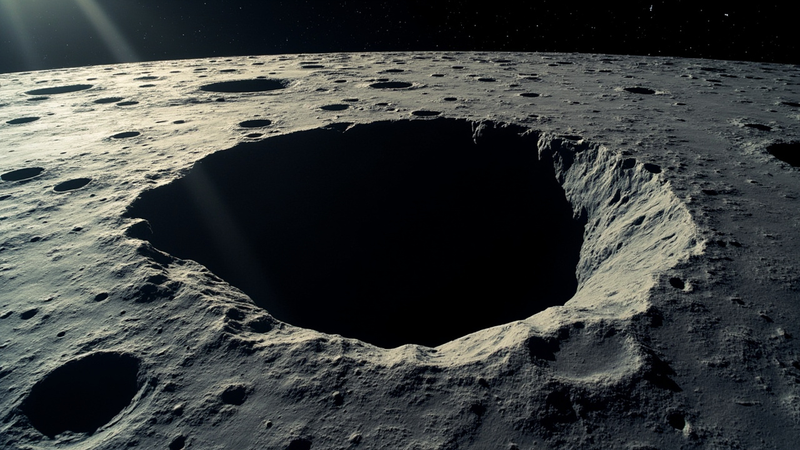
A high-resolution visualization of the Marius Hills Pit, a roughly 50-meter skylight in Oceanus Procellarum, showing the dark circular opening casting a deep shadow onto the surrounding mare plain.


There is a hole on the Moon that has not stopped nagging planetary scientists since they first noticed it. The Marius Hills Pit sits in Oceanus Procellarum, the largest of the lunar maria, in a region already famous for holding the densest collection of volcanic features anywhere on the surface. Lunar Reconnaissance Orbiter images show an opening roughly 50 meters across and somewhere between 30 and 40 meters deep, the floor lost in permanent shadow, the walls exposing layers of basalt that no other spot on the Moon leaves so conveniently within reach. JAXA’s SELENE (Kaguya) spacecraft photographed it in 2009. NASA released the highest-resolution LROC view in 2010. The European Space Agency published its own montage the same decade. And for sixteen years the question has been the same: does the pit lead down into a tube, or is it just a hole?

On October 1, 2026, NASA picked a team to find out (NASA, October 2 2026). The project is called GIMLI — Geophysical Instruments for Marius Lunar pit Investigation — and it will be led by Nathaniel Putzig of the Planetary Science Institute. Honeybee Robotics, the Blue Origin-owned outfit that built the legs for Mars 2020 and the Sample Retrieval Lander arms, will provide the instruments and the project management. The Norwegian Space Agency is contributing the ground-penetrating radar. Co-investigators are spread across Boise State, Johns Hopkins, the Lunar and Planetary Institute, and the University of Oslo. The payload will fly to the surface through NASA’s Commercial Lunar Payload Services (CLPS) initiative under the agency’s Payloads and Research Investigations on the Surface of the Moon (PRISM) program.

What makes GIMLI unusual is the combination. Three independent geophysical methods will be aimed at the same target from the same lander. A ground-penetrating radar will send electromagnetic pulses into the regolith and time their echoes. A gravimeter will measure the local gravity field to a precision high enough to register the slight pull deficit left by an underground void. And a third system — the one Putzig has been waiting to fly for most of his career — will do active-source seismology, the deliberate thumping of the ground with a small explosive or impact source and the recording of how the resulting acoustic wave bounces back. That last technique has not been run on the Moon since Apollo 17 in December 1972 (TechTimes, October 2 2026).

The reason anyone cares whether the tube exists is not the geology. It is the architecture. A lunar day lasts 29.5 Earth days, and the surface temperature swings between roughly +120 and -170 degrees Celsius. Galactic cosmic rays and solar energetic particles deliver the equivalent of a chest x-ray every few seconds to anything exposed. Micrometeoroids the size of sand grains arrive at 70 km/s. A long lava tube, by contrast, holds a near-constant temperature near −20 °C in its interior and provides a meter or more of rock overhead — natural radiation and impact shielding that no inflatable habitat can match. If the Marius Hills Pit really does open into a tube big enough to walk through, the engineering problem of where to put the first permanent lunar base gets substantially easier.

The orbital evidence is already strong. Kaku and colleagues, working with the 4–6 MHz echoes from SELENE’s Lunar Radar Sounder, reported in 2017 a candidate tube roof around 120 meters below the surface near the Marius Hills skylight (Kaku et al., LPSC 2017 abstract 1711). Separately, Chappaz et al. used gravity-gradient data from NASA’s Gravity Recovery and Interior Laboratory (GRAIL) mission to flag a Bouguer anomaly consistent with a low-density void several kilometers east of the pit. Both results are suggestive, not conclusive — orbital radar and gravity can detect a void only in aggregate, with poor horizontal resolution and a strong dependence on what the surrounding rock happens to look like. The case for a usable tube is the kind of question that has to be answered from the surface, with instruments whose geometry is known to within a meter.

Active-source seismology is well suited to that geometry. The classic field setup is two parts: a source — Apollo 17 used a crew-deployed thumper that fired small explosive charges — and a string of geophones that record the wave’s arrival times. The wave’s group velocity depends on the elastic moduli of the material it traverses, and any sharp acoustic-impedance contrast — a void, a frozen-melt boundary, a regolith–bedrock contact — produces a reflection. By shooting from several known source positions and recording on a known array, you can triangulate the depth and shape of the reflector. The technique is what oil and gas geophysicists have used for a century to map the geometry of reservoirs, and it is the same mathematics that Putzig’s team will apply to a 50-meter hole in a mare basalt. The gravimeter is a complement: a void produces a small but measurable decrease in local gravity that a sensitive instrument can isolate, especially when the GPR has already constrained the depth.

The engineering is also a return to first principles. The Apollo 17 Lunar Surface Gravimeter ran from December 1972 to September 1977 and yielded, among other things, the catalog of deep and shallow moonquakes that has been reanalyzed ever since. Modern seismometers are an order of magnitude more sensitive, and modern electronics can run for the multi-day acquisition window the GIMLI survey needs. Honeybee Robotics has not yet published the source design, but the options are well understood: a small explosive launcher, a drop-mass impactor, or a vibroseis-style swept-frequency shaker. Any of the three produces a repeatable signal in the tens-of-hertz band that a 4.5-billion-year-old lava tube would reflect cleanly.

The other thing the survey can do, regardless of whether the tube is there, is tell the volcanic history of the region. The walls of the Marius Hills Pit expose lava-flow stratigraphy that elsewhere on the Moon is buried under hundreds of meters of younger mare basalt. Imaging those layers, and dating the contacts between them, would let geologists read the time sequence of eruptions across one of the Moon’s most prolific volcanic provinces. Even a null result — proof that the pit is just a collapse feature with no associated tube — would be a useful constraint on lava-flow cooling models.

The CLPS lander carrying GIMLI has not been announced, and the launch is likely two to three years away. But the science is already constrained, the team is in place, and the radar-and-seismology combination has not been tried at this scale on another world. When those instruments reach the rim of a 50-meter hole in Oceanus Procellarum, the question the SELENE and GRAIL teams opened in 2017 will finally be settled. Either the Moon has a usable shelter waiting in the Marius Hills, or it does not. Either way, the next twenty years of lunar architecture just got a fact to plan around.
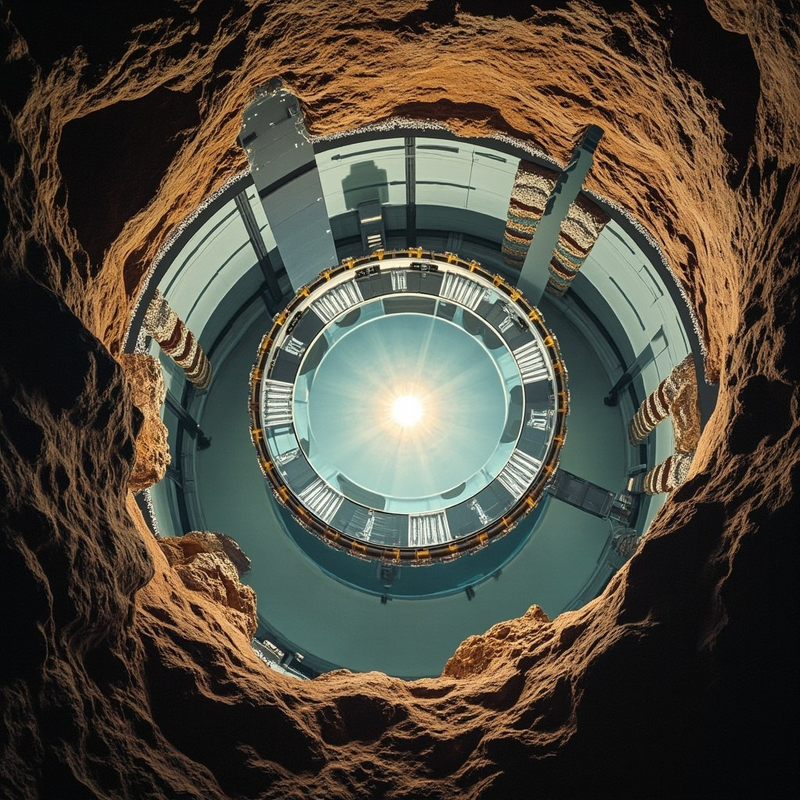


Cross-section rendering of the LUX-ZEPLIN time projection chamber: a titanium cylinder of liquid xenon watched by hundreds of photomultiplier tubes, nested inside water and gadolinium-loaded scintillator shielding, deep below the Black Hills of South Dakota. A single bright scintillation flash marks the candidate event in the central fiducial volume.


On June 16, 2023, a single light pulse appeared inside a vat of liquid xenon buried 1,480 meters below the Black Hills of South Dakota. Most flashes like it are noise: stray gamma rays, the occasional neutron, the radioactive decay of trace contaminants in the detector’s titanium walls. This one, recorded in the LUX-ZEPLIN detector at the Sanford Underground Research Facility, did not fit those explanations. By the time the collaboration finished analyzing the data and presented it at the TeV Particle Astrophysics conference in Japan on September 1, the event had become the most credible WIMP dark matter candidate any direct-detection experiment has recorded in a decade (Berkeley Lab, 1 September 2026).

That framing, for the careful reader, does the work. “Most credible” is not “discovery.” The single event sits at 2.6 sigma, where 5 sigma is the threshold physicists treat as a confirmed observation. The probability that background processes alone could produce such a flash is roughly one in two hundred, tantalizing, but not the kind of number on which you write a Nobel citation. The collaboration knows this. Rick Gaitskell, the Brown University physicist who serves as LZ’s spokesperson, called the event “something interesting” and made clear that more data is the only path to certainty (Berkeley Lab, 1 September 2026).

What makes the signal worth talking about is the experiment itself, and what it takes to eliminate every other explanation. The LZ detector holds ten tonnes of liquid xenon kept near 178 kelvin inside a titanium cryostat, nested inside an outer cryostat, surrounded by 17,000 gallons of water in a tank the size of a small swimming pool, wrapped in gadolinium-loaded liquid scintillator, and lodged beneath a mile of Homestake Mine rock (LUX-ZEPLIN Collaboration, NIM A 2020). A WIMP, if WIMPs exist, would interact with the xenon nucleus perhaps once per tonne per year. Everything else has to be ruled out, photon by photon, neutron by neutron.

The story of how dark matter became a question starts almost a century ago. In 1933, Fritz Zwicky applied the virial theorem to the Coma Cluster and concluded that the visible galaxies could not possibly account for the cluster’s rotational behavior; he called the missing mass “dunkle Materie” (Zwicky, Helvetica Physica Acta 1933). Forty years later, Vera Rubin’s spectra of the Andromeda galaxy showed stars in the outer disk moving at the same speeds as those near the center, the rotation curves that have since been measured for thousands of spiral galaxies and remain the cleanest gravitational evidence for unseen mass (Rubin & Ford, ApJ 1970). In 2006, observations of the Bullet Cluster sharpened the argument: during the collision of two galaxy clusters, the X-ray emitting gas decelerated while the gravitational lensing signal passed straight through, implying that most of the mass is in some non-luminous, non-baryonic form (Clowe et al., ApJ 2006).

If dark matter is real, it must be made of something. The leading family of candidates for forty years has been WIMPs, weakly interacting massive particles with masses in the GeV-to-TeV range, predicted independently by supersymmetry and by simple thermal-relic calculations. The relic density is Ω_chi * h² ≈ 0.1, and a coupling near the weak scale gives roughly the right answer, the so-called “WIMP miracle.” None of the direct-detection experiments built to test this prediction has produced a confirmed signal (LZ Collaboration, PRL 2023). Until June 16, 2023.

The LZ detector works because xenon has two properties that are nearly ideal for this kind of search. Its nucleus is heavy, atomic mass 131 on average across xenon’s nine stable isotopes, so a WIMP recoiling off it transfers more momentum than it would off a lighter target. When a particle scatters in liquid xenon, the interaction produces two distinct signals the experiment can read separately: a prompt flash of scintillation light called S1 and a delayed pulse of electrons liberated by the ionization, drifted upward through the liquid into a gas layer where they produce electroluminescence, called S2.

The ratio of S2 to S1 is the discriminator. Electromagnetic interactions, the gammas, betas, and Compton scatters that constitute the bulk of background, produce dense ionization tracks with relatively modest S1, yielding a low S2/S1 ratio. A nuclear recoil, the kind a WIMP would produce if it kicked a xenon nucleus, generates denser ionization per unit of scintillation and a much higher ratio. Plotting S1 against log(S2/S1) and overlaying the two populations gives two well-separated bands. Anything that lands above the electron-recoil band and inside the nuclear-recoil region is, by construction, a candidate.

To get the bands that clean, LZ has to throw out most of its own data. The xenon sits in a titanium time projection chamber about 1.5 meters in diameter and height, with seven tonnes of active liquid in the central volume and roughly 5.6 tonnes kept as the inner fiducial mass. Only events in the fiducial volume are kept; events near the walls are rejected because the dense walls themselves are the largest source of external gamma radiation (LZ Collaboration, NIM A 2020). The chamber is watched by 494 three-inch photomultiplier tubes arranged top and bottom, reconstructing event position to within millimeters. The water tank outside the cryostat is instrumented with 120 PMTs that flag any cosmic-ray muon that might have made it through the rock; the gadolinium-loaded scintillator absorbs neutrons, the most dangerous background because they produce exactly the same S2/S1 signature as a WIMP. The collaboration estimates that the detector now sees about one event per year in the search region from known backgrounds, and on June 16, 2023, it saw exactly one.

The new analysis, led by Sam Eriksen of the University of Bristol, looked at 220 live days of data collected between March 2023 and April 2024, but went further than previous LZ searches. Where earlier analyses looked for the simplest spin-independent WIMP-nucleus coupling, Eriksen’s group widened the energy window to catch interactions that deposit more energy in the detector. The single event was in that high-energy tail (Berkeley Lab, 1 September 2026).

What does the signal imply, if it is real? The collaboration’s best fit suggests a WIMP with mass at least 200 GeV/c², heavier than 200 protons, and a coupling to ordinary matter that is not the simplest spin-independent contact interaction but something more structured. The team has not yet published a cross-section limit curve; that comes when the paper appears on arXiv and is submitted to Physical Review Letters.

The next move is statistical. LZ is still running at SURF and continues to accumulate data; a second event at similar energy would push the significance up sharply, while a long absence would let the signal fade. The competition is also still running. XENONnT at Gran Sasso in Italy uses a similar liquid xenon TPC; PandaX-4T at the China Jinping Underground Laboratory uses four tonnes; both have published null results as of 2025 but are taking more data. The global direct-detection community will, over the next two years, accumulate enough xenon-years to test the same mass range LZ has begun to probe. If the June event was a WIMP, one of the others will see one too.

Two thousand and twenty-six has already been a year for hints. Dark matter remains the largest single thing we cannot name. LZ has spent four years underground doing the slow patient work of elimination. It has built a machine that produces, on average, one spurious-looking event per year. It recorded one.


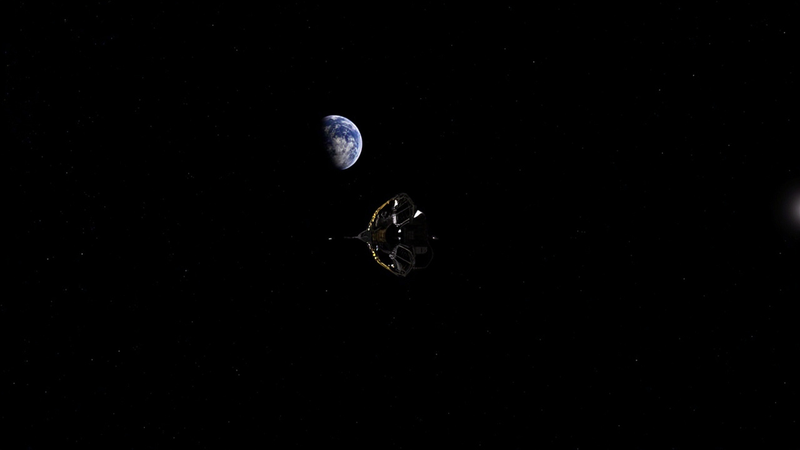
ESA's Jupiter Icy Moons Explorer JUICE, with solar arrays extended, silhouetted against the black of space as the curved limb of Earth rises behind it during the 28 September 2026 gravity-assist flyby, the Moon a faint grey dot near the planet's edge.


At 13:45 CEST on 28 September 2026, ESA’s Jupiter Icy Moons Explorer skimmed 8,640 kilometers above the Indian Ocean – close enough that an atmospheric physicist would call the altitude “edge of space.” The flyby added 3.5 kilometers per second to the spacecraft’s velocity and rotated its trajectory by twenty degrees, almost without touching its fuel tanks. Closest approach was over open ocean, well clear of populated regions, and was captured by JUICE’s two monitoring cameras at the moment the spacecraft began to climb back out of Earth’s gravity well. It is the second of three Earth (and one Venus) gravity assists the probe will use over an eight-year cruise to reach Jupiter in 2031. This time, instead of treating Earth as just a waypoint, ESA turned the encounter into a dress rehearsal for the eleven scientific instruments that will eventually map Ganymede, Europa and Callisto – the three large, icy, ocean-bearing moons that give the mission its name.

The phrase “gravity assist” hides a century of celestial mechanics. In the Newtonian picture, a spacecraft swinging past a moving planet picks up or loses kinetic energy from the planet’s own orbital motion, the way a tennis ball struck by a moving racket leaves faster than it arrived. In a pure two-body problem the gain is reversible. In the real three-body mess of spacecraft, planet and Sun, the assist can be planned to add a fixed velocity increment for a fixed angle of deflection. Each leg of the trajectory is treated as a Keplerian orbit about a single dominant body, with sudden changes at the boundary – the patched-conic approximation that has guided interplanetary navigation since the 1960s. For JUICE, the propellant budget for the cruise phase is 386 kilograms. The first gravity assist came in 2024 with a record-breaking lunar-Earth double flyby, in which the Moon bent the trajectory before Earth added energy. The second came on 31 August 2025 at Venus, where JUICE picked up 5.1 km/s at 5,088 km altitude. The third was the 28 September Earth flyby. The fourth, and final, will be a third Earth encounter in January 2029, which lines up the spacecraft for Jupiter orbit insertion in July 2031.

In the four weeks leading up to the flyby, JUICE’s flight control team at ESA’s European Space Operations Centre in Darmstadt had scheduled six possible trajectory-correction maneuvers. They used one – a tiny nudge a few days before closest approach – to align the spacecraft with the geometry needed to extract the maximum energy from the swing-by. “The flyby required ultra-precise navigation in real time,” said spacecraft operations manager Angela Dietz. “Thanks to our very careful planning, we used only a small amount of the propellant reserved for this flyby. This gives us more to use at Jupiter to carry out observations of the planet’s icy moons.” The other five maneuver windows were quietly dropped.

The flyby was also a third opportunity to test JUICE’s scientific instruments on a real, well-understood target – a privilege planetary missions rarely have. The first came in 2024 during the lunar-Earth gravity assist. The second came in 2025 when JUICE turned its cameras and spectrometers on the interstellar comet 3I/ATLAS as it tore through the inner solar system on its hyperbolic passage from beyond the Sun. Now, with Earth filling the field of view, project scientist Claire Vallat’s team prioritized ten of the eleven instruments based on their relevance to Jupiter science and on the timing of the encounter. JANUS, the German-Italian visible imager, captured color frames of the Moon and Earth at a ground sample distance better than any previous mission of this type. RIME, the radar sounder, pinged the lunar surface in test mode to validate its dielectric calibration. J-MAG, the magnetometer, and PEP, the particle environment package, spent several days in Earth’s magnetotail, collecting plasma data that will help validate the way JUICE will eventually study Ganymede’s intrinsic magnetic field – the only intrinsic magnetic field known to exist around any moon. The data started arriving at ESA’s European Space Astronomy Centre (ESAC) within hours of the encounter. While JUICE sat in the magnetotail, the European-Chinese Smile mission watched the same disturbances from the inside, measuring the auroras and field-aligned currents that connect the polar atmosphere to the distant tail. The combined dataset lets scientists correlate what happens at the polar oval with what happens sixty Earth radii downstream – a joint geophysics experiment that neither mission could have done alone.

The eleven instruments JUICE carried into the flyby represent the bulk of a payload developed under ESA leadership with hardware from across Europe, NASA, JAXA and the Israel Space Agency. JANUS, the camera system, has a 0.07 degree per pixel ground sample distance at closest approach – sharp enough to resolve features a few hundred meters across on Ganymede from orbit. GALA, the Ganymede Laser Altimeter contributed by DLR, will fire a 30-millijoule pulse at 30 hertz into the surface and time the return to centimeter accuracy; that topographic map is what scientists will use to detect the few-centimeter tidal bulge Ganymede’s ice shell should flex under Jupiter’s gravity. MAJIS, the visible and infrared imaging spectrometer, will measure how sunlight and thermal emission change across the moons’ surfaces between 0.5 and 5.5 micrometers. SWI, the sub-millimeter wave instrument, will measure temperature and composition in Jupiter’s stratosphere. UVS will trace the Jovian auroral ovals. RIME will probe tens of kilometers below the icy crust looking for the dielectric signature of a liquid-water ocean – the data needed to tell whether Europa and Ganymede host subsurface seas like the one Cassini inferred beneath Enceladus.

The mechanics of the flyby, meanwhile, are governed by the patched-conic approximation JUICE’s navigation team used to design the encounter. Earth’s gravity well at closest approach is a potential roughly 60 km/s deep at the surface, dropping to less than 0.1 km/s at 8,640 km altitude. A spacecraft entering and leaving this well with a hyperbolic excess velocity of a few km/s picks up almost no net energy – but it can change direction substantially, since the asymptote’s direction rotates by an amount that depends on the geometry of the swing-by. The twenty-degree rotation JUICE achieved is enough to take it from an out-of-ecliptic post-Venus trajectory to one in Jupiter’s orbital plane. The instrument activity had to be squeezed into the time the spacecraft spent under power, since parts of the closest approach passed through Earth’s shadow – a constraint that pushed Vallat’s team to pre-plan every exposure and every magnetometer burst months in advance.

What the next five years look like depends on how well JUICE’s instruments survive their first long bath in deep space. The first calibrated data from the Earth flyby – high-resolution images, spectra, magnetometer and plasma logs – should start arriving at ESAC within weeks and be released to the scientific community in early 2027. The January 2029 flyby will be JUICE’s last swing through the inner solar system. The final burn for Jupiter orbit insertion will come in July 2031, using the same main engine that has been unlit since 2024. By then, the engineering we celebrate this week – the careful navigation, the simultaneous run of ten instruments on a planetary scale, the single tiny burn that put the spacecraft on exactly the right approach – will be a footnote in a mission that, if it works, will give us our first sustained look at the three icy worlds where life might still exist in our own back yard.


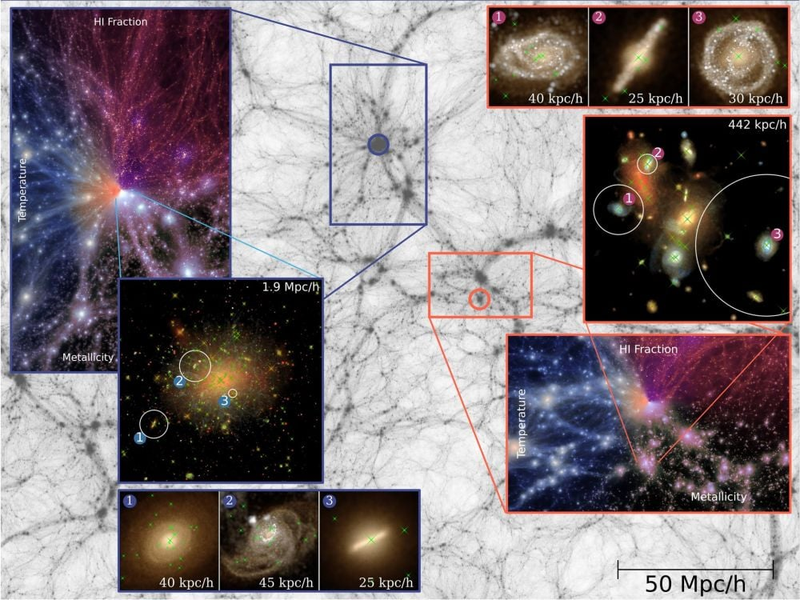
Visualization of the ASTRID simulation at z=0. The underlying image is dark matter density, with insets showing a most-massive-halo zoom, gas maps of temperature and metallicity, and a mock Hubble observation. Credit: ASTRID / Zhou et al. 2026, ApJ.


On a Texas supercomputer this summer, a 370 Mpc/h cube of dark matter, gas, and stars finished a 13.5-billion-year journey. The run began at redshift z=99, when the cosmos was a thin hydrogen-helium plasma and the first stars had not yet ignited. It ended at z=0, with galaxy clusters, supermassive black holes, and the cosmic web we see today. The team calls the simulation ASTRID, and the final z=0 dataset was published in The Astrophysical Journal in February 2026, with a public release coordinated through the Texas Advanced Computing Center on August 27, 2026 (Zhou et al., ApJ, 2026).

The headline numbers are easy to recite. ASTRID evolves 2 × 5500³ ≈ 0.33 trillion particles in a 370 Mpc/h box. Each simulation snapshot totals 30 TB. The archived state across the run is measured in petabytes. Less obvious is what those numbers actually buy the cosmologist at the other end of the keyboard: a single dataset that connects the universe’s first black hole seeds to the billion-solar-mass monsters sitting in galactic centers today.

JWST keeps pulling ancient quasars and “Little Red Dots” out of the early universe that do not fit the old growth timelines. The first JWST surveys suggested that 10⁹ M☉ black holes already existed at z > 8, hard to reconcile with seed models from a decade ago (Naidu et al., 2024, and follow-ups). To make sense of those objects, theorists need a model universe that can track baryons, gas cooling, star formation, and black hole accretion from cosmic dawn to the local universe, all at high enough resolution to capture the small dark-matter halos where the first quasars lit up.

Cosmological simulations do that, but they are expensive. Each box has to be large enough to contain rare massive clusters, dense enough to track small galaxy halos, and long enough to evolve them across 13.5 Gyr. Few projects manage all three at once. ASTRID does.

Yihao Zhou, a PhD student at Carnegie Mellon University’s McWilliams Center for Cosmology and Astrophysics, led the run. His advisor, Tiziana Di Matteo, is the principal investigator and the center’s director. The team used the NSF-funded Frontera system at the Texas Advanced Computing Center (TACC) under a 2024 Leadership Resource Allocation (TACC press, August 27 2026).

The run sits in a crowded field. MillenniumTNG’s flagship covers 740 Mpc per side, roughly eight times the volume. IllustrisTNG-300 uses a similar box size with less dark-matter resolution. Eagle is smaller but uses higher resolution per particle. MassiveBlack-II covers 533 Mpc with far fewer particles and no full hydrodynamic run to z=0. ASTRID’s pitch is that no other published run combines this particle count, this box size, and a continuous evolution to z=0 with a complete black hole sub-population (Zhou et al., 2026).

That black hole population is the part astronomers care most about. ASTRID carries massive black holes (MBHs) spanning 4 × 10⁴ to 2 × 10¹¹ M☉, the range from putative seeds to the heaviest known monsters. Earlier ASTRID snapshots have already shown up in papers on Little Red Dot analogs (Hassan et al., Open Journal of Astrophysics, 2025) and on black hole merger rates that match LISA predictions. Mock JWST and Euclid light-cones built from the simulation give observers a template to compare against real survey catalogs, which is how the team plans to constrain the seed-black-hole mass in the next round of analyses.

ASTRID is a smoothed-particle hydrodynamics (SPH) simulation, which means the gas and dark matter are discretized into Lagrangian particles that move with the flow. The code solves the Euler fluid equations coupled to a particle-mesh gravity solver. Long-range forces use a coarse mesh; short-range forces use a hierarchical Barnes-Hut octree that drops subtrees whose multipole moments fall below an opening-angle tolerance θ.

The sub-grid physics is where most of the engineering sits. Gas above a density threshold around 0.1 cm⁻³ is converted into stars using a Kennicutt-Schmidt-style surface-density law, Σ_SFR ∝ Σ_gas^n with n ≈ 1.4. Black holes are seeded in dark-matter halos above ~5 × 10¹⁰ h⁻¹ M☉ and accrete via a Bondi-Hoyle-Lyttleton prescription capped at the Eddington rate:

Mdot_BH = min( Mdot_Bondi, Mdot_Edd ) = min( 4π G² M_BH² ρ / (c_s² + v²), L_Edd / (ε c²) )

Feedback comes in two flavors. Thermal quasar-mode kicks in at high accretion (≳1% of Eddington), kinetic jet-mode at low accretion. That thermal-versus-kinetic split is what produces the bimodal color sequence between star-forming blue galaxies and quiescent red ones.

The dynamical-friction submodel is the piece most relevant to LISA. When two galaxies merge, their central black holes are flung into a wide orbit. Chandrasekhar’s formula determines how fast each black hole sinks into the merger remnant:

df/dt = -4π G² M_BH² ρ(r) ln(Λ) f(v) / v²

The Coulomb logarithm Λ runs ~3-5 for galaxy mergers. Without this term, ASTRID would smear the merger-rate signal that LISA wants to hear.

LISA’s sensitivity band runs from ~10⁻⁴ Hz to ~10⁻¹ Hz, the regime populated by MBH mergers of 10⁴ to 10⁷ M☉ across cosmic time. Di Matteo’s earlier work (Ni et al. 2022) projected ~30 MBH mergers per year detectable by LISA out to z ≈ 10. The full z=0 ASTRID data set should sharpen that number, and provide a sky-position catalog that future gravitational-wave observers can cross-match against electromagnetic transients (Zhou et al., 2026).

On the engineering side, Frontera is the largest NSF open-science cluster in the United States. Built around Intel Cascade Lake Xeon nodes with ~60 PB of Lustre storage, it absorbed ASTRID’s 30 TB snapshots without complaint (TACC user guide, August 4 2026). The team’s next target is TACC’s Horizon system, the NSF Leadership-Class Computing Facility machine deploying in two phases (GPU first, then CPU) later in 2026. The ASTRID code is currently CPU-only; Zhou and colleagues are rewriting the gravitational and black-hole feedback kernels to run on NVIDIA GPUs.

For years, astrophysicists have asked how supermassive black holes got so big, so fast. ASTRID does not answer that on its own, but it gives the community a 0.33-trillion-particle laboratory to test the answers against.

The next year or two will bring a GPU port to Horizon, plus companion runs at higher resolution or with varied cosmological parameters. By the time LISA Pathfinder’s successor launches around 2035, theorists will want catalogs like ASTRID’s to interpret the gravitational-wave sky.

What comes out of a simulation like this is rarely a single discovery. It is a reference. A way for theorists to ask whether their model matches what we should see, with enough resolution to be honest about the mismatch. ASTRID is now that reference for the next decade of SMBH and gravitational-wave cosmology.


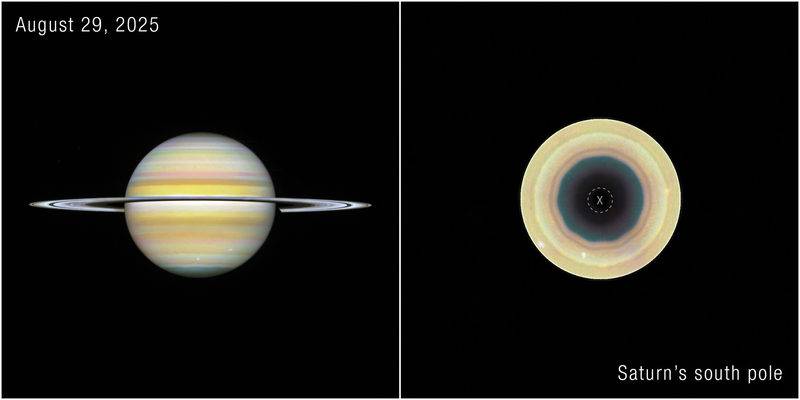
A two-panel image pairs a full view of Saturn and its rings with a polar projection of the planet's south pole, showing concentric bands of cloud around a dark centre.


For nearly forty years Saturn’s famous six-sided jet stream at the north pole stood alone. Voyager caught it first in 1981, Cassini watched it for thirteen years, and Hubble has photographed it every year since 1990 without ever finding anything like it at the other end of the planet. That asymmetry was the puzzle. On 2 September 2026, Agustín Sánchez-Lavega of the University of the Basque Country and a team of co-authors put the puzzle to rest with a paper in Science Advances: there is now a ten-sided atmospheric wave encircling Saturn’s south pole, a decagon at roughly 63°S, about 167,820 km across, that nobody saw coming because, until 2023, the south pole itself had been hidden from view by Saturn’s axial tilt (Sánchez-Lavega et al., Science Advances, 2 September 2026).

The find resets what astronomers thought they knew about how giant planets organize their weather. Saturn’s northern hexagon has been the textbook case of a polygonal jet stream since David Godfrey stitched the Voyager frames together in 1987: a wave locked into a near-stationary eastward jet at 78.5°N, with sides about 14,500 km long and winds racing clockwise at roughly 100 m/s (NASA Cassini science, hexagon page). For four decades the absence of a southern counterpart fed two competing ideas, namely that the hexagon was a fluke of the north, or that the south was simply hiding something. Cassini, which orbited Saturn from 2004 through its deliberate plunge in September 2017, never caught the south in the right geometry. The decagon’s arrival now suggests the truth is neither. The polygon family may be a normal mode of giant planet polar circulation, and we are watching a new instance of it spin up in real time. The decagon has been “growing stronger,” according to co-author Amy Simon of NASA’s Goddard Space Flight Center, who runs the Hubble Outer Planet Atmospheres Legacy (OPAL) program that produced the confirming images (NASA Science, 3 September 2026).

The discovery is a layered story about patience, amateurs, and orbital mechanics. Saturn’s 26.7° axial tilt means the south pole tilts away from the Sun and from Earth’s line of sight for roughly half a Saturn year, about 14.5 Earth years. The southern hemisphere dropped out of Earth’s view around 2012 and only crept back into favorable geometry in 2023. That is why no professional survey caught the pattern earlier. The first people to notice something were amateurs. Trevor Barry, an Australian observer, and Jean-Paul Oger, a French amateur astronomer, both contributed planetary images to the Planetary Virtual Observatory Laboratory (PVOL), a citizen-science archive run by Sánchez-Lavega’s group at the Universidad del País Vasco in Bilbao. In 2024, those ground-based images began showing an undulating band at high southern latitudes that did not fit any catalogued feature. By August 2025 the pattern had sharpened into something a non-expert could see with a small telescope, with ten straight sides, ten corners, riding inside a westward jet stream that nobody had mapped before. Hubble confirmed it. Amy Simon’s OPAL team had been photographing Saturn annually since the program began in 2014, and a backward look at the October 2023 dataset showed a faint ten-vertex polygon already in place. By August-September 2025, when OPAL returned to Saturn with sharper filters and the planet had rotated through enough viewing geometries to expose every side, the decagon was unambiguous: ten sides, each about 16,782 km long, total width 167,820 km, with brightness that varied unevenly around the circle (Space.com, 3 September 2026; Sánchez-Lavega et al., 2026).

What changed because of this: the decagon’s position drifts slightly depending on which wavelength you observe it in. That drift is the key to its physics. Hubble’s OPAL filters sample different altitudes in Saturn’s atmosphere: violet and red wavelengths probe the upper troposphere, methane-band filters probe higher stratosphere. The fact that the wave is visible across those filters, and that its apparent center shifts between them, means the decagon is not a cloud-level coincidence. It extends vertically through multiple layers, a stack of waves locked in phase from the cloud tops at roughly 200 mbar down into the deeper troposphere where ammonia ice gives Saturn its pale gold color. NASA’s James Webb Space Telescope is being lined up to take the decagon’s temperature, with the goal of pinning down how deep the pattern really goes (NASA Science, 3 September 2026).

The mechanism behind polygonal jets on giant planets is one of the more stubborn open problems in planetary fluid dynamics. Two families of explanation compete. The shallow model treats the polygon as a Rossby wave trapped in a thin weather layer, with the underlying deep atmosphere providing only a passive eastward jet that fixes the wavelength. The deep model, advanced most clearly in a 2020 PNAS study by Cabanes, Spiga, and co-authors, runs in a Saturn simulation in which deep thermal convection alone spontaneously spawns a six-sided jet at the right latitude, with the right wave number, with no tuning (Cabanes et al., PNAS, 2020). That result matters because the hexagon’s wave number is set by the planet’s rotation rate and the static stability of the deep atmosphere, following a dispersion relation that looks roughly like n ~ sqrt(Ro / Fr) where the Rossby number Ro = U / (f * L) describes the balance between inertia and Coriolis force, and Fr = U / (N * H) is the Froude number measuring stratification. A gas giant’s fast rotation (Saturn’s day is about 10 hours 33 minutes) drives f high, which suppresses higher wave numbers and lets n = 6 win out where the jet is strongest. The decagon, sitting at a less polar latitude where Coriolis forcing is weaker, would correspond to a larger n. Sánchez-Lavega’s group argues the decagon is consistent with the same deep-convection story, with the wavelength set by a different balance of stratification and rotation at 63°S. Crucially, the new feature is not as robust as the hexagon. “The decagon is situated at a less polar latitude than the hexagon in the southern hemisphere, and is perhaps not as robust, as we have seen that it has formed,” Sánchez-Lavega told reporters (ScienceAlert, 3 September 2026). That is what makes it scientifically interesting. If the decagon fades within a few years, the deep-convection model has to explain why some wave numbers persist and others do not. If it locks in and lasts, the model needs to explain why. Either answer rewrites the theory.

Saturn will continue to give up its secrets slowly. The OPAL team is already planning Hubble and Webb time over the next northern autumn and winter to see whether the decagon sharpens or softens, and whether the underlying jet stream at 63°S strengthens with it. The same machinery, ground-based amateurs feeding image archives that professionals mine with new algorithms, has now caught the first emergence of a planetary-scale weather pattern in the act. For a community that spent forty years assuming the hexagon was a singular accident, the lesson is that giant planets are too large and too well-insulated to change on human time scales, except when they do. We have a Saturn with two polygonal jet streams now. Cassini ended its mission in 2017, but the planet it studied is still doing things nobody expected.


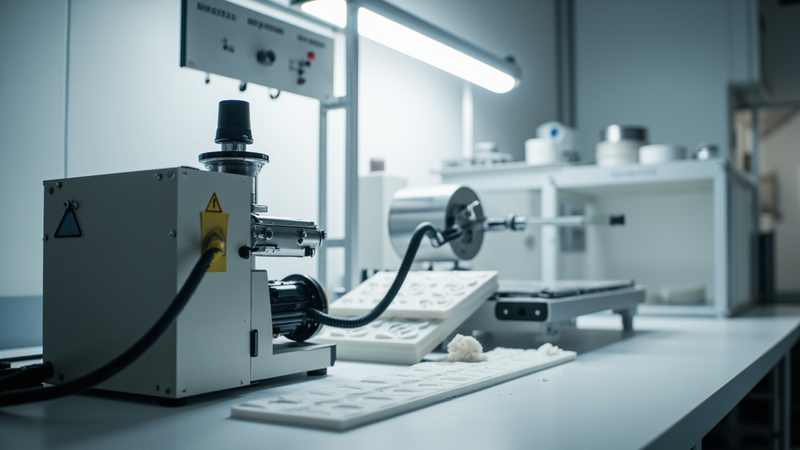
A laboratory recycling workstation: a small shredder feeds a 3D-printer filament extruder beside a heat press with PVDF foam tiles and printed parts


On the morning of August 28, 2026, in an engineering building on the campus of the University of Alabama in Tuscaloosa, fourteen teams competed in the finale of NASA’s LunaRecycle Challenge. The contestants included graduate students, hobbyists, a Wyoming aerospace LLC, an Austin 3D-printer company, and a doctoral cohort from MIT that calls itself CERBERUZ. None of them were building rockets or rovers. They were building trash compactors. The wrinkle: the trash had to be turned back into useful parts, on the Moon, in vacuum, in partial gravity, without resupply shipments from Earth.

Their brief was deceptively ordinary. Take a kilogram of dirty foam, plastic bags, Nomex flight jackets, and aluminum food wrappers — the kind of stuff astronauts throw away every day — and turn it into something a habitat can actually use. The competition carried a $3 million purse, a 1,200-team applicant pool, and a NASA program manager who announced the winners live at noon, CDT (NASA Centennial Challenges, August 28 2026).

Astronauts on the International Space Station produce roughly 2.5 kilograms of “non-metabolic” trash per crew member per day — packaging, food pouches, hygiene items, clothing offcuts, broken equipment. On the ISS, most of that ends up loaded onto a Progress cargo freighter and incinerated in the atmosphere. For a Mars mission lasting two and a half years, you can’t do that. For a permanent Artemis Base Camp on the lunar south pole, you can’t do that either, because every kilogram launched from Earth currently costs somewhere in the high five figures by the time it sits on the regolith.

The economics flip if you can keep what you bring. Recycling turns an “input” into a “stockpile.” Foam becomes a habitat tile. A torn glove becomes feedstock for a replacement bracket. The MIT team’s prototype grinds mixed waste into powder, then extrudes it into filament for a 3D printer or pellets for an injection mold. The first-place prize money — $500,000 for the prototype, $275,000 for the digital twin — is small change compared to a single Falcon Heavy launch.

Phase 1 of LunaRecycle launched in September 2024, ran through June 2025, and pulled 1,200 registrations — the largest response to any Centennial Challenge in NASA’s 20-year prize history (Wikipedia, Centennial Challenges). Seventeen teams were named Phase 1 winners from five countries and nine U.S. states. Phase 2 opened to U.S. teams only and required them to build a working prototype, optionally backed by a “digital twin” — a high-fidelity virtual model of the recycling line.

Sixteen teams cleared the Phase 2 milestone round in March 2026. They converged on Tuscaloosa from August 24 through August 28 to test their hardware at McAbee Construction, a local industry partner, with a public industry day and winners’ ceremony in H.M. Comer Hall (University of Alabama Engineering News, March 10 2026).

The first prize went to CERBERUZ, a team of undergraduate, graduate, and doctoral students at MIT. Their system — described in NASA’s award announcement as “Composites for Extraterrestrial Recycling By Engineering the Reuse and Upcycling of Zotek” — accepts mixed logistics waste, grinds it to a uniform powder, and remanufactures it into filament and injection-molded parts. The team’s insight was to stop treating the foam as contamination. Zotek F30, a closed-cell polyvinylidene fluoride foam from the British manufacturer Zotefoams, is what most aerospace interiors are made of — seat cushions, environmental control system ducting, equipment packaging. Once shredded, the foam acts as a reinforcing filler rather than a contaminant, and the resulting composite can be printed or molded into a fresh bracket or handle (NASA Centennial Challenges, August 28 2026).

The other nine teams on the prototype track ran the technology tree in different directions. Terasynth, an Orlando company, took second place with the Lunar Re-Forge System, which converts mixed waste into 3D-printing filament and recovers metals. Penn State’s RECLAIM team used microwave heating to convert plastic and metal waste into cast parts and fuel precursors — unusual because microwave heating penetrates materials volumetrically, not just at the surface. Cislune’s CRAFTER system from Rosemead, California ran pyrolysis, decomposing waste without oxygen to recover carbon, metal feedstock, and construction material. ACME Space LLC in Cheyenne, Wyoming compressed and thermally melted Zotek foam into dense tiles for lightweight structural panels (University of Alabama Engineering News, March 10 2026).

Five additional teams competed at the finale without milestone prizes, including Phoenix Loom (recycling cotton textiles), KLAW Industries (regolith-composite reinforcement), and Space Copy (foam-regolith extrusion).

The MIT team’s choice of PVDF is not incidental. PVDF is a semicrystalline fluoropolymer with a melting point of 177 °C and a density of 1.78 g/cm³ — higher than most commodity plastics, but inert to most solvents, acids, and hydrocarbons (Wikipedia, Polyvinylidene fluoride). In a vacuum-rated environment, the polymer also outgasses less than polyethylene or polyurethane, which matters when every gram of off-gassing condenses on a nearby optical surface. The Zotek F30 variant is a nitrogen-expanded closed-cell foam with densities from 30 to 150 kg/m³, thermally stable to 160 °C, and certified to the OSU heat-release and smoke-density standards required for commercial aircraft interiors (Zotefoams technical data sheet, 2024).

The grinding-and-reinforcement trick relies on a simple rule of composites. A short-fiber or particulate filler, well-dispersed, raises the modulus of a polymer matrix. The foam’s cells collapse into platelet-like fragments under the grinder, and the resulting powder behaves mechanically like a high-aspect-ratio reinforcement when re-melted with a virgin or reclaimed polymer carrier. The team’s digital twin — for which they also took first place — modeled throughput, energy use, and final-part mechanical properties under simulated lunar gravity (1.62 m/s², roughly one-sixth of Earth).

The microwave-based RECLAIM approach uses different physics. Microwaves at 2.45 GHz couple to polar molecules and lossy dielectrics; metal-bearing waste heats volumetrically, while pure plastics heat more weakly. That lets a single chamber process mixed trash without pre-sorting. Pyrolysis sidesteps oxygen entirely: at 400-700 °C under inert gas, polymers break into volatile tars, non-condensable gases, and a solid char. The char fraction typically retains 30-50% of the input carbon mass as a usable feedstock, while the gas fraction can be reformed into methane or hydrogen for fuel cells.

The throughput numbers matter as much as the chemistry. NASA’s challenge brief required finalist systems to demonstrate meaningful mass efficiency — converting a useful fraction of input waste into finished parts without prohibitive energy or astronaut time. The Highest Mass Efficiency award went to Cislune’s CRAFTER; the Most Trash Types Recycled award went to Bob Jones University’s LunaBrix, which combines recycled content with regolith simulant into stackable bricks. The Most Innovative prize went to RECLAIM for the microwave reactor. The People’s Choice went to Terasynth for the autonomous Lunar Re-Forge System (NASA Centennial Challenges, August 28 2026).

LunaRecycle is what NASA’s Centennial Challenges are designed for: a narrow, well-scoped problem with measurable success criteria, open to anyone with the engineering chops. It also happens to be one of the cheapest ways to test a piece of the Artemis program — $3 million, mostly going to small teams with no government contract overhead.

Two things will tell us whether this work matters. First, whether NASA pulls any of the prototypes into a flight experiment on a Commercial Lunar Payload Services lander or a Gateway resupply manifest. Second, whether the same chemistry shows up in the closed-loop life-support trade studies for Mars.

The deeper question is whether a Moon base can be a base at all if it cannot reuse what it already has. The fourteen teams in Tuscaloosa just spent a week making the engineering answer sound like yes.