


A fresh look at Mercury’s wrinkled face suggests the innermost planet is a tighter squeeze than anyone had measured. A team led by Gaku Nishiyama at the German Aerospace Center (DLR) reports on 10 September 2026 in Geophysical Research Letters that Mercury’s radius has shrunk by somewhere between 6.9 and 11.6 kilometres (about 4.3 to 7.2 miles) since the planet finished forming, up to 30% more shrinkage than the previous best estimate. The new number does not mean Mercury suddenly started cooling faster. It means the team has been able to count landforms that earlier surveys could not see, in places that earlier surveys did not look. (Phys.org, Space.com)
The cooling and contraction of a rocky planet are not abstract. They leave a written record on the surface. As the hot interior of a world like Mercury gives up heat to space, its iron core and silicate mantle both contract, and the cold brittle outer shell has to buckle and shorten to keep covering the smaller interior. On Mercury that shortening shows up as long curving cliffs called lobate scarps and as the smaller, bunched-up wrinkles that run across the volcanic plains. Each of those structures corresponds to a known amount of horizontal shortening, and the cumulative shortening of all of them tells you how much the planet’s radius has changed.
The problem is that some of those wrinkle ridges are buried under rubble. Mercury is the most heavily cratered surface in the Solar System besides the Moon, and each impact spreads a blanket of broken rock over a wide area. Where the surface is rough, the short scarps get masked by impact debris and are no longer visible from orbit. Earlier global surveys counted only the ridges they could see in smooth volcanic plains and used that visible population to estimate the global total. Nishiyama’s team did something different: they overlaid Mercury’s contraction-related fault map with a high-resolution surface roughness map, found that the roughest patches are systematically missing the scarps the smoother patches have, and used that correlation to estimate how much contraction the rough terrain is hiding.
The corrected total is 4.3 to 7.2 km of radial contraction, depending on how the unmapped regions are extrapolated. The upper end is about 30% larger than the previous widely cited figure, and the lower end is broadly consistent with the older estimate. Either way, the planet’s interior has gone through more total cooling than the existing record implied. That matters for what scientists think is going on inside Mercury today. A planet that has lost more heat over its lifetime is consistent with an iron core that has fewer light elements mixed into it, or with a higher starting temperature, or both. Lead author Nishiyama, in statements accompanying the paper release published via the American Geophysical Union’s media release, lays the implications out plainly: “More shrinking means Mercury could have a larger metal core, less light elements like silicon mixed into the metal core, or a higher starting temperature.” (Time)
The story behind the paper is at least as interesting as the headline number, because the data set the team used is mostly the same one that supported the earlier, smaller contraction estimate. NASA’s MESSENGER spacecraft orbited Mercury from 2011 until it ran out of fuel in 2015, and its Mercury Dual Imaging System returned the global monochrome and colour mosaics that almost every modern Mercury paper still leans on. The MESSENGER Laser Altimeter (MLA) produced a topographic map of the northern hemisphere but could not see all the way to the south. The team behind the new paper combined MESSENGER imagery with a recent roughness map derived from those same images, cross-checked with the older Byrne et al. 2014 estimate from Carnegie Institution and Smithsonian, and identified which kinds of terrain were systematically underrepresented in the historical contraction count.
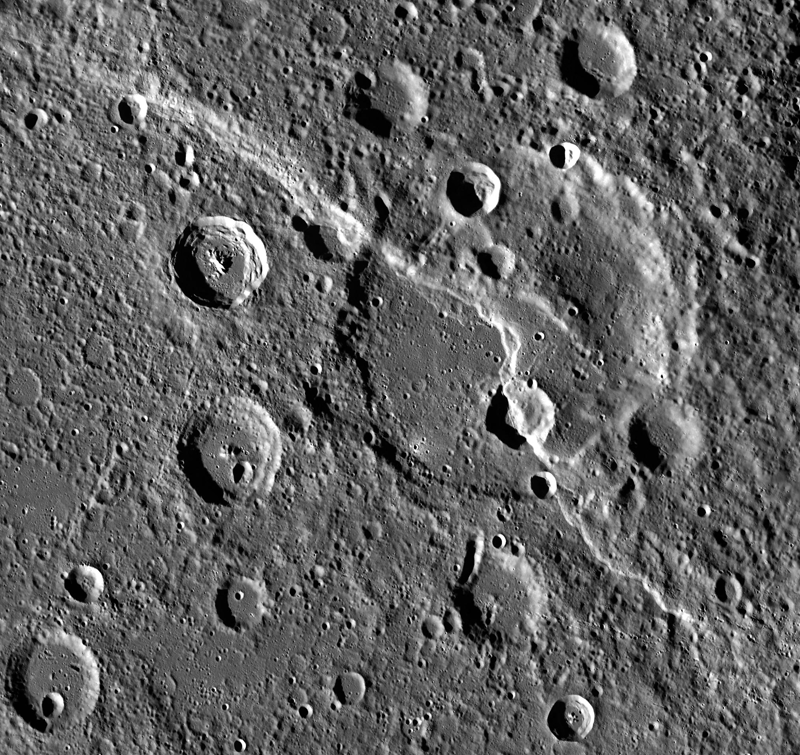
The surface structures this work is about are dramatic at human scale even if they are subtle in orbit. The Wikipedia entry for Carnegie Rupes, a textbook lobate scarp in Mercury’s northern volcanic plains, describes an escarpment about 267 kilometres long with several kilometres of vertical relief. The image NASA’s MESSENGER spacecraft captured of that scarp cutting through the small crater Duccio (PIA19279, public domain, NASA / Johns Hopkins Applied Physics Laboratory / Carnegie Institution) is reproduced below. The curving bright ridge in the middle of the frame is the scarp itself. Each kilometre of vertical throw on a scarp like that one corresponds to a known amount of horizontal shortening, and the cumulative throw across thousands of such features is what gets converted, at the end, into a single radius change for the whole planet.
The instrument that will close the question is now on its way. ESA’s BepiColombo mission, launched in October 2018 and scheduled to enter orbit around Mercury in late 2026, dropped its cruising platform on 3 September 2026 after a flyby and is closing in for orbit insertion in November. It carries the BepiColombo Laser Altimeter (BELA), a German-Swiss instrument led by the same DLR group that authored the contraction paper. BELA is designed to map Mercury’s topography from the equator to the south pole at roughly ten times the vertical resolution of MESSENGER’s MLA, and Nishiyama is a member of the BepiColombo science team. He has been explicit about what the new data will buy. “Future data from laser altimetry on BepiColombo will collect more information on planetary contraction by measuring topography more precisely,” he said in the paper’s release materials, and the broader BepiColombo topographic record will let the team test whether the corrected 6.9 to 11.6 km figure is the final answer or itself an underestimate. (Phys.org)
The deeper question, beyond Mercury’s own radius, is what kind of planet Mercury is. It is the smallest planet in the Solar System by radius, the second-densest after Earth, and the only one with a fully liquid iron core that generates an active magnetic field. Its high density combined with its low mass implies an oversized metal core, and the surface contraction is one of the cleanest windows into how that core has been cooling for the past 4.5 billion years. A planet that has lost more heat than its visible faults suggest is a planet whose interior has been more efficient at giving up its primordial warmth. For models of planetary dynamos, of core composition, and of the thermal history of rocky worlds in general, that 30% revision is a meaningful step.
The lesson is also methodological. Planetary geologists working on Mars, the Moon, and the icy satellites of the outer planets face the same problem of counting only the faults that happen to be visible on the surface. Mercury’s case, where the obscuring layer is impact debris rather than vegetation or ice, is unusually clean. The team’s correlation between contraction feature density and surface roughness gives them, and anyone who follows them on other worlds, a concrete way to estimate how much of a planet’s tectonic record is hidden in plain sight. That kind of correction does not invalidate the earlier surveys; it shows that those surveys were working from the right kind of data and the right kind of reasoning, but with incomplete coverage.
By the end of November 2026, BELA will start returning the topographic map that turns Nishiyama’s 6.9 to 11.6 km range into a single number with much smaller error bars. If the BepiColombo topographic record confirms the upper end of the contraction range, the standard thermal-history models for Mercury will need to be revised in much the same way the contraction estimate itself just was. If it confirms the lower end, the new paper becomes a careful quantification of how much a single observational bias was understating a real measurement. Either way, the figure that planetary scientists will quote for Mercury’s shrinkage from now on is not the number they were quoting last week.
 Subscribe to our RSS feed









There are no comments.
Add A Comment