OrbitalHub

Where curiosity reaches escape velocity.

Domain is for sale. $50,000,000.00 USD. Direct any inquiries to contact@orbitalhub.com.


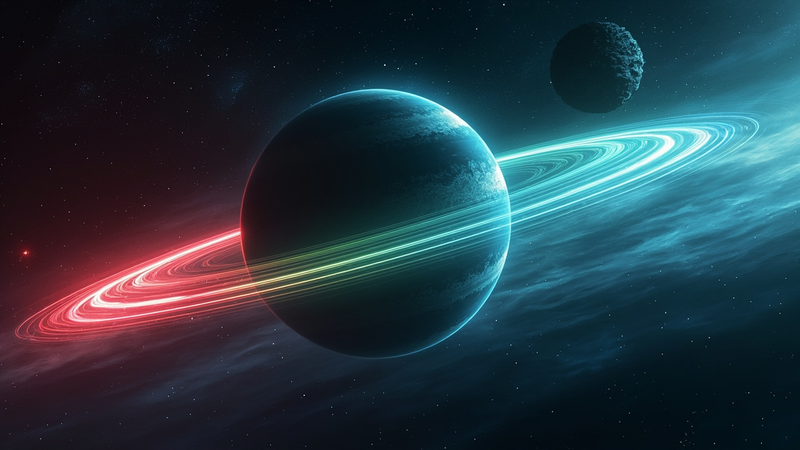
An artist's impression of a giant exoplanet emitting an auroral ring around its magnetic pole, with radio waves streaming from the poles into space


For three decades, “habitable zone” was the label that mattered most when astronomers tried to pick out Earth-like worlds. A planet at the right distance from its star, where water could stay liquid, made the shortlist. Now there is a second gate, and the radio sky is starting to open it.

In the second half of September 2026, two pieces of work landed within a week of each other. The first, by Kevin N. Ortiz Ceballos and colleagues at the Center for Astrophysics | Harvard and Smithsonian, used South Africa’s MeerKAT array to record auroral radio emission from Beta Pictoris b and, by fitting that emission, measured the planet’s magnetic field at no less than 1,250 gauss where the radio waves were produced, more than a hundred times the field strength near Jupiter. The second, a chapter in the SKA Observatory’s 2026 science book Advancing Astrophysics with the SKA II (AASKAII), lays out how the larger Square Kilometre Array will turn that lone detection into a population survey running across the radio sky (Kavanagh et al., arXiv:2607.11507, July 13 2026).

The Ortiz Ceballos paper, posted to arXiv on September 19, 2026, reports “the first direct detection of auroral radio emission from an exoplanet” (arXiv:2609.16720). The Kavanagh chapter anticipates “thousands of detections of [ultracool] dwarfs within a few hundred parsecs”. Read together, they mark the moment exoplanet magnetism stops being a curiosity of one star system and starts to look like a measurable physical quantity across the Milky Way.

Why this matters takes a paragraph to lay out and a century of physics to back up. A magnetic field around a rocky planet is a shield: it deflects the stellar wind, it keeps the upper atmosphere from being sandblasted into space, it channels incoming charged particles into auroral rings rather than letting them rain onto the surface. The stripped atmosphere of Mars, the thin envelope around present-day Venus, and the divergent atmospheric histories of Earth and Venus over four billion years trace in significant part to whether the planets kept dynamos. Exoplanet climate models that include magnetic fields produce a more Earth-like picture for many candidate worlds; models that ignore magnetic fields systematically over-predict atmospheric retention. For three decades the field had to be inferred from atmospheric escape rates or from star-planet interaction signatures baked into transit spectra. Both methods were indirect.

What changed in September 2026 was that MeerKAT picked up repeating low-frequency bursts from the Beta Pictoris system and the team could place the source unambiguously on the planet, not the star. The trick was a calibration borrowed from very long baseline interferometry: pin the array’s coordinate frame to background quasars so distant they barely move on human timescales, then re-grid every radio image against that fixed sky. When the team overlaid their burst positions on the quasar-locked grid, the radio centroid sat precisely on the orbital position of Beta Pictoris b at the time of the observation rather than on its parent star (Ortiz Ceballos et al., 2026). Past exoplanet radio claims had been ambiguous because the array’s beam was wider than the planet-star separation; MeerKAT’s combination of baseline length, up to 8 km in the Karoo array, and the quasar-locked astrometry pushed that ambiguity below the planet’s projected offset.

The MeerKAT emission corresponds to an electron cyclotron maser instability operating in the planet’s magnetosphere. Energetic electrons trapped along open magnetic field lines near the planet’s magnetic poles radiate coherently at harmonics of the local electron-cyclotron frequency f_ce = (e*B) / (2*pi*m_e). The useful relation between frequency and field strength is f_ce (MHz) ~ 2.80 * B (gauss). Plugging in the 1,250 gauss figure gives a peak cyclotron frequency near 3.5 GHz, which matches where the team reports the most luminous bursts. The mechanism is the same one that lets Jupiter’s decametric emission light up ham radio receivers every few decades when Earth passes through Io’s plasma torus, and that lets the giant planets of our solar system outshine their host stars in the low-frequency sky. Beta Pictoris b’s 1,250 gauss is roughly 100 times Jupiter’s 4 to 13 gauss surface field. The authors note that figure matches theoretical predictions for young, massive giant planets whose dynamos are driven by efficient heat transport through a still-cooling interior rather than core convection alone.

If you stopped reading here, the story would already be a first. The AASKAII chapter by Robert D. Kavanagh and sixteen coauthors sketches what comes next. The chapter’s premise is that the SKA, when it reaches full operation, will deliver both an order of magnitude more sensitivity at low frequencies through SKA-Low in Western Australia (50 to 350 MHz) and astrometric precision in the microarcsecond regime at higher frequencies through SKA-Mid in the Karoo (0.35 to 15.4 GHz, baselines extending to 150 km in Phase 1). That combination does two new things at once. It opens up giant exoplanets whose magnetic field strengths put their cyclotron emission in the tens-of-megahertz range that is now too faint for any current array to detect. And it allows the team to monitor the radio centroids of ultracool dwarfs, substellar objects spanning the mass range from Jupiter to brown dwarfs that have been known to emit coherent auroral radio for two decades, over multi-year baselines to detect the wobble induced by a planet of a few Earth masses. Astrometric monitoring turns a planet’s magnetic field into a planetary-mass measurement at the same time; the same observation that confirms a magnetic field also weighs the planet, including any unseen companions whose slight gravitational pull makes the host wander.

What changes across the next twenty years is the kind of work that becomes routine. Detection on a single target will give way to a sample size in the thousands; the Kavanagh chapter suggests SKA-Mid’s first decade of ultracool-dwarf monitoring could yield enough astrometric wobble detections to populate a mass-versus-magnetic-field diagram comparable in coverage to the radial-velocity planet catalogues of the 2010s. Statistical statements about magnetic field strength against planetary mass, stellar activity, and orbital distance will replace single-source case studies. The chapter does not promise that an Earth-mass rocky planet’s magnetic field will be measurable before 2040, because those fields project emission at kilohertz frequencies the ionosphere absorbs. It does argue that the SKA’s first decade of operation will make magnetic field a primary observable for the gas giants and ice giants that are the plausible hosts for life in our galactic neighbourhood. By the time biologists get serious about looking for biosignatures on rocky planets, the SKA programme will have spent a generation taking the magnetic-field census that makes those biosignatures physically credible. A radio antenna in the Karoo just gave that census its first datapoint.
 

September 27, 2026

Where Mars got its moons

Posted by


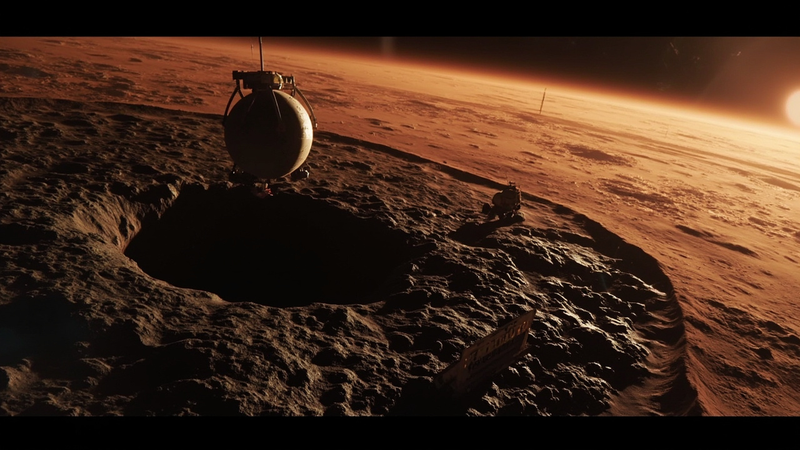
MMX at Phobos


Mariner 9 arrived at Mars on November 14, 1971, the first spacecraft ever to orbit another planet. A planet-girdling dust storm forced the mission to wait, and a planetary scientist named Joseph Veverka suggested putting the cameras on Phobos and Deimos in the meantime. Phobos came into focus on November 29 from 14,440 km, then again on December 1 from 5,720 km. The little 27-kilometer rock was already strange: a near-potato shape scarred by a 9-kilometer crater called Stickney, a long axis pointed permanently at Mars, and a charcoal-black surface that did not match the warm reddish dust it was orbiting (NASA/JPL, 1971–1972).

Two hypotheses have run in parallel since Asaph Hall discovered both moons in August 1877. The capture hypothesis says Phobos and Deimos are asteroids from the outer belt, drawn in by aerodynamic drag through an extended early-Martian atmosphere and circularized into their present orbits (Hunten 1979; Pollack et al. 1979). The color match between Phobos’s surface and the so-called D-type asteroids, dark, organic-rich bodies, has carried that story.

The giant-impact hypothesis argues the moons formed from debris thrown up when a roughly Mars-sized protoplanet slammed into early Mars, much as our own Moon is thought to have formed from a glancing blow on Earth (Craddock 2011; Rosenblatt & Charnoz 2012). If true, Phobos is made from re-accreted Martian mantle mixed with impact glass, with up to ~30% porosity to explain the low density.

The distinction isn’t trivia. If Phobos is a captured D-type, MMX returns a bona fide sample of outer-belt material with all the volatile- and organic-rich implications that follow. If Phobos is impact debris, MMX effectively becomes the first Mars sample return mission, a piece of the early Martian mantle frozen in place because there was never enough gravity to melt it (Burns 1992; Lainey & Jacobson 2017).

The first attempts were Soviet. Phobos 1 launched in July 1988 and died 51 days later of a software bug. Phobos 2 reached Mars in January 1989, swung past Phobos, and went silent 30 m above the surface during its second landing rehearsal, returning 37 images. Phobos-Grunt launched in November 2011 on a Zenit-2, failed to leave Earth orbit, and burned up over the Pacific Ocean, taking its piggybacked Chinese Yinghuo-1 smallsat with it.

Between those failures, orbiters gave us what we had. ESA’s Mars Express has now completed more than 130 dedicated Phobos flybys; Mars Reconnaissance Orbiter (HiRISE) returned the highest-resolution images of the surface, down to ~6 m/px; Perseverance and Curiosity imaged Phobos eclipsing the Sun from the ground. None was a sample return.

JAXA committed. MMX was approved in 2019 with Kawakatsu Yasuhiro as Project Manager, deliberately built on Hayabusa and Hayabusa2 heritage. It launches in JFY 2026 on H3 from Tanegashima. It carries a Coring Sampler, a NASA-built pneumatic sampler, and the DLR–CNES IDEFIX rover, which is to be released from below 100 m altitude and operate for ~3 months. After regolith capture, MMX lifts off Phobos, swings out of orbit, and heads home. The sample capsule lands in Australia’s Woomera desert in JFY 2031 (JAXA, 2026).

Phobos’s specifics dictate the engineering. It is tidally locked to Mars and orbits at 9,376 km from the planet’s center, inside synchronous. Its mass is only 1.064 × 10¹⁶ kg. Surface gravity is 0.0057 m/s² and escape velocity a casual 11.4 m/s. Dust kicked up by landing takes a long time to settle because there is essentially no atmosphere to grab it (Wikipedia, citing Jacobson 2010; Lainey et al. 2024).

The body itself is also a study in low-cohesion regolith. Stickney, the dominant crater, is nearly half the mean diameter of the moon — close to the threshold where a same-sized impactor should shatter the parent rather than scar it. The long, shallow grooves running away from Stickney’s rim are still debated: some teams interpret them as fractures propagating from the basin-forming impact (Asphaug & Melosh 1993), while others argue for ejecta-drape patterns or secondary craters from Mars-thrown debris (Murray & Heggie 2007). Mars Express and MRO photometry has refined the question but not closed it; the grooves sit at the wrong angle to simple Stickney-radial fracture models, leaving loose ends that ground truth will resolve.

Sampling strategy reflects the same facts. The primary sampler is a Coring Sampler (C-Sampler): a titanium-alloy tube pressed against the surface under low main-engine thrust, intended to pull up to a 2-cm core from the uppermost regolith. Secondary is the Pneumatic Sampler (P-Sampler), contributed by NASA: a short burst of nitrogen gas lifts loose regolith into a chamber. Multiple sites will be visited across lit and shadowed hemispheres, with a combined sample target of more than 10 g (JAXA, 2026 mission specification).

In-situ discrimination happens before the sample ever leaves Mars. NASA’s MEGANE instrument (Mars-moon Exploration with GAmma Rays and NEutrons) is a high-purity germanium γ-ray spectrometer paired with a ³He-neutron spectrometer, designed to map iron, silicon, oxygen, hydrogen, thorium, and potassium across Phobos’s surface (NASA / APL, 2024). D-type asteroidal material and basaltic Martian-mantle-derived material produce very different signatures in such an instrument, particularly in the Fe/H and Th/K ratios. Knowing the answer in orbit lowers the risk of returning rock that doesn’t actually answer the central question.

Return physics is unforgiving. The Δv budget to enter Martian orbit from a direct Hohmann transfer is on the order of 1 km/s, plus a few hundred m/s for Phobos orbit acquisition and the touch-and-go capture. Per Tsiolkovsky’s rocket equation: Δv = v_e × ln(m_0 / m_f), with v_e ~ 320 s for the bipropellant thrusters. The mass fraction is what makes the Sample Return Capsule, with its ~10 g payload, only a small fraction of the ~4,200-kg launch stack. The capsule’s heat shield has to survive entry into Earth’s atmosphere at ~12 km/s after a direct Mars return.

H3 is Japan’s first fresh-built orbital launcher since the 1980s. Its LE-9 engines run an expander bleed cycle, each chamber delivering ~1,422 kN of vacuum thrust. H3 sent up Michibiki 7 earlier this month, and MMX is the next major LE-9 passenger on the manifest (JAXA / MHI, 2026).

JAXA’s MMX is going to do something the United States and Russia combined have tried and failed to do three times: land briefly on Phobos, grab a few grams of regolith, and bring that bag of rock back to a clean lab on Earth.

Three outcomes are plausible. If the rocks look like D-type carbonaceous material with deep hydration features, the capture hypothesis wins and Phobos becomes the first outer-belt material ever returned to Earth. If they are dry, fine-grained basalts with high calcium and iron and no hydration, the impact hypothesis wins and we have, in effect, a sample of early Mars. If they are a messy mix, we’ll learn something about Phobos’s regolith history that neither hypothesis prepared us for.

The capsule should come down near Woomera in JFY 2031. JAXA’s Sample Curation Facility at Sagamihara will be where scientists first crack open the sealed container. The instruments they run on that small sample — mass spectrometers, electron microprobes, atom-probe tomographs — will quietly close out a 150-year-old argument about where Mars got its moons.


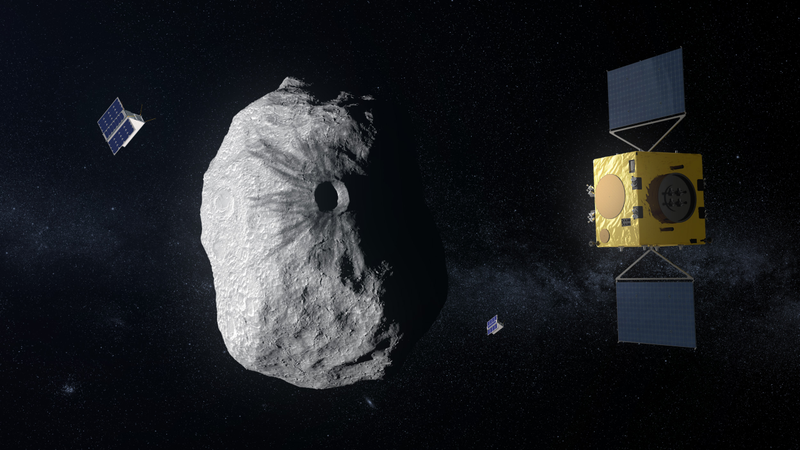
A gold-foiled spacecraft with solar wings holds station beside a large grey asteroid marked by a central crater, with two small cubesats nearby.


On 17 March 2026, somewhere past the orbit of Mars, a European spacecraft fired its hydrazine thrusters for the second time since launch. The burn lasted long enough to dump 123 kilograms of propellant and shift the probe’s heliocentric velocity by 367 metres per second, the equivalent of accelerating from a standstill to just above the speed of sound (ESA, Hera mission update, 17 March 2026). Two months later, in Thessaloniki, the entire Hera science team gathered for what the project’s own newsletter called “the last time before the probe finally arrives on site” (heramission.space, 17 May 2026). That arrival is now eleven weeks out.

ESA’s Hera, launched 7 October 2024 from Cape Canaveral on a Falcon 9, is closing on the binary asteroid 65803 Didymos. It will reach the system in early November 2026, almost exactly four years after NASA’s Double Asteroid Redirection Test slammed into Dimorphos, the smaller of the two bodies, and changed its orbit by 33 minutes (NASA/APL, 26 September 2022). What Hera will do once it gets there is, in a phrase the mission team keeps using, turn a grand-scale experiment into a repeatable planetary-defence technique. That phrase is doing a lot of work. It is the entire reason a 1,214-kilogram spacecraft is at this moment drifting toward two rocks that, until 2022, almost no one outside planetary science had heard of.

Dimorphos is small. Before DART, its diameter was estimated at roughly 160 metres, the height of a 50-storey building, and its mass was known only to within a factor of two. That uncertainty is the central problem Hera was built to solve. The first measurement of how much momentum DART delivered to the moonlet, the so-called momentum enhancement factor beta, was published by Rivkin and colleagues in 2023. They reported beta = 3.61 with a 1-sigma uncertainty of about 0.2, anchored to an assumed Dimorphos bulk density of 2,400 kilograms per cubic metre (Rivkin et al., Nature 2023). A weaker, more porous asteroid gives a higher beta. A denser, more cohesive one gives a lower beta. Without measuring Dimorphos’s actual mass, every planetary-defence scenario that uses the DART result inherits that uncertainty.

That matters because planetary defence is no longer hypothetical. The 2024 PDC25 exercise at Johns Hopkins Applied Physics Laboratory used beta = 3.61 as its baseline. The number is now embedded in the operating procedures of NASA’s Planetary Defense Coordination Office. A 0.2-point error in beta, applied to a 200-metre asteroid on a 10-year warning, translates into roughly a thousand kilometres of miss distance. That is the difference between a near miss and an ocean impact.

There is a quieter reason to care. Hera is going to make the first internal radar scan ever performed on an asteroid. The instrument is called JuRa, and it sits on a CubeSat the size of a shoebox.

NASA’s DART was the kinetic-impact end of an experiment called AIDA, the Asteroid Impact and Deflection Assessment. ESA’s Hera was always supposed to be the diagnostic half. The architecture is not unusual in physics: you hit something, then you measure what happened. In this case, the impactor flew in 2022. The diagnostician is arriving on time.

Dimorphos is in a 12-hour orbit around Didymos, a roughly 780-metre primary. Both are near-Earth asteroids in the rubble-pile class. DART hit Dimorphos head-on at about 6.6 kilometres per second and shortened its orbital period by 33 minutes, far more than the 7-minute change the spacecraft alone would have produced. The extra came from ejecta, the plume that flew off the surface in the opposite direction and acted as a natural afterburner.

Hera will do the part ground telescopes could not. It will map Dimorphos’s shape from hyperbolic arcs at 20 to 30 kilometres, then closer, down to 1 to 2 kilometres during the experimental phase in April and May 2027 (ESA Hera operations plan, 2026). Two CubeSats will be deployed starting 13 January 2027. Juventas carries JuRa, a 50 to 70 megahertz radar that will sound the asteroid’s interior to a depth of roughly 100 metres with 10 to 15 metres of vertical resolution. Milani carries ASPECT, a hyperspectral imager covering 0.5 to 2.5 micrometres, and VISTA, a dust sensor. Juventas will attempt a soft landing on Dimorphos in late January 2027, the first controlled touchdown on a body this small.

The 367 m/s maneuver tells you what the mission was actually doing during cruise. The full delta-v budget from launch through arrival is on the order of 1.4 kilometres per second, and Hera carries roughly 600 kilograms of hydrazine for chemical propulsion. That is a small budget by interplanetary standards, smaller than OSIRIS-REx’s, smaller than Hayabusa2’s. The reason it works is the Mars gravity assist of 12 March 2025, which bent the trajectory and added, for free, several hundred metres per second. Without that flyby, Hera would not have arrived.

What the chemical system has to do is trim. Each burn is small. The cumulative effect, over five maneuvers across two years, is to align the spacecraft with Didymos’s slow drift around the Sun so that, in late October 2026, the probe can begin hyperbolic approach arcs instead of flying past.

The autonomy stack is the harder problem. At 20 kilometres, Didymos subtends roughly the same angle as a person standing 100 metres away. At 4 kilometres, Dimorphos, at 160 metres across, occupies about 2.3 degrees of sky. Both bodies move visibly against the star background during a single exposure. The Asteroid Framing Camera, two redundant 1020-by-1020 CMOS sensors built by Jena-Optronik, has to track Didymos in one field of view while Dimorphos arcs through the same frame. At 1 kilometre altitude, AFC delivers roughly 10 centimetres per pixel. That is enough to resolve the rim of the DART crater and build a digital terrain model accurate to about half a metre (Jena-Optronik AFC documentation, 2024).

JuRa is the more exotic instrument. Low-frequency radar in deep space is rare because the antenna that works at 50 to 70 megahertz is, by radio-physics standards, large: on Juventas, the antennas deploy to about 1.5 metres tip-to-tip. The bandwidth is wide enough to see the boundary between regolith and a more competent interior, if such a boundary exists. Dimorphos is thought to be a rubble pile, a gravitationally bound aggregate of fragments from centimetres to tens of metres, with bulk porosity between 30 and 50 percent. Until now, no one has measured which kind of object DART actually hit.

The momentum transfer itself is described by an equation that hides a great deal of physics. The change in Dimorphos’s orbital velocity is

Δv = (m_s × v_s + m_e × v_e) / (m_s + m_e + m_t)

For DART, m_s was about 580 kilograms, v_s about 6.6 kilometres per second, giving a momentum of about 3.8 megagram-metres per second. The orbital change was 2.7 millimetres per second, implying an effective momentum delivery roughly 3.6 times larger than the spacecraft alone would have produced. That factor, beta, is what Hera will nail down by weighing Dimorphos.

Hera will not prevent an asteroid impact. That is not the job. The job is to convert the most famous kinetic impact experiment in history from a single dramatic event into a calibrated engineering method. By mid-2027, planetary-defence planners will know, to within a few percent, how much velocity change a given kinetic impactor delivers to a rubble-pile asteroid of a given size and porosity, from direct measurement rather than extrapolation.

The November 2026 arrival is the moment the field stops being theoretical.


September 26, 2026

Four tons of rocket at 2.4 km/s

Posted by


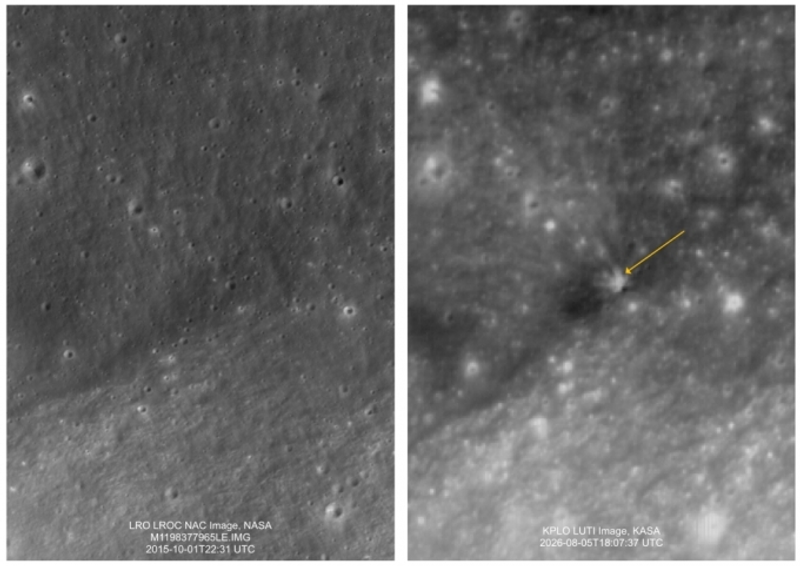
Before-and-after comparison of the Falcon 9 upper stage impact site near Einstein crater, imaged by LRO in October 2015 (left) and Danuri's LUTI camera on August 6, 2026 (right). Credit: NASA, KASA, KARI.


At 06:34 UTC on August 5, 2026, a hollow aluminum cylinder weighing roughly 3,900 kilograms crossed the last few hundred kilometers between Earth and the Moon at 2.43 km/s and stopped existing. The spent second stage of a SpaceX Falcon 9, cataloged as 2025-010D, slammed into the lunar surface near Einstein crater on the western limb and excavated a crater somewhere between 17 and 30 meters across. Almost no one on Earth saw it. The flash lasted less than a second, the impact site was on the sunlit side of the Moon during morning twilight for European and American observers, and the Sun-corona glare swamped any amateur telescope hoping to catch a thermal signature.

Eleven days later, the picture is clearer. South Korea’s Danuri orbiter published the first before-and-after images of the crater. Astronomers at Boston University working with the European Southern Observatory’s Very Large Telescope in Chile pulled a sodium and lithium line out of the ejecta plume. NASA’s Lunar Reconnaissance Orbiter is planning a follow-up pass that should image the fresh crater at half-meter resolution. For the first time in lunar science, the community has a controlled, predicted, multi-instrument observation of an artificial impact on the Moon.

The Chang’e 5-T1 third stage hit the Moon in March 2022 and the community was surprised by the double crater it left, because the shape implied more mass at the front of the rocket than the published payload would account for. The Falcon 9 stage is the second confirmed unintentional lunar impact, and the first that was on the near side, on the sunlit side, and watched in advance. About 100 lunar missions are planned over the coming decade, and each one leaves a spent upper stage in cislunar space unless the operator deliberately disposes it. SpaceX’s pre-impact statement was honest: on a translunar injection, almost all the propellant goes to the payload, and a controlled deorbit burn is not always possible. Solar radiation pressure and Earth-Moon perturbations then nudge the stage for months or years. The Falcon 9 stage launched in January 2025 carrying Firefly’s Blue Ghost-1 and ispace’s Hakuto-R Resilience; it took nineteen months for the Moon to catch it.

Most of the cameras were not pointed at the right pixel at the right fraction of a second. Jose Maria Madiedo at the Astrophysics Institute of Andalusia in Spain did publish ground-based video the next day, showing a faint plume rising above the lunar limb, but the impact point was hidden behind the Moon’s edge from his vantage. The VLT sodium and lithium detection came from Carl Schmidt, a Boston University planetary astronomer whose thesis work was on Mercury’s sodium exosphere. He had the right high-resolution spectrograph on the right telescope at the right time, and he caught a falloff of sodium and lithium emission extending tens of kilometers above the impact for five to ten minutes. The lithium is the smoking gun: the upper stage’s aluminum-lithium alloy tankage is the only plausible source.

The more satisfying story is Danuri’s. The Korean orbiter made a deliberate maneuver in mid-July to clear a worrying close approach with the incoming stage, then returned to its nominal orbit in time to take a pre-impact image at 3:01 p.m. KST on August 5, thirty-three minutes before the strike. Seven more imaging sessions followed over the next fifteen hours. The before-and-after comparison, released through the Korea Aerospace Administration on August 12, shows an unambiguous change in surface texture around the impact coordinates and a darker patch of ejecta extending some distance from the new crater. The LUTI camera has a resolution of a few meters per pixel, and the new crater is roughly the size of a single pixel or slightly larger.

The finer imaging will come from LRO. Mark Robinson, the LRO Camera principal investigator, told Inside Outer Space that the orbiter’s clean pass over the impact region on August 11 closed the acquisition cycle, with the crater in view at the LROC Narrow Angle Camera’s native 50-centimeter resolution. The high-resolution LROC imagery is expected to be published once the data is processed.

The science starts with the energy budget. A 3,900-kilogram object hitting the Moon at 2.43 km/s carries KE = 0.5 * m * v^2 ≈ 11.8 gigajoules of kinetic energy, equivalent to roughly 2.8 tons of TNT. By the standard point-source crater scaling for competent regolith, this corresponds to a transient crater about 17 meters in diameter and a final crater in the 20-30 m range once the walls have slumped, matching the predictions published by Fernando and colleagues (arXiv:2607.14625) and by Jo and colleagues at UT Austin (arXiv:2607.23904). The latter paper predicted an ejecta curtain extending 15-20 km above the surface, a central spike reaching 75-100 km, and a lateral spread of about 183 km. The central spike is the part that briefly exceeded the lunar escape velocity and would have scattered fine dust into cislunar space.

The interesting engineering question is what the hollow impactor did to the standard crater-scaling law. A spent Falcon 9 stage is mostly an empty propellant tank with a single Merlin Vacuum engine hanging off one end. Schmidt’s lithium detection is direct evidence that the stage broke up during entry rather than punching through as a coherent cylinder, because the lithium is locked inside the aluminum-lithium alloy of the tank bulkhead and would have vaporized before reaching the surface if the stage had stayed intact. The Chang’e 5-T1 double crater in 2022 told a similar story: a hollow rocket body, a mass distribution front-to-back that nobody had published, and a crater shape that surprised the modellers. Artificial impactors are not point masses.

The cislunar tracking problem is the bigger engineering gap. Ground-based optical and radar observations lose accuracy past about 0.1 AU because the radar return on a tumbling aluminum cylinder is weak and the optical signal is dominated by the Earth’s background. The Falcon 9 stage’s final weeks were tracked primarily by amateur astronomers using the Bill Gray Project Pluto pipeline and a handful of university observatories. The successful prediction and observation of this impact is a useful stress test of that network, and it came through. The next test, with about a hundred more lunar missions in the queue, will not be optional.

The Moon now has a second confirmed artificial crater, a fresh cislunar debris benchmark, and the first multi-instrument dataset of its kind. The VLT sodium and lithium detection is the cleanest engineering fingerprint of an artificial impact ever recorded, and Danuri’s images give crater-scaling models a calibration point they have not had before. LRO’s high-resolution pass on August 11 is expected to close the loop once the imagery is processed.

The less comfortable lesson is that cislunar traffic management is still a volunteer effort. The Falcon 9 stage was tracked, modeled, and observed by a coalition of amateur astronomers, two national space agencies, and academic research groups. There is no equivalent of the FAA for the volume of space between Earth and the Moon. As lunar launch cadence rises, that will have to change, because the next artificial impact will probably not be a quiet one with a known stage and a predicted trajectory. It will be a piece of hardware nobody realizes has drifted into the wrong orbit, and the only way to notice it in time is to be looking.


September 26, 2026

A comet older than the Sun

Posted by


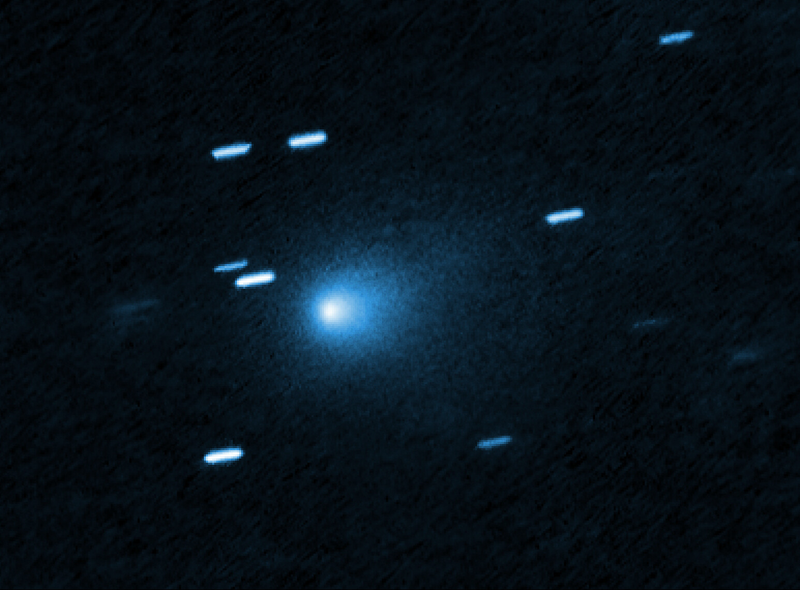
A telescope exposure shows a comet as a compact bright core inside a soft blue coma, while background stars are drawn into short dashes by the tracking.


Look at the image above. A teardrop-shaped cocoon of dust drifts against a backdrop of smeared star streaks. The streaks are not an aesthetic choice; they are the signature of a tracking problem. The Hubble Space Telescope was locked onto the comet and the sky slid behind it, smearing every background star into a line. The dust cloud we are looking at has to be tracked because it is moving fast. 3I/ATLAS, the third confirmed interstellar object ever seen passing through the solar system, was discovered on 1 July 2025 by the ATLAS survey telescope in Rio Hurtado, Chile, and was already 365 million kilometers away when Hubble photographed it on 21 July (NASA, ESA; heic2509).

What makes 3I/ATLAS different from its predecessors, 1I/’Oumuamua in 2017 and 2I/Borisov in 2019, is not its speed. At a hyperbolic excess velocity near 57 km/s, it is comparable to Borisov. The difference is that we have had time and the James Webb Space Telescope. A paper led by Martin Cordiner at NASA Goddard, posted to arXiv in March and published in Nature on 22 June 2026, reports JWST spectra that pin down isotopic ratios in the gas around the nucleus, and those ratios say where the object came from (Cordiner et al., 2026, arXiv:2603.06911).

The first two interstellar visitors were case studies in frustration. ‘Oumuamua showed no detectable coma and accelerated away from the Sun with no visible tail, generating a decade of papers arguing about whether it was a hydrogen iceberg, a fragment of nitrogen ice, or a piece of exotic rock. Borisov behaved more like an ordinary comet but was already past perihelion when discovered and faded fast. Both passed through the inner solar system in weeks, neither caught by an instrument capable of high-resolution infrared spectroscopy.

3I/ATLAS was caught early and held for months. Perihelion came on 29 October 2025 at 1.36 AU, deep enough inside the snow line for volatiles to drive an active coma. JWST observed it with NIRSpec on 6 August 2025 while it was still inbound at 3.32 AU, and again on 22–23 December 2025 as it climbed back out. Program 5094 put the integral-field unit on the target with a 0.1-arcsecond pixel scale, resolving structures about 130 kilometers across inside the coma (Cordiner et al., 2026).

The headline numbers are extreme. The CO₂-to-H₂O ratio at ingress is 7.6 ± 0.3, which sits 4.5 sigma above the trendline for solar-system comets. The CO-to-H₂O ratio is 1.65 ± 0.09. Methane was detected for the first time on an interstellar object, but only on the outbound side, which suggests it lives buried deeper than the more volatile CO and CO₂. The dust spectrum shows a strong 10-micrometer amorphous-silicate feature rather than the crystalline silicates that dominate solar-system comets (Cordiner et al., 2026).

What makes the paper worth reading past the abstract is the isotopic table. The deuterium-to-hydrogen ratio in the water coming off the nucleus is (0.95 ± 0.06)%, more than thirty times higher than in typical solar-system comets and comparable to dense interstellar-medium ices. The ¹²C/¹³C ratio runs 141 to 191 in CO₂ and 123 to 172 in CO, both well above the solar value of about 89 (Cordiner et al., 2026).

In astrophysics, isotopes are clocks. Deuterium is fragile: it is destroyed in stars and rebuilt only by spallation and the Big Bang. A high D/H ratio means the water never spent long inside a hot stellar environment. It was locked in cold ice, somewhere below about 30 K, for most of its existence. The ¹²C/¹³C ratio is a slow clock that runs on stellar nucleosynthesis. Older stellar populations in the galactic disk have more ¹²C because ¹³C is produced by hot CNO burning and mixed in over time. A high ¹²C/¹³C ratio points to material that formed before the disk had been stirred by many generations of stars.

Plug those constraints into a simple galactic-chemical-evolution model and 3I/ATLAS dates itself. The numbers are consistent with formation between roughly ten and twelve billion years ago, when the universe was at its peak rate of star formation, what astronomers call cosmic noon (Cordiner et al., 2026). That is almost three times the age of the Sun. The comet we are watching today was already a respectable lump of ice before the disk of gas that would become our solar system had finished collapsing.

There is one caveat, raised by Maggiolo and colleagues in The Astrophysical Journal Letters. Galactic cosmic rays can rewrite the surface chemistry of an interstellar object over billions of years, converting CO into CO₂ and building an organic-rich irradiated crust roughly fifteen to twenty meters thick. The volatiles we see today may sample that processed shell rather than the pristine interior (Maggiolo et al., 2026, ApJL).

The instrument is NIRSpec on JWST, in integral-field-unit mode. The IFU slices the field into a 30-by-30 grid of 0.1-arcsecond spaxels, each a tiny spectrograph feeding a 0.6-to-5.3-micrometer spectrum through crossed dispersers. The high-resolution gratings G235H and G395H deliver a resolving power near 2,700, enough to separate the vibration-rotation lines of H₂O, CO, CO₂, and their rarer isotopologues, including HDO and ¹³CO₂.

To go from line intensity to abundance requires radiative-transfer modeling. For a spherical, expanding coma with constant velocity, the column density of a species is proportional to its production rate divided by its photodissociation rate times its lifetime, scaled by a Haser-model factor of 1/r where r is the projected distance from the nucleus. The Cordiner team used the Planetary Spectrum Generator to fit line fluxes at multiple spaxels simultaneously, then propagated the uncertainties through the production-rate inversion. The 0.95% D/H ratio is the marginalized posterior after fitting both HDO and H₂O lines at multiple offset positions, and the precision is what makes it significant (Cordiner et al., 2026).

The engineering lesson is that an instrument designed to stare at the first galaxies is also a perfectly serviceable high-resolution infrared spectrometer for a faint, fast, mid-plum comet. JWST’s sunshield keeps the telescope cold enough that its own thermal background does not swamp the molecular lines, the IFU’s fine spatial sampling lets the team disentangle nucleus emission from extended coma, and the orbit at L2 means the same target can be re-observed weeks later with the same geometry.

3I/ATLAS is the first object we have ever measured that we can confidently call older than the solar system. Its isotopes tell us it condensed out of interstellar ices near cosmic noon, that it survived a passage through a planetary system without being torn apart, and that it has spent billions of years coasting through the galaxy getting slowly sandblasted by cosmic rays. It is, in a real sense, a piece of archaeology delivered free of charge to the inner solar system.

Two questions now drive the field. How much of the unusual composition is primordial and how much is the irradiated crust, and how thick is that crust? And harder: are there more like it? LSST at the Vera Rubin Observatory is scanning the southern sky in earnest, and its 3.2-gigapixel camera will catch the next interstellar interloper at a much earlier phase. If the JWST spectrum of this comet is representative, future visitors will be obvious from their CO₂ excess long before a big telescope has to swing.

The interstellar comet has already whipped past Jupiter, in March 2026, and is now climbing out of the solar system toward the constellation Gemini on a hyperbolic escape trajectory. It will not come back. We caught it once. The next one will not surprise us.

Sources: Cordiner, M. A. et al., “Isotopic evidence for a cold and distant origin of 3I/ATLAS,” Nature, published 22 June 2026 (arXiv:2603.06911); NASA/ESA Hubble Space Telescope image heic2509, “3I/ATLAS,” NASA, ESA, D. Jewitt (UCLA), image processing J. DePasquale (STScI), 7 August 2025; NASA Science Mission Directorate, “Comet 3I/ATLAS” page, science.nasa.gov/solar-system/comets/3i-atlas/; Maggiolo, R. et al., “Galactic Cosmic Ray Processing of Interstellar Object Volatiles,” The Astrophysical Journal Letters, 2026.


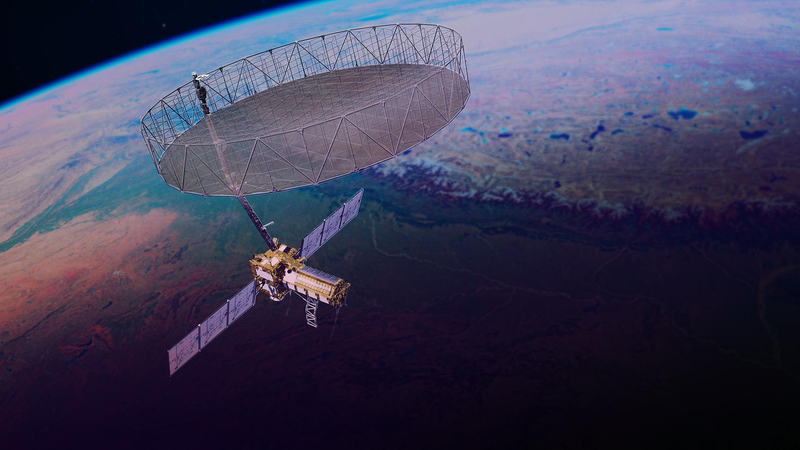
A radar satellite carrying a large drum-shaped mesh reflector on a boom flies above a false-colour landscape of river valleys and lakes.


The GSLV Mk II is not, on paper, the most glamorous rocket in the world. It does not chase Falcon 9 reuse statistics, and it has historically been used for the unglamorous work of dropping navigation payloads into geostationary transfer orbit. On July 30, 2026, at 8:10 a.m. Eastern, an Indian GSLV F-16 lifted off from Satish Dhawan Space Centre on the Palk Strait coast, and for the first time in the vehicle’s history it pointed its cryogenic upper stage south-southwest, toward a 747-kilometer sun-synchronous orbit. The payload was a 2,800-kilogram stack that NASA and the Indian Space Research Organisation (ISRO) had spent eleven years building together. NASA called it the most expensive single instrument it had ever flown; ISRO called it the heaviest foreign payload it had ever launched. Within twenty minutes, both ground stations had signal. The spacecraft, NISAR, was healthy on orbit, and the largest unfurlable radar reflector ever launched was still folded against its side (SpaceNews, July 21, 2026).

Earth-observing radar is not new. The European Space Agency’s ERS-1 flew a C-band synthetic aperture radar in 1991. Japan’s ALOS, Germany’s TerraSAR-X, and the Copernicus Sentinel-1 constellation have, between them, turned interferometric SAR (InSAR) into a routine tool for tracking millimeter-scale ground motion across continents. What NISAR adds is two capabilities stacked together: it is the first civilian radar satellite to carry both an L-band system at 1.257 gigahertz (about 24 centimeters wavelength) and an S-band system at 3.2 gigahertz (about 9 centimeters), sharing one 12-meter mesh reflector and one 9-meter boom (NASA, 2026 mission fact sheet).

That dual-frequency design closes a gap that has bedeviled the field for thirty years. L-band penetrates vegetation and dry soil, so it stays coherent over forests and crops long enough to measure slow tectonic creep. S-band is more sensitive to the top surface, so it tracks flood extent, snow wetness, and crop structure. Flying them together means a single pass produces two interferograms that can be differenced to remove atmospheric phase noise. The mission is set to map nearly all of Earth’s land and ice surfaces twice every twelve days, every cycle of 173 orbits, for at least three years (NASA, 2026).

The cost is real: NASA’s contribution sits at roughly $1.2 billion, ISRO’s share at about 7.88 billion rupees ($91 million) in 2017 terms, though the actual figure is higher now (SpaceNews, July 21, 2026). That is the price of joining two cautious space agencies into one program that survived an antenna repair that required a round-trip shipping container between Bangalore and California.

The GSLV F-16’s profile looked normal on paper: liftoff mass around 420 tonnes, the standard S9.4 cryogenic third stage burning liquid hydrogen and liquid oxygen, a 17-meter payload fairing. What was not standard was the orbit. The Satish Dhawan range usually targets 36,000-kilometer geostationary slots, and the polar corridor is dominated by the smaller, solid-fueled PSLV. Pushing a 2,800-kilogram payload with a stowed 12-meter mesh reflector into a sun-synchronous orbit required every kilogram of performance the cryogenic upper stage could deliver, and a launch window that avoided the eclipse season that would have left the stowed reflector swinging through 200-degree temperature swings during deployment.

The earlier slipped target of March 2025 was abandoned because engineers discovered during thermal-vacuum testing that the reflector’s black structural rods would absorb too much solar heat stowed. NASA shipped the antenna back to Goddard Space Flight Center, where technicians applied strips of reflective tape to the rods, and put it on a C-130 back to India in October 2024 (SpaceNews, December 2024). After that, the schedule bowed to ISRO’s launch cadence: the NVS-02 navigation satellite needed the same pad first, six to eight weeks of pad refurbishment followed, and then a slot had to be picked that would keep the spacecraft out of eclipse for at least the first weeks of its commissioning.

When the rocket climbed off the pad on July 30, it did so against a backdrop few in the West paid attention to. ISRO had lost the EOS-09 radar imaging satellite on a PSLV third-stage failure on May 17, 2026, and the NVS-02 navigation satellite had been stranded in the wrong orbit in January after a propellant valve failed to open. Neither hardware line is shared with GSLV, but the question of process discipline was in the air. The July 21 press conference that confirmed the launch date did not include a single ISRO representative, a fact NASA attributed to the time difference but which industry sources flagged as unusual (SpaceNews, July 21, 2026). Two days after launch, both parties confirmed that the spacecraft was operating normally and that solar array deployment had succeeded.

The most counter-intuitive thing about NISAR is that it is not, strictly, an imaging instrument. A SAR builds an image by emitting a chirped radar pulse, listening to the echo, and using the platform’s forward motion to synthesize an antenna tens of kilometers long. Range resolution comes from the chirp bandwidth (NISAR’s L-band transmits 80 megahertz of bandwidth, giving roughly 2 meters of slant-range resolution; S-band transmits 37.5 megahertz for about 5 meters). Azimuth resolution comes from Doppler processing of the returns along the flight track. The signal is recorded in phase, so a second pass from almost the same position lets you subtract two images and recover ground displacement to the centimeter level. The relation is:

Δr = λ / (4π) * Δφ

where λ is the radar wavelength and Δφ is the wrapped interferometric phase. At L-band, a phase change of one radian corresponds to about two centimeters of line-of-sight motion.

The reflector is the engineering showpiece. Stowed, it fits inside a 1.5-meter collar; deployed, it becomes a 12-meter ribbed disk covered in gold-plated molybdenum wire mesh. The 9-meter boom that holds the feed assembly is built from composite truss segments that unfold in a sequence to avoid contact with the reflector surface; the whole assembly weighs about 145 kilograms. NASA and Astro Aerospace invented a new hinge mechanism because earlier mesh reflectors of this diameter were not designed for the thermal cycling of a sun-synchronous dawn-dusk orbit.

The orbit itself is part of the engineering story. NISAR flies in a 6 a.m. / 6 p.m. ascending-node sun-synchronous configuration, which gives consistent illumination across the 12-day cycle. The exact repeat of 173 orbits in 12 days constrains the swath to about 242 kilometers, which in turn constrains the antenna geometry. The mission team designed a ScanSAR mode in which the radar beam is electronically steered across five sub-swaths in elevation, then assembled into a wide swath at the cost of coarser azimuth resolution. NISAR will operate primarily in this mode.

Finally, the data pipeline. NASA’s Alaska Satellite Facility DAAC will host the L-band data; ISRO’s Bhoonidhi portal will host the S-band data. Both agencies committed to a 24-hour urgent-acquisition capability: within a day of a magnitude-7 earthquake, NISAR could re-point to map the coseismic deformation field over hundreds of kilometers.

If commissioning goes as planned, NISAR will begin science operations in October 2026, after roughly ninety days of radar calibrations, antenna deployments, and orbit trim maneuvers. Early months of data will be dominated by earthquakes, glacier flow, and agricultural calibration campaigns over the US Corn Belt. Within a year, NISAR should be producing the most consistent global interferometric stack ever assembled, a baseline that will outlast Sentinel-1C and ALOS-4.

The broader lesson is older than radar. Eleven years, two agencies, 2,800 kilograms, one reflector, two frequencies. Earth observation at this scale is no longer a single-country program. What NISAR proves is that two different bureaucracies can still agree on what a centimeter means.