OrbitalHub

Where curiosity reaches escape velocity.

Domain is for sale. $50,000,000.00 USD. Direct any inquiries to contact@orbitalhub.com.

Archive for 2026


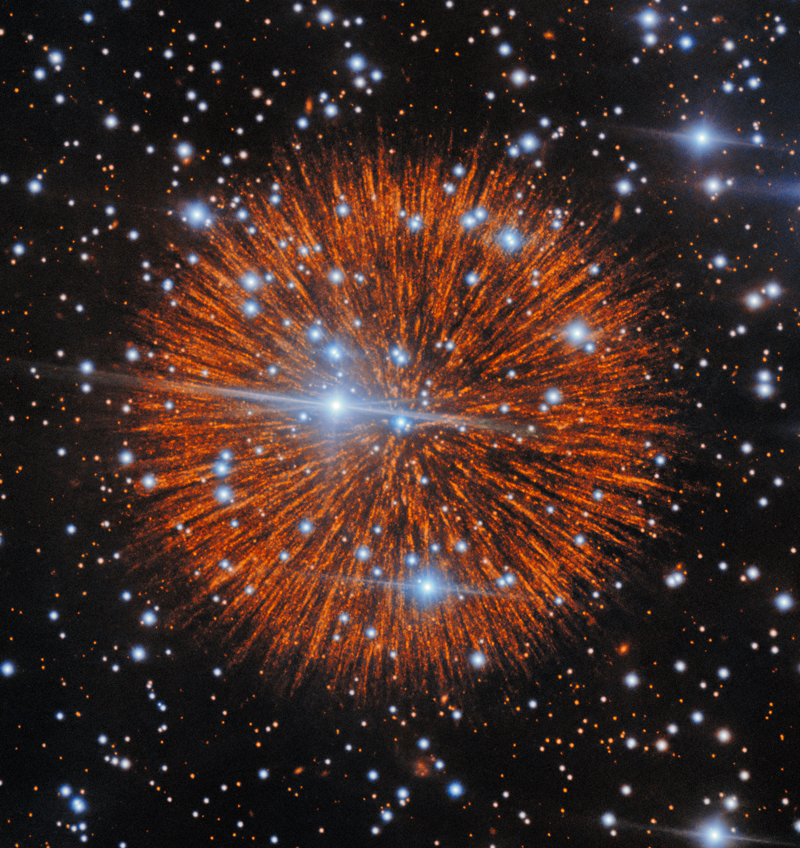
Gemini North narrowband image of the supernova remnant Pa 30, captured with GMOS in [S II] and [O III] filters showing the orange radial filaments resolved into cascades of small knots around the bright blue central star, IRAS 00500+6713.


In the constellation Cassiopeia there is a small, oddly symmetrical puff of gas that, on the best nights, looks like a firework frozen at the instant it bursts. Astronomers call it Pa 30, and it is the leading candidate for the remains of a supernova that flared over China, Japan, and the medieval Middle East in the summer of 1181. New narrowband imaging from the Gemini North telescope on Maunakea, published on 6 October 2026 in The Astrophysical Journal, shows that Pa 30’s famous radial filaments are not smooth streamers at all. They are chains of small, evenly spaced knots of gas, lined up like beads on a string along every spoke of the nebula, and the new observations resolve about ten times more of them than any previous study had seen (Cunningham et al. 2026 ApJ; NOIRLab press release). That changes what astronomers thought they were looking at, and it gives the field a way to measure how the ejecta of an 850-year-old failed thermonuclear supernova actually broke up as it ran outward.

Pa 30 was nothing more than an entry in a star catalogue until 2013, when an American amateur astronomer named Dana Patchick, sorting through Wide-field Infrared Survey Explorer data for a citizen-science hunt for planetary nebulae, picked out a previously unrecognized infrared source he labelled “Pa 30” (Sci.News). Follow-up imaging on the 2.1-metre telescope at Kitt Peak and then the 2.4-metre Hiltner telescope revealed a faint nebula threaded by remarkably straight radial filaments, almost perfectly circular in outline, with a hot blue star at the centre (Cunningham et al. 2026 arXiv:2610.06424). The reason that matters is that a normal Type Ia supernova is the catastrophic disruption of a white dwarf that has been pushed over the Chandrasekhar mass limit by accretion from a companion. The white dwarf is destroyed completely; no central star survives; the expanding debris forms a roughly spherical shell with no heartbeat. Pa 30 has a star at its centre that is still very much alive and very hot. Spectra put its surface temperature at roughly 200,000 kelvin and its stellar wind at about 16,000 kilometres per second (Cunningham et al. 2026 ApJ). That is the calling card of the much rarer Type Iax class, a family of faint thermonuclear explosions in which the white dwarf survives the blast, sometimes barely. Only a handful of Type Iax events have been catalogued, and Pa 30 is the only confirmed one whose remnant we can resolve in detail.

The 1181 identification is what turns Pa 30 from a curiosity into a calibration point. Eight separate texts record that a “guest star” appeared in Cassiopeia between 4 and 6 August 1181 and remained visible to the naked eye for 185 days. For decades the historical remnant was confused with the radio pulsar wind nebula 3C 58, but 3C 58 turned out to be too old to match. In 2021, Andreas Ritter and a team at Queen’s University Belfast identified Pa 30, with its associated central star (which they dubbed Parker’s Star after the Hong Kong astronomer Quentin Parker), as the much more plausible remnant of the 1181 event (Sci.News). The geometry fit: an age of roughly 850 years, a position consistent with the historical records, and an ejecta velocity near 1,000 kilometres per second. The 2026 Gemini North campaign, led by Tim Cunningham, then at the Center for Astrophysics at Harvard and Smithsonian and now at the University of Warwick, with Ilaria Caiazzo at the Institute of Science and Technology Austria, John Raymond, and Scott Kenyon, set out to see what was hidden in the filaments at the highest resolution available from the ground. They used the Gemini Multi-Object Spectrograph (GMOS) in narrowband filters tuned to the [S II] and [O III] emission lines of low-ionization gas, and took very long exposures to pull faint substructure out of the background. Each radial spoke resolved into a string of small bright knots separated by fainter gaps, marching outward from near the central object, and the [O III] imaging produced the first confirmation that the diffuse oxygen emission in the nebula is co-spatial with the sulphur filaments rather than being a separate, smoother component (Cunningham et al. 2026 ApJ).

The other headline from the same campaign is a quiet one: the centre of the nebula sits almost exactly where the central star sits. Surviving supernova remnants are expected to recoil, and models of double-white-dwarf mergers predict a kick of anywhere from a few to several hundred kilometres per second for whatever survives the blast. Cunningham and colleagues used their imaging to pin the geometric centre of Pa 30 with a Monte Carlo Markov chain and compared it to the position of the central star, concluding that any transverse kick must be under about 100 kilometres per second at the 3-sigma level (Cunningham et al. 2026 arXiv:2610.06424). That is unusually small for a merger survivor. It tightens the constraint on how energetic and asymmetric the explosion could have been, and it adds another piece of evidence that the 1181 event really was a Type Iax: a comparatively gentle thermonuclear runaway in which much of the white dwarf’s mass was ejected but a substantial core remained intact, sitting nearly where it began. What the knots themselves are made of is the open question the new data sets up. If the filaments were once smooth, their beaded structure implies either that the ejecta itself was clumpy on small scales when it was launched, or that the interstellar or circumstellar material the ejecta ran into was inhomogeneous enough to break the flow up into discrete radiative-cooling zones. The characteristic spacing Cunningham’s team measures, around 10^16 centimetres per knot, is roughly the size scale that Rayleigh-Taylor fingers in supernova remnants are expected to produce, and strings of similar knot cascades can be seen in the core-collapse remnant Cassiopeia A, although without Pa 30’s strict radial geometry (Cunningham et al. 2026 ApJ).

Follow-up is already in the queue. STScI program 18082, accepted in June 2026, will pair the Gemini narrowband imaging with a 16-orbit Hubble WFC3 campaign in [S II] to map Pa 30’s filaments across their full length, and JWST program 9111, in parallel, is using MIRI’s integral-field unit to obtain mid-infrared spectra of six bright filaments to measure their dust content and cooling balance. The combination should let the team tie the optical knots to specific ejecta species (oxygen, neon, sulphur) and to the dust that survived the explosion, and to test whether the beading is consistent with a clumpy progenitor or a clumpy medium. There is also a separate, very recent coda to the Pa 30 story: a separate team announced in early October 2026 that the central star, IRAS 00500+6713, has a measurable green tint in its visible-light spectrum, the first white dwarf to show one, painting it with the same mechanism that gives oxygen-rich Wolf-Rayet stars their colour (NASA APOD 2026 October 7). The 1181 supernova is the only historical Milky Way Type Ia-class event whose remnant we can resolve and the only Type Iax remnant at all, and with knots now measurable one by one, a quiet central star that did not fly away, and a Hubble and JWST follow-up in flight, it is the closest thing the field has to a benchmark for what a failed-but-not-quite thermonuclear supernova looks like 850 years after it happened.
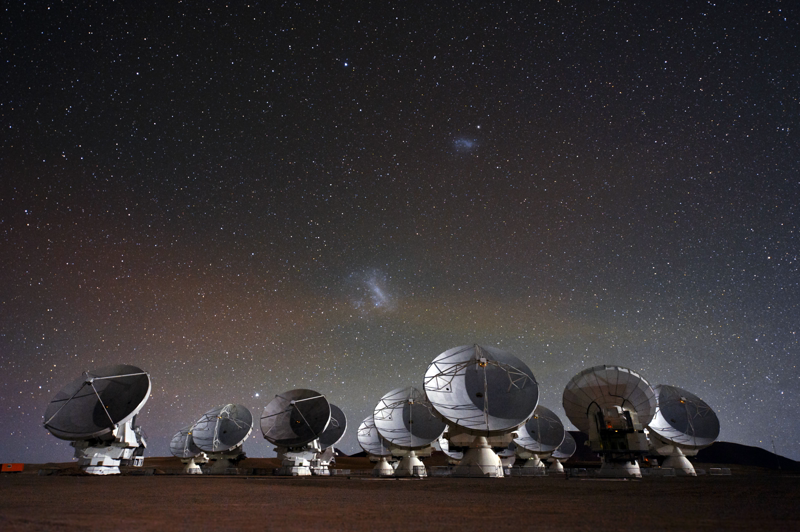


ALMA antennas on the Chajnantor plateau under the Magellanic Clouds


SETI has spent decades listening for narrowband radio signals, mostly below a few gigahertz. Most of that listening has been concentrated in a small slice of the radio dial. A new analysis from the University of Manchester points at a different slice and asks what has been there the whole time.

Louisa Mason, a PhD researcher at Manchester, used four archived observations from the Atacama Large Millimeter/submillimeter Array (ALMA) in Chile to run the telescope’s first SETI survey. The work, published in the Monthly Notices of the Royal Astronomical Society, focuses on ALMA’s Band 3 receivers and two narrow frequency windows near 90.642 GHz and 93.151 GHz. Those frequencies sit well above the traditional SETI bands and have barely been searched for narrowband technosignatures.

No candidate signals exceeded the survey’s detection thresholds. That is the expected result for a first pass, and the researchers describe the result as an opening of parameter space rather than a discovery.

SETI is shaped as much by instrumentation as by theory. Most narrowband technosignature work has relied on telescopes such as the Green Bank Telescope, the Parkes Murriyang telescope, and the Allen Telescope Array. Those instruments are excellent in their ranges but were not built for the millimeter and submillimeter bands. ALMA is sensitive above 35 GHz in a way few other facilities can match, and it has been producing archived data since 2011.

The implication is straightforward. A signal at 90 GHz could be present in ALMA data right now without anyone having looked. The new analysis is the first structured attempt to check.

There is a secondary finding, also presented at the Royal Astronomical Society’s National Astronomy Meeting in 2026. The same team used Gaia stellar catalogues to revisit the number of stars that earlier SETI surveys actually covered. ScienceDaily’s summary notes that the Manchester group found prior published counts may have understated the real coverage by more than an order of magnitude, with one estimate moving from roughly 288,000 stars to over 6 million once Gaia cross-matching was done properly.

The headline numbers are different from the search itself, but they are linked. Both findings argue that SETI has been sampling the sky less carefully than the literature suggests.

Mason did not request new ALMA time. The survey pulled four archived calibrator scans from the ALMA archive. Calibration observations are short, pointed at bright reference sources, and usually discarded after the data are reduced. Mason treated each scan as a science observation in its own right, looked at the stars that happened to fall in each antenna’s field of view, and searched for narrowband signals inside two narrow windows in Band 3.

The search covered 28 stars in total. They are a mix of main-sequence stars and white dwarfs, drawn from Gaia cross-matches. For each star, the analysis looked for narrowband emissions that would not be consistent with known natural processes in the band. Carbon monoxide, hydrogen cyanide, and diazenylium all produce molecular lines in this frequency range, so a SETI search needs to avoid flagging those as candidates.

The paper’s conclusion is that no candidate technosignatures passed the threshold. The survey’s sensitivity, the bandwidth of the search windows, and the relatively small star sample all limit how much can be inferred from a null result. The University of Manchester’s research record makes the same point in a more compact form.

Universe Today’s coverage walks through Mason’s quote that the millimeter and submillimeter bands “remain almost completely unexplored for SETI,” which is why the team framed the work as opening parameter space rather than confirming or refuting a particular hypothesis.

The Manchester team also pulled out a comparison with existing facilities. The figure in the MNRAS paper shows the frequency coverage each instrument could probe for narrowband SETI work. ALMA’s coverage sits in a region where other radio observatories are not conducting technosignature searches. That is both a justification for the work and an invitation to others to design complementary searches.

SETI looks for narrowband radio signals. The reasoning has not changed much since the early 1970s. Natural astrophysical sources tend to emit across broad frequency ranges, often with characteristic molecular or thermal signatures. A transmitter that uses a stable oscillator and a high-gain antenna concentrates its power into a narrow slice of spectrum. The narrower the signal, the harder it is to explain without technology.

A typical SETI pipeline breaks the recorded spectrum into fine channels, looks for narrow features, and checks that the candidate signal is consistent with the receiver’s beam shape and the motion of the telescope and the target. Drift rates, polarization, and the on-off pattern that comes from tracking a star are all used to separate terrestrial interference from real signals.

ALMA complicates this picture. ALMA is an interferometer, meaning it combines signals from many individual antennas. Each antenna has a defined field of view, and the dishes can resolve sources on the sky. At 90 GHz, that field of view is small. The good news is that any signal coming from a real source on the sky will appear in the antennas that were pointed at it, with a pattern that reflects the interferometer’s geometry. The bad news is that the same geometry creates challenges for confirming a narrowband signal across multiple baselines.

The Mason paper is explicit about these complications. Drift rates at high frequencies are larger because a transmitter of fixed velocity produces a larger Doppler shift per unit time when the carrier frequency is higher. The interferometer’s “undistorted field of view” sets a hard limit on how far off-axis a source can be and still be observed cleanly. The paper treats these as engineering constraints to design around rather than showstoppers.

The four archived scans used in the analysis were calibrator observations pointed at bright sources, not deep integrations. Each scan covers a few minutes of data. A real SETI survey would want longer integrations and a wider range of calibrator fields, but the short data are enough to demonstrate the analysis pipeline and to put a first constraint on narrowband signals at 90 GHz from a small star sample.

The Gaia cross-match that drives the higher star count is a separate but related piece of work. Previous published counts tended to use a single pointing on the sky and the simple catalog of stars within that beam. Cross-matching against Gaia, which has astrometry and stellar parameters for nearly two billion sources, lets researchers classify the targets and identify white dwarfs separately. White dwarfs are interesting for SETI because they are compact, old, and bright at optical wavelengths, and they often have stable proper motions.

The combined message is methodological. SETI can be expanded by re-examining existing archives, and existing surveys can be more ambitious about how they characterize their coverage. ALMA’s archive, described by the National Radio Astronomy Observatory as containing public data from 66 high-precision antennas in Chile, is the obvious next place to look. The European Southern Observatory’s ALMA instrument page adds the same picture from the operator side: a fifty-antenna main array plus a compact array of 12-meter and 7-meter dishes, all working as a single interferometer.

SETI’s search volume has been bounded more by receiver design than by theory. The Manchester group made that bound visible by stepping outside the usual bands and re-examining published star counts. Neither move produced a signal, but together they reset the baseline.

The next test is whether the technique scales. A follow-up that runs the same pipeline across the full ALMA calibrator archive, including longer integrations and additional Band 3 frequencies, would not require new telescope time. It would need a researcher willing to spend the weeks of compute and the careful bookkeeping the analysis demands.

Until that happens, the cleanest summary is also the most honest: SETI has more sky to listen to than it has listened to, and the millimeter bands are still open.


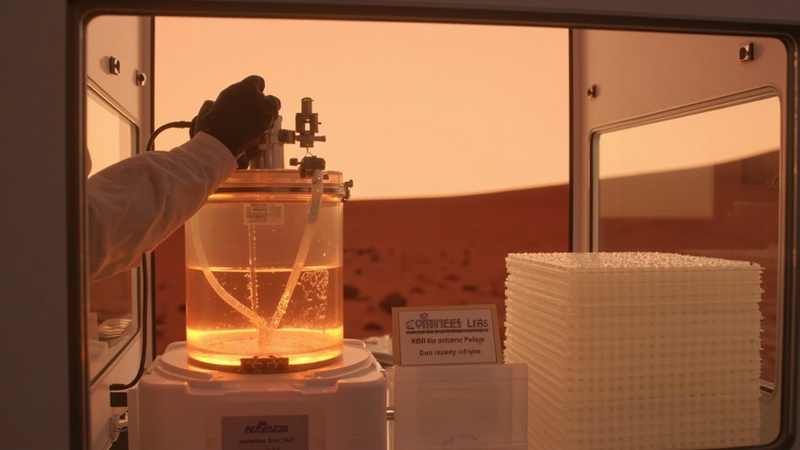
A benchtop bioreactor glowing amber inside a glovebox, with a Mars-red landscape visible through a viewport and 3D-printed bioplastic habitat panels stacked beside it


For the first time, an engineered bacterium has built a useful polymer using only what Mars has on the surface. No Earth fertilizer, no pre-processed feedstock, no shipped-in sugar. The strain, called sPL.001, was announced in late September by Pioneer Labs, a small nonprofit in Emeryville, California, and the underlying paper landed on bioRxiv on 14 September 2026 (Martin et al., DOI 10.64898/2026.09.14.748363). It is the first of five microbes the team plans to field on Mars, and the first to clear a load-bearing question that has hung over every serious terraforming proposal for forty years: can Earth life actually eat Martian dirt?

The case for carrying biology to Mars goes back to the early days of in-situ resource utilization. The standard playbook for a future base assumes you will land everything, refine everything, and recycle almost nothing; biology changes that calculus by adding a self-replicating partner. Pioneer Labs was founded in 2024 by synthetic biologist Erika DeBenedictis, who had cut her teeth on interplanetary mission design as a JPL undergraduate, and the company has spent the last two years narrowing the most ambitious version of the idea down to a single concrete first step (Pioneer Labs, 28 September 2026). The first strain had to be useful on day one, on the path to terraforming, and provably unable to escape and survive in the wild. sPL.001 is the answer they settled on.

What the strain does is unglamorous and important. It pulls carbon, nitrogen, phosphorus, and trace metals out of a slurry of leached Mars regolith, fixes acetate the bioreactor makes from atmospheric carbon dioxide, and stores what it cannot immediately burn as polyhydroxyalkanoate (PHA), the same class of biodegradable polyester that already shows up in compostable cups and medical implants. C. necator H16, the parent, is one of the best-studied PHA factories in biotechnology, with gram-per-liter yields from sugar feedstocks on Earth that have kept industrial microbiologists employed since the 1970s. The trouble is that the Martian surface is a hostile place for it. The regolith is loaded with perchlorate salts, the water activity is negligible, the temperature swings are 80 °C, and the only carbon comes from a thin CO2 atmosphere measured in millibars.

The team’s first move was to screen sixteen candidate chassis organisms in a chemically defined Mars medium that mirrored the soluble fraction of regolith without shipping the actual dirt. C. necator H16 and Pseudomonas putida KT2440 both grew, badly; everything else either stalled or died. They then put the survivors through more than 10^12 cumulative cell divisions of adaptive laboratory evolution, serial passaging under progressively higher acetate and perchlorate stress until a single C. necator isolate, sPL.001, kept dividing. The headline result is a more than three-fold increase in PHA titer compared with the parent strain under the same simulated Mars conditions (bioRxiv preprint, 14 September 2026). That is the engineering win: not a new species, but a strain whose metabolism is rewired for a chemistry no Earth bacterium has ever seen concentrated in one place.

PHA itself is a microbial carbon-storage polymer, a polyester that the cell lays down as intracellular granules when carbon is plentiful and another nutrient, usually nitrogen, is not. The monomer in sPL.001’s case is overwhelmingly 3-hydroxybutyrate, so the material is poly-3-hydroxybutyrate (PHB), a thermoplastic with tensile properties in the same neighborhood as polypropylene and a melting point around 175 °C, both of which matter for habitat shells. In a Mars bioreactor the polymer is harvested from lysed cells, dried, and fed into an extruder or a 3D printer; the resulting panels can be radiation-shielded, pressurized, and stacked into a shell whose raw atoms are 100% Martian (Pioneer Labs, 28 September 2026). That is the second engineering win, and it is the one DeBenedictis leans on: the first rocket lands one bioreactor’s worth of kit, and four years later you have a settlement’s worth of plastic.

The physics of the bioreactor is what makes the system honest. The cells are kept at 30 °C in a stirred, heated vessel that shields them from Mars ambient temperature, vacuum, and UV; they are fed a continuous trickle of acetate from an electrochemical cell running on compressed CO2 and a small amount of water. Outside that controlled environment, the strain is engineered to be helpless. sPL.001 is not photosynthetic, so without the fed acetate it cannot multiply, and without multiplication it cannot evolve. In dry, irradiated, water-starved regolith, desiccation alone sterilizes the cells within hours. A separate arXiv paper, posted in late September 2026 under DOI 10.48550/arXiv.2609.12015, walks through the contamination math: even a catastrophic leak of an industrial-scale Mars bioreactor, the team argues, would clear the COSPAR planetary protection threshold by a factor of several hundred. The numbers do not yet constitute a regulatory verdict, but they are the first quantitative case that an early industrial bioprocess on Mars can coexist with the unfinished business of searching for extant life.

The reception inside astrobiology is measured. Chris McKay, a planetary scientist at NASA Ames, told Scientific American that the organism is “neither revolutionary nor particularly complex” (Scientific American, 2 October 2026). He meant it as a description, not a dismissal. Cupriavidus necator has been in industrial culture collections for half a century, and the pathway that converts acetate into PHA granules is the same one that runs in any overfed microbe on Earth. What is new is the substrate. Neveda Naz, an astrobiologist at Tufts who has grown microbes in material from actual Martian meteorites, called the work a “useful engineering technique” because the team “picked an organism, adapted it to a defined Mars-relevant chemical environment, and demonstrated improved production of a useful material” (Scientific American, 2 October 2026). In other words, the contribution is not the bacterium, but the proof that the bacterium can run on Mars dirt alone, at yields that scale.

That distinction is what makes this a story about engineering, not biology in the usual sense. The bioreactor is a chemical plant whose feedstocks are regolith, water, and air, and whose product is a structural material. The cells are the catalyst. The same logic, run in reverse, is what makes every modern biorefinery work: the organism is a black box that turns cheap local feed into a polymer you would otherwise have to import. The local feed here is just unusually inhospitable, and the polymer ends up holding up a habitat instead of going into a trash can. DeBenedictis has framed it in exactly that language: she called the project “a recipe for building the log-cabin equivalent for Mars” (Asimov Press, 22 September 2026), the first dwelling in a long chain of manufactured ones.

What comes next is the harder part. Pioneer Labs is already engineering a second strain, a perchlorate-eater that would let biology work on regolith that has not been rinsed, and three more chassis organisms are planned to handle nitrogen fixation, photosynthesis, and food-chain starter cultures respectively. None of those will be as photogenic as the first, because the first gets to do the simple thing, eat acetate, store plastic, and stop. The next four have to wrangle Martian chemistry in the open, and the planetary protection math gets tighter with each one. A first launch is years away, and an actual bioreactor on the surface is years past that, but the science question that used to sit on top of the program, can Earth life actually run on what Mars already has, has now been answered in the affirmative, in a peer-reviewable preprint, with a strain whose kill switch is the absence of a feed line.


Argonne's hard X-ray nanoprobe at beamline 26-ID at the Advanced Photon Source: a multimodal LLM agent's chat panel on the left, the synchrotron X-ray nanoprobe illuminating a microchip in the center, and a ptychographic reconstruction on the right showing the interface between two doped regions of a microchip in false-color orange-red and teal-blue.

A microchip sat on the stage of beamline 26-ID at Argonne National Laboratory on a Tuesday in early October. Instead of guiding a motorized stage through a hand-scripted raster, a researcher typed “find the interface between these two regions” into a chat box. A software agent read the instruction, parsed a freshly reconstructed X-ray image, picked a new point on the sample, asked the beamline to move there, looked again, and decided on a third step. After a handful of those scan-reason-move cycles, the agent locked onto the boundary the user wanted and switched itself into a higher-resolution scan mode. No operator wrote Python. The human in the room just talked to the microscope.


That experiment, run at the joint Center for Nanoscale Materials and Advanced Photon Source hard X-ray nanoprobe in the first week of October 2026, is the first time a working agentic AI has steered a synchrotron beamline end-to-end through natural language. The team behind it, drawn from Argonne, Lawrence Berkeley, Brookhaven, SLAC, and Oak Ridge national laboratories, is calling the broader effort SYNAPS-I, short for Synergistic Neutron and Photon Science–Intelligence, and plugging it into the Department of Energy’s Genesis Mission as a flagship demonstration of what an AI-augmented user facility can look like in 2026 (Argonne, October 5, 2026).

For most of the synchrotron’s seventy-year history, the bottleneck at a beamline has not been the X-ray source. It has been the human at the controls. A modern storage ring like the APS sends electrons whirling at seven gigaelectronvolts through a 1.1-kilometer ring of bending magnets, where they shed X-rays bright enough to resolve features a few nanometers across. The catch is that the data deluge starts the moment the shutter opens. At 26-ID, a single experiment at a third-generation nanoprobe writes millions of ptychographic diffraction patterns in a few hours, and every pattern needs a heavy iterative computation to turn back into a usable image. Without live reconstruction, the team on shift has to choose what to scan on the basis of intuition and a coarse preview, then fly home and discover, days later, that the region of interest was three millimeters to the left the whole time.

The SYNAPS-I project, launched in 2025 and led out of Lawrence Berkeley, set out to change that ratio. The first phase, publicly reported in April 2026, replaced the slow offline reconstruction with a real-time engine. The engine, a fine-tuned 2D vision transformer the team calls PtychoFM, ingests raw diffraction patterns as they stream off the detector and returns a reconstructed phase-and-magnitude image in seconds (Argonne, April 2026). The math itself is well understood: a coherent X-ray beam is scanned across the sample in overlapping circles, and the resulting diffraction patterns are stitched together in Fourier space using a difference-map or gradient-descent solver. What PtychoFM adds is a learned prior, a model trained on enough examples that it can skip most of the iteration and guess a plausible reconstruction from a single forward pass, then refine it on the fly as more data arrives. For a beamline scientist, that turns hours of post-experiment waiting into a real-time video feed of structure under the beam.

The second phase, announced in early October, is what made the headline demo possible. The team wrapped PtychoFM in an agentic layer that uses a multimodal large language model as its decision-maker, alongside Meta’s Segment Anything Model 3 (SAM3) as its image-segmentation eye. The agent reads each new image, calls SAM3 to label the structures it sees, and reasons about what to do next in plain English — or rather, in plain tokens. “Agentic AI solves this by interpreting the images reconstructed in real time by PtychoFM, our ptychographic model, leveraging the vision capability of a multimodal large language model,” said Ming Du, an Argonne computational scientist on the SYNAPS-I team, in the October release. The architectural pattern is now familiar from the wider AI world: an LLM plays the role of a slow, generalist planner, a smaller specialist model handles perception, and a set of tool calls translate decisions into beamline commands. Here the tools are the motor controllers of a nanoprobe stage and a reconstruction pipeline running on the Argonne Leadership Computing Facility.

The integration was not trivial. SAM3 is a foundation model of non-trivial size, and the team needed it available to every beamline in the DOE complex rather than baked into one workstation. The Argonne Leadership Computing Facility stood up a cloud-style inference service, the ALCF Inference Service launched earlier in 2026, and the SYNAPS-I team plumbed SAM3 into it. From the agent’s point of view, segmentation is a function call. From the operator’s point of view, asking the beamline “what’s at this spot?” and getting a labeled map back is now as cheap as a chat reply.

The microelectronics demo that closed the October announcement was deliberately mundane. The interface between two doped regions in a chip is a classic defect-investigation target; in 2026 it is also a target that is genuinely hard to localize across devices, because process variation shifts the boundary unpredictably from wafer to wafer. Aileen Luo, the Argonne assistant computational scientist who led the ptychography-model work, framed the result this way: real-time reconstruction “changes the way experiments are performed, enabling researchers to adjust measurements on the fly instead of discovering key features they missed after the experiment has ended” (Argonne, October 2026). The agentic layer extends that loop by closing it. The microscope now decides what to scan next, not just what it has already seen.

What changes because of this is not the physics. The X-ray wavelength, the optics, the sample stage, and the math of ptychographic reconstruction are all the same as a decade ago. What changes is the operator. A graduate student who used to spend a year learning EPICS control scripts can now describe what they want in a sentence and spend the saved time on the science. That is the same labor-shifting move that swept structural biology when cryo-EM got its own AI denoisers, and astronomy when adaptive-optics pipelines learned to schedule themselves. Beamlines are next. By 2030 it is reasonable to expect that a substantial fraction of routine scanning at a synchrotron user facility will be conversational: the operator sets a goal, the agent handles the geometry, the human reviews the result and asks for the next scan.

The cleverness here is mostly plumbing. PtychoFM does the hard imaging work. SAM3 does the segmentation. A multimodal LLM does the planning. The novelty of SYNAPS-I is that Argonne, Berkeley, Brookhaven, SLAC, and Oak Ridge wired those pieces into the same end-to-end loop on a working beamline, and the Department of Energy underwrote it through Genesis. That is harder to copy than any single model. It is also more useful.


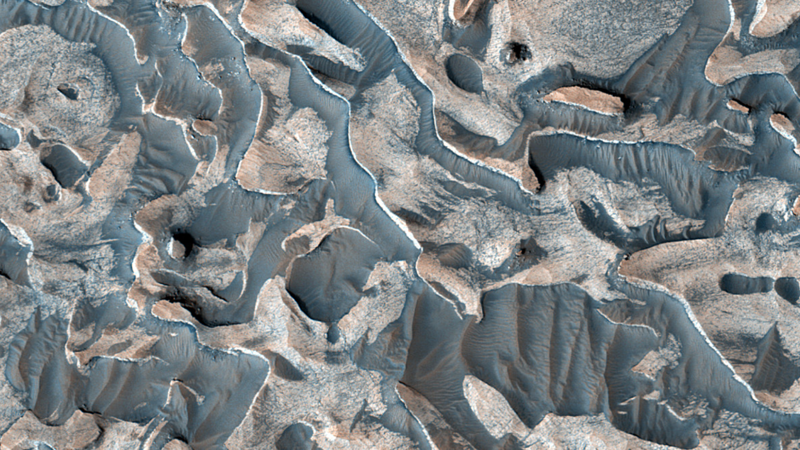
Layered bedrock in a crater within Arabia Terra on Mars, captured by HiRISE aboard Mars Reconnaissance Orbiter and released September 28 2026.


A new overhead image of a Martian crater floor shows branching ridges of pale bedrock winding between darker, dust-floored troughs, an arrangement that looks more like a coral reef than a piece of the red planet. The picture was captured by the High Resolution Imaging Science Experiment, HiRISE, aboard NASA’s Mars Reconnaissance Orbiter and released on September 28, 2026, by HiRISE co-investigator Cathy Weitz of the Planetary Science Institute (Space.com photo of the day for September 28, 2026; Daily Galaxy, September 28, 2026). The terrain sits inside the Arabia Terra region, a vast upland that many planetary geologists regard as one of the oldest, most heavily cratered provinces on Mars. The shapes in the image are not biological. They are layered sedimentary rocks that have been eroded into ridges and pits, and the way those layers repeat across many craters is what makes the image worth a second look. For viewers who only know Mars as a smooth red dot in the night sky, the picture is a reminder of how much texture the planet keeps when you look closely.

What Arabia Terra offers is a stratigraphic archive. Each thin band visible in the rock records a moment in Martian climate history, and the bands stack one on top of another across hundreds of meters of relief. The rhythmic nature of those layers is the whole point. A repeating pattern across a region this large does not arise from one storm, one flood, or one impact; it implies a process that pulsed on and off again and again. The MRO camera that took the picture has been in orbit since 2006, and HiRISE has been returning 25-centimeter-per-pixel images of the Martian surface for almost the entire mission. With more than 100,000 images already on the public catalog, the September 28 release is not a new instrument result. It is a fresh reminder that some of the strongest evidence for an active, water-influenced early climate on Mars has been sitting in the MRO archive for years, waiting for someone to look at it with the right question. The 100,000-image mark was passed in October 2025 on the Syrtis Major plains, and the camera has continued adding observations since.

The deposits were first described as a regional phenomenon in a 2020 paper in JGR Planets by Stack and colleagues (Stack et al. 2020, JGR Planets), who used a combination of HiRISE stereo topography and mineral mapping from the Compact Reconnaissance Imaging Spectrometer for Mars (CRISM) to show that the layered rocks in many Arabia Terra craters share a common stratigraphy. Their preferred explanation was groundwater-fed evaporitic deposition, where water just below the surface cycled up, evaporated, and left behind minerals and fine sediments in regular layers. Lewis and colleagues at the California Institute of Technology had already noted in 2014 (Lewis et al. 2014, JGR Planets) that the rhythmic layering in this part of Mars matches the patterns left by air-fall dust and ash on Earth, which alternate under the influence of orbital cycles. Weitz’s own commentary for the new picture pulls those threads together. The layers are rhythmic, they are widespread, and the most plausible global drivers on Mars are dust storms and groundwater, not isolated local events. Crater counts performed by the same group suggest the layered sequence accumulated mostly during the Hesperian period, roughly 3.0 to 3.7 billion years ago, with the topmost beds stretching into the Amazonian, which is the ongoing geologic era on Mars and the one in which the planet lost most of its surface water. Earlier work by Fergason and Christensen in 2008 had already used thermal imaging to flag the same layered terrain as a candidate record of dust-driven deposition, and the 2020 paper builds on that line of argument.

The image itself is about five kilometers across. The bright ridges are bedrock that has resisted erosion longer than the surrounding material. The darker, bluer-looking troughs are a mix of wind-blown sand and what HiRISE team members call aeolian ripples, the same kind of sand patterns that form under persistent winds in terrestrial deserts. The pits, jagged edges, and crenulated rims the image shows are not the original shapes of the rock. They are erosion scars. Each one marks a layer that has been removed and a layer that has not. The contrast between the two tones is a function of the difference in composition and grain size between the original sediment that hardened into rock and the loose debris that fell on top of it later. HiRISE resolves these textures because it images through three separate color filters and stitches them together; the false-color composites that the team releases are designed to make compositional differences pop, which is why a single scene can look bluish in some places and pinkish in others. HiRISE itself is a 0.5-meter reflecting telescope on MRO, and at MRO’s 250-to-316-kilometer orbit altitude it can pick out features smaller than a meter across. Most of what we know about the fine-scale stratigraphy of Mars has come from that resolution combined with stereo imaging, which lets the team build digital terrain models and measure layer thicknesses down to a fraction of a meter.

The deeper lesson is about how scientists read climate records on a planet that does not have trees, ice cores, or ocean sediment. On Earth, the story of past climate comes from layered archives in lake beds, sea floors, and ice sheets. On Mars, the same role is played by impact craters, which act as ready-made sediment traps and which subsequently get exhumed by wind. Arabia Terra is particularly worth studying because it has been around long enough to have collected material from the Noachian period more than 3.7 billion years ago, when most evidence suggests Mars had a much thicker atmosphere and liquid water on its surface. The layered deposits in the September 28 image are younger than that, but they preserve the same kind of memory. A geologist looking at the rock can read off changes in chemistry, dust load, and water availability across hundreds of millions of years.

A few things remain unsettled. The image does not confirm a single formation mechanism, and the team has been careful not to claim it does. The rhythmic pattern is consistent with several hypotheses, and the right next step is to compare the layer thicknesses and mineralogy from one crater to the next, which the 2020 Stack analysis already started. Future observations from the Mars Reconnaissance Orbiter, and eventually from missions now in development, can sample more of these layered terrains with high-resolution spectroscopy and will be able to test whether groundwater, dust, or volcanic ash dominates the mix. Until then, the picture is best read as a working document: a region that has been taking notes on Martian climate for billions of years, and an instrument still healthy enough to read those notes from orbit.


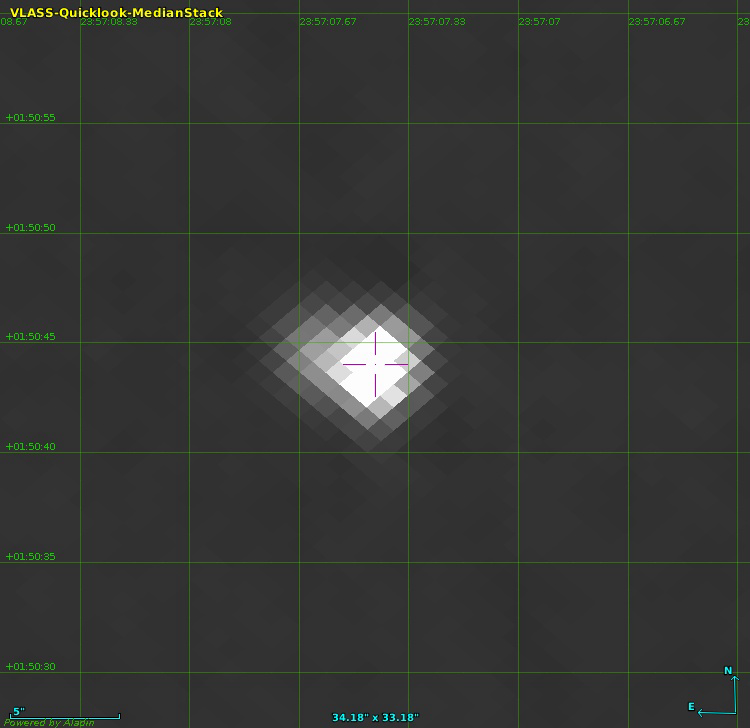
VLASS 3 GHz radio image of TXS 2354+015, with a magenta cross marking the precise optical position of the host galaxy at right ascension 23:57:07 and declination plus 01:50:45; the field of view is roughly 34 by 33 arcseconds and the bright central source is the target's compact radio core. Image: Balmaverde et al. 2026, Figure 4 right panel, retrieved from the arXiv HTML build at arxiv.org/html/2609.28632v1/VLASS.jpg.


On 18 September 2025, the European Southern Observatory’s Very Large Telescope turned its FORS2 spectrograph toward a point of sky in Pisces that no telescope had ever measured at high resolution. The target, catalogued as TXS 2354+015, had been flagged two years earlier as a candidate high-redshift radio galaxy because the optical light from its host galaxy dropped sharply between the green and red filter bands of the Subaru telescope’s Hyper Suprime-Cam. The September observations, reported by Barbara Balmaverde of the INAF Astrophysical Observatory of Turin and four colleagues in a paper uploaded to the arXiv preprint server on 23 September 2026, produced a single bright asymmetric emission line at 7220 Angstroms with an equivalent width of 900 Angstroms and a flux of just under one ten-thousandth of a billionth of an erg per square centimeter per second. That signature, confirmed by a second emission line at the wavelength expected for NV at the same redshift, fixed the source’s redshift at 4.946, a value that places the galaxy as it looked when the universe was 1.1 billion years old and the cosmic microwave background was still warm.

The result makes TXS 2354+015 the most powerful radio galaxy currently known. The team measured its intrinsic radio luminosity at a rest-frame frequency of 500 megahertz, a value long used as the standard reference for comparing radio galaxies because the emission is uncontaminated by synchrotron self-absorption at the source’s redshift. They found 6.2 times ten to the twenty-ninth watts per hertz, almost twice the previous record, held since 2008 by TN J0924-2201 at 3.22 times ten to the twenty-ninth. The new source edges past a threshold that had stood for nearly two decades, and the gain comes not from a marginal improvement but from a clean factor of two.

High-redshift radio galaxies matter because they are the most extreme manifestations of accretion onto a supermassive black hole that the early universe produces, and because the energy the jets pump into the surrounding gas regulates star formation in the host galaxy and balances the cooling of the intracluster medium in its neighbourhood. Numerical simulations of how massive galaxies grow require this feedback to match the observed galaxy luminosity function, so finding the brightest examples at the highest redshifts is a way to test how aggressive that feedback could have been at the time galaxies were assembling their first bulges. The candidate selection is also where the new paper departs from tradition: earlier searches for radio galaxies beyond redshift three relied on the ultra-steep-spectrum technique, which is biased toward one subpopulation, and the team argues that selecting candidates by their optical dropout in the red filter of the Hyper Suprime-Cam Subaru Strategic Program, the Lyman-break method, catches high-redshift radio galaxies whose flat radio spectra would slip past the steepness cut. TXS 2354+015 itself has a radio spectral slope of 0.94, well short of the steepness criterion of 1.3 that traditional searches enforce, and the authors present it as the prototype of an entire missed population.

The follow-up spectroscopy was conducted at the VLT under programme 116.28LA.001 on 18 September 2025, and the radio data were assembled from two large surveys rather than a single observation. The team used the FORS2 spectrograph with the GRIS600RI grism and GG435 blocking filter, a setup that delivers wavelength coverage from 5120 to 8450 Angstroms at a resolution of about 300 kilometres per second; they placed the slit so that it included both the target and a brighter pivot star four arcseconds to the northwest, then took two 1218-second exposures. The extracted spectrum showed a continuum below the detection threshold on the red side of the line and a sharply asymmetric emission line whose blue edge drops within a single resolution element, the canonical signature of the Lyman-alpha line from a galaxy whose neutral hydrogen is being eaten away by the intergalactic medium at that epoch, and a second emission feature at the wavelength expected for doubly ionised nitrogen at the same redshift sealed the identification. The 150 megahertz TIFR GMRT Sky Survey, produced with India’s Giant Metrewave Radio Telescope, gave the low-frequency anchor at 25 arcsecond resolution and 17.5 millijansky sensitivity, while the Karl G. Jansky Very Large Array Sky Survey gave the high-frequency anchor at 3 gigahertz, 2.5 arcsecond resolution, and 70 microjansky noise. The team cross-matched the two catalogs, looked for HSC-SSP optical counterparts within 1.5 arcseconds of the VLA positions, and selected candidates with the Lyman-break dropout signature in the red filter. The candidate that survived was TXS 2354+015, with a radio flux density bright enough to ensure a robust identification and a clean offset of just 0.2 arcseconds between the VLA and optical positions. The 3 GHz image itself, retrieved from the HTML build of the paper, shows a single compact source on a flat background, the canonical appearance of an unresolved high-redshift radio core.

The combined picture is more striking than any single measurement. The host galaxy, as seen by Subaru in the i-band, has a half-light diameter of about 5 kiloparsecs, several times larger than the typical 1.5 kiloparsec radius of a z equals five galaxy in deep-field samples, and the Lyman-alpha emission line is spatially extended over a full width at half maximum of roughly 6 kiloparsecs, consistent with the giant Lyman-alpha nebulae that are known to surround powerful high-redshift radio galaxies and that are aligned with the radio jet axis. The radio position angle, measured from a marginal Gaussian fit to the VLASS image, is 71 degrees, while the slit was oriented at minus 30 degrees, almost perpendicular to the jet, so the team’s measurement likely underestimates the true extent of the nebula. The stellar mass the team infers from the host’s mid-infrared luminosity carries an unusually long list of caveats: the WISE W1 band at 3.4 micrometres captures several emission lines at this redshift, with the brightest being the doubly ionised oxygen line at 5007 Angstroms rest frame, and extrapolating the well-known correlation between radio power and that line’s luminosity from low-redshift samples suggests a host stellar mass near 2 times ten to the twelfth solar masses, a value that would place the galaxy at the very top of the local luminosity function, but a younger stellar population would reduce the estimate by a factor of ten and better spectral energy distribution coverage is required before the number can be trusted.

The discovery will not stay unique for long. The combination of the Lyman-break dropout selection with the cross-matched radio catalogs is now a template that can be reapplied to the rest of the HSC-SSP wide field, a 1400-square-degree footprint that the team estimates contains hundreds of similar candidates. Each one will need VLT or Keck spectroscopy to confirm its redshift, but the path from candidate to confirmed high-redshift radio galaxy is now routine rather than rare, and outside coverage has already framed TXS 2354+015 as the prototype of a population that the older ultra-steep-spectrum searches missed. The implication is that the radio-loud active galactic nuclei population at z greater than four is larger, flatter-spectrum, and more energetic than the existing sample suggested, and that the brightest examples may have been hiding in plain sight in the same wide-area optical surveys that astronomers have been using to find high-redshift galaxies for the past decade. Whether TXS 2354+015 is itself unique or merely the first of a new class is the question the next round of spectroscopy will answer.