OrbitalHub

Where curiosity reaches escape velocity.

Domain is for sale. $50,000,000.00 USD. Direct any inquiries to contact@orbitalhub.com.

Archive for 2026


Layered beige Martian rocks at the Jawbone Canyon site in Gale crater, photographed by NASA's Curiosity rover on Sol 4391 (December 12, 2024), showing the stacked wind ripple laminations interpreted as supercritical climbing wind ripple strata.


Somewhere around 3.6 billion years ago, on what was probably an unremarkable afternoon, a sandstorm rolled into Gale crater on Mars. It may have lasted only hours. By the next day, the wind was back to normal and the surface was a sunlit desert again. No one saw it. Nothing else on the planet recorded it. But the storm left a physical imprint, and NASA’s Curiosity rover drove past that imprint on December 12, 2024, on its 4,391st Martian day, and photographed it (NASA Science Photojournal, July 20 2026).

The imprint is now the cover paper of the July 1, 2026 issue of the journal Geology. A team led by Steven Banham of Imperial College London describes millimeter-thick, crinkly laminations inside a rock the rover team nicknamed “Jawbone Canyon,” in the Mirador formation on the lower slopes of Mount Sharp. The structures are supercritical climbing wind ripple strata: a class of wind-deposited layering so rare on Earth that sedimentologists have only documented it in a handful of modern and ancient settings, and never before on another planet (Banham et al. 2026, Geology 54(7):611, DOI 10.1130/G54158.1).

Mars climate science has long had a sandstorm problem. Orbital cameras have shown that dust devils and regional dust storms lift fines off the surface today. Climate models assume that early Mars had a thicker atmosphere capable of moving sand. But the physical evidence for sustained sand-moving winds on ancient Mars has been almost entirely indirect: cross-bedded sandstones that record long-term wind patterns, dune fields that froze into rock, ventifacts worn by saltation.

Those records cannot resolve a single weather event. A climbing wind ripple is the signature of a wind strong enough, lasting long enough, and carrying enough sand that the ripples could not migrate as fast as new sand arrived. The crests piled up on the stoss side instead of sliding down the lee side. Each millimeter-thick lamina is the trace of a burst of sand transport; the climb angle records how fast sediment accumulated relative to how fast the bedform moved. The team measured angles of 10 to 18 degrees, values the paper says can only be produced by storms lasting minutes to hours, not by seasonal winds over thousands of years.

That makes the Jawbone Canyon outcrop the first direct physical evidence of a sandstorm on Mars. The paper’s wording is measured: “These climbing ripple sets occur in a thin succession, which suggests that they record a broader sustained event, such as a sandstorm or gale, lasting several hours or more.” The phrase is doing real work, because the alternative explanations had to be ruled out one by one. The central argument is a negative: ordinary wind regimes cannot deposit climbing ripples of these thicknesses at these angles, so whatever made them had to be stronger than everyday wind.

A secondary argument reaches further. Banham notes in the paper and in press interviews that the modern Martian atmosphere, at roughly 6 millibars of mean surface pressure, is too thin to drive saltation at the scale required to build these structures (Astrobiology.com, April 4 2026). The deposits imply that the atmosphere three and a half billion years ago was denser than today’s. The exact density is not pinned down, but the qualitative conclusion is clear: the air on early Mars was heavy enough to push sand in ways the present-day air cannot.

The find was not part of any planned observation. Curiosity’s science team operates in shifts, and one of the standing tasks is to scan the black-and-white navigation panoramas taken at the end of each drive for anything anomalous. Banham and his collaborators, including Linda Kah of the University of Tennessee, Joel Davis of Imperial College London, Sanjeev Gupta, Gerhard Paar, and several JPL-Caltech sedimentologists and mission scientists, noticed unusual textures in those panoramas as the rover approached the Mirador formation. They targeted the rocks with the higher-resolution Mastcam, and at full resolution the laminations resolved into the climbing ripple patterns.

Banham described the find as serendipitous: “We weren’t really looking for these deposits, and then lo and behold, we drove around the corner and found them. We were lucky that we had just the right people on shift that recognized them.” The rock itself is modest in size, roughly a meter wide and 20 centimeters high, with six discrete packages of ripple layers stacked through its thickness. The laminae dip toward the north, which means the wind that built them came from the south. Similar climbing ripples were later identified at a nearby site the team named Dry Lake, and the paper argues that the deposits formed near the margin of a larger dune field or in a wind-scoured depression where airflow patterns concentrated sand accumulation.

The discovery is also a vindication of the Mastcam team’s instinct to keep taking high-resolution follow-up imagery of “unusual” textures. Climbing ripples this small could have been mistaken for noise in lower-resolution data, or simply dismissed as weathered outcrop. The fact that a thin succession of six packages survived in one place for over three billion years, exposed at the surface for the rover to roll up to, is its own piece of good fortune.

The terminology is precise. In sedimentology, ripples are small bedforms, typically a few centimeters tall and tens of centimeters in wavelength, that form when wind or water flows over a bed of loose sand and organizes it into regular undulations. In a normal subcritical regime, sand grains saltate up the windward (stoss) face and avalanche down the leeward (lee) face, and the ripple migrates downwind without growing vertically. In a supercritical regime, the wind is strong enough and the sand supply is high enough that grains accumulate faster on the stoss face than they can slide off the lee face, so the ripple climbs. The climb angle is set by the ratio of vertical accumulation to horizontal migration; a 10-degree angle corresponds to roughly six times as much vertical deposition as horizontal migration.

Climbing ripples have been documented in a small number of terrestrial settings: deep-sea turbidity currents, certain wind-blown dune margins, and a few fluvial flood deposits. They are rare because the conditions that produce them are themselves unusual. On Mars, no one had ever identified them, in part because orbital images cannot resolve millimeter-scale laminae and in part because no previous rover had driven through sedimentary terrain with both the imaging resolution and the science team bandwidth to spot them.

The Banham paper lays out the diagnostic criteria: millimeter-scale lamina thickness, climb angles between 10 and 18 degrees, preserved stoss-side grainflow cross-stratification, and lateral continuity across the outcrop face. All four appear at Jawbone Canyon. The team estimates that a single 50-millimeter-thick layer could have formed in 6 to 20 minutes under storm conditions; the full succession of six packages therefore records on the order of an hour or two of sustained sand transport (Daily Galaxy, July 17 2026).

Curiosity has been on Mars for more than thirteen years. In that time it has found evidence of ancient lakes, rivers, groundwater, organic molecules, and a past climate that was at least intermittently habitable. What it had not found, until now, is direct evidence of an ancient sandstorm. The Jawbone Canyon outcrop fills that gap with a single rock roughly the size of a kitchen table.

The immediate payoff is a new constraint on early Mars atmospheric density: the air had to be thick enough to drive saltation at storm intensities. The longer-term payoff is a search template. Banham has said the next thing he wants the team to find is raindrop impact marks, craters in fine sediment left by rain, which would settle a separate debate about whether early Mars ever saw liquid rain rather than only snow and surface runoff. “It would be magic if we found those,” he said. The climbing ripples are not the last stop on Curiosity’s geology to-do list. They are evidence that the rover is still, after 4,391 sols, finding things on Mars that no one had asked it to look for.
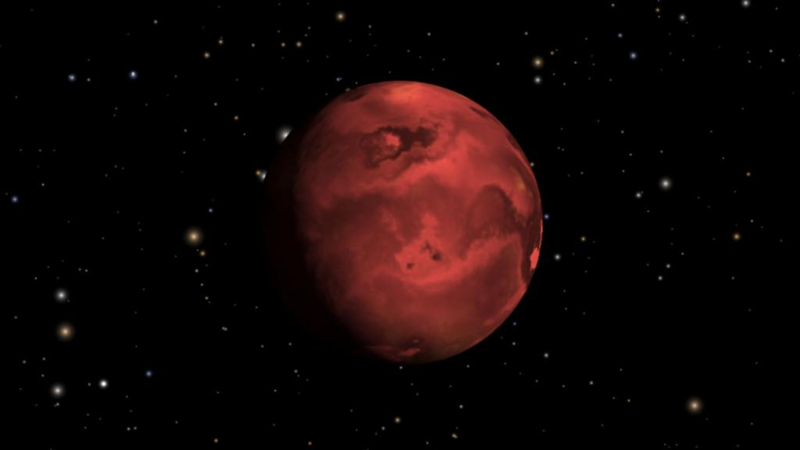


NASA illustration of HD 3167 b, a glowing red-orange rocky super-Earth set against a starry background. The planet's dayside surface is rendered as molten silicate, illustrating the lava-world class the new JWST observation now extends to lower irradiation than any previous atmosphere detection.

Image credit: NASA.


The James Webb Space Telescope, the NASA/ESA/CSA observatory at the Sun-Earth L2 point, has caught an exoplanet doing something a planet that close to its star really should not be able to do. HD 3167 b is a rocky world roughly one and a half times the size of Earth, and it zips around a K-type star in the constellation Pisces once every 0.96 Earth days. At that distance, the dayside should be glowing red-hot bare rock, the kind of surface where silicates are molten and any gas should have been stripped away by stellar wind and high-energy photons long ago. Instead, the dayside is noticeably cooler than the theoretical maximum, and a new analysis of a JWST secondary eclipse says the most likely reason is an atmosphere. It is the coldest lava world with evidence of an atmosphere on record, and the first result from a survey of ten such worlds led by astronomer Megan Weiner Mansfield. The team’s writeup, as covered by Space.com, lays out what makes the detection hard to explain any other way.

That word cool does not mean comfortable. The planet’s equilibrium temperature sits at about 1786 K, somewhere between a slow oven and molten glass. Lava worlds previously caught with atmospheres have all been hotter than roughly 2200 K. HD 3167 b is hot enough that the rock on its star-facing side is almost certainly molten, and cool enough that something other than bare rock is controlling its dayside temperature.

The result, published in The Astrophysical Journal Letters, comes from a single JWST observation using the Mid-Infrared Instrument’s Low Resolution Spectrometer, the team that has been doing most of the heavy lifting on small rocky exoplanets for the last two years. The team watched HD 3167 b slip behind its host star, a maneuver called a secondary eclipse, and measured how much mid-infrared light disappeared. They measured the white-light eclipse depth at 38 plus or minus 11 parts per million. That number is more than five standard deviations shallower than a dark bare rock with no heat redistribution would produce at this distance from the star. The only good explanations are an atmosphere that reflects some incoming starlight back into space, an atmosphere that moves heat from the day side to the night side, or some combination of the two.

The lead author is Brandon Park Coy, a graduate student at the University of Chicago working in planetary scientist Edwin Kite’s group. Kite is the second author and a co-author on a long line of papers trying to figure out which rocky exoplanets hold onto their air. The HD 3167 b paper, described in a University of Chicago news release, is the first published result of a survey that Megan Weiner Mansfield, who did her PhD at Chicago and is now at the University of Maryland, is running. The program is looking at ten lava worlds with JWST and asking a single question. Below what temperature do rocky planets start losing their atmospheres, and above what temperature do they keep them? The published sample so far suggested a gap. Ultra-hot lava worlds such as 55 Cancri e kept their air. Cooler rocky worlds, the ones too cold to be lava worlds at all, often did not. The boundary lived somewhere in the middle, and nobody had measured it.

HD 3167 b sits right at that boundary. Its dayside is too cool for a bare rock, so it has an atmosphere. Its equilibrium temperature is far below the ultra-hot threshold, so it is the first cool end of the population in question. The boundary should sharpen from a guess into a measured curve as the program keeps adding worlds to the sample.

The detection technique itself is worth slowing down on. A secondary eclipse is the small dip in light that happens when a planet passes behind its star as seen from Earth. The dip is small because the planet is much cooler than the star and emits much less light at the wavelengths being observed, but it is measurable, and the depth of the dip tells you how much of the observed light is the planet’s own thermal emission. Doing this in mid-infrared light, around 15 micrometers for this observation, is what lets JWST see the heat of a planet whose dayside is below 2000 K. The same measurement in visible light would be much less informative, because at those wavelengths the planet contributes essentially nothing.

Why does the dayside being cooler than the maximum matter? On a bare rock world with no atmosphere, the side facing the star absorbs starlight, heats up, and re-radiates that heat as infrared light. The temperature that produces is set by the rock’s reflectivity and the distance to the star, and it is the highest possible dayside temperature for that orbit. Add an atmosphere, and two things change. First, the atmosphere can carry heat from the day side to the night side, evening out the temperature. Second, clouds or hazes can reflect some starlight back into space before it ever reaches the surface, lowering the dayside temperature below the bare-rock maximum. Venus is the textbook example of the first effect, with almost no temperature difference between its equator and poles or between its day and night sides. Earth is the textbook example of the second effect. HD 3167 b is showing one or both on a world whose dayside is liquid rock.

What the atmosphere is actually made of, the team is careful to say, is not known. The single JWST spectrum is not precise enough to pick out individual molecules. The paper notes that the dayside emission spectrum is compatible with a silicate-rich composition consistent with vaporized rock, but also with heavier gases like carbon dioxide, carbon monoxide, or water. Picking among those will take follow-up spectroscopy, ideally with JWST’s Near-Infrared Spectrograph, which covers a different wavelength range. The team is also hoping that the rest of the ten-planet program will start to fill in a statistical picture, where several planets measured the same way start to show consistent or inconsistent composition patterns.

The planet itself is also interesting in detail. Its host star, HD 3167, is a K-type main-sequence star slightly smaller and cooler than the Sun, and the planet was first spotted in 2016 in data from the Kepler space telescope’s extended K2 mission, then confirmed by Vanderburg and collaborators in a dedicated follow-up. Like most ultra-short-period rocky worlds, it is tidally locked, with one side permanently facing the star and the other side in permanent night. The new paper refines the planet’s radius to roughly 1.6 Earth radii and confirms the bulk density is slightly lower than a pure Earth-composition planet would suggest, consistent with the planet having a substantial gas layer on top of the rock.

For the broader exoplanet field, the result is a small but real data point in a much larger argument. Most rocky exoplanets found so far, the ones that orbit small cool stars and sit at Earth-like distances, do not have atmospheres. JWST has now measured enough of them to know that, and that has driven a lot of the conversation about whether Earth-like planets are rare or common. Lava worlds are the opposite case. They are easy to observe because they are hot, and the evidence so far is that most of them have something on top of the rock. HD 3167 b extends that trend. It does not change the picture for habitable-zone rocky worlds, but it does sharpen the boundary case where atmospheres start to fail.

There is one quote in the paper and its accompanying press release that captures why a team would spend JWST time on a planet that cannot possibly host life. Lava worlds are useful because they let you watch the processes that matter for all rocky worlds at the extreme end of their temperature range. A planet that is too hot for life can still tell you something about how its rock interacts with its air, how heat moves around, and how clouds form. None of that is unique to lava worlds. All of it shows up in the physics of habitable worlds too. The difference is that on a lava world you can measure it directly, and on a habitable world you mostly have to guess.


October 24, 2026

Mega-Earths may be stellar noise

Posted by


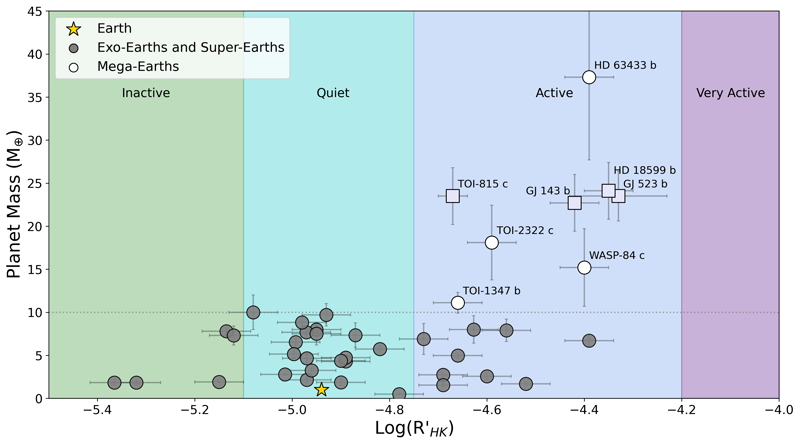
Planet mass plotted against host stellar activity for 333 small exoplanets, with Mega-Earth candidates as open white circles clustered on the Active and Very Active side and ordinary rocky planets as gray circles spanning the inactive through active range


A planet heavier than Neptune but the size of Earth should not, by the rules of how planets form, be a rock. Anything above roughly ten Earth masses is supposed to grab gas from the protoplanetary disk and become a sub-Neptune or larger. Yet a small catalog of worlds has long carried the label “Mega-Earth,” rocky objects sitting above that ten-Earth-mass line, and that label itself colors what people assume about planet formation at the upper end of rocky worlds. A paper published today by Casey Brinkman and Nicolas Cowan at McGill’s Trottier Space Institute argues that the entire category may be a measurement artifact (Brinkman & Cowan 2026, arXiv:2610.12600, reported on by Astrobiology.com the same day). Every candidate Mega-Earth in the literature, the authors show, orbits a magnetically active star. Active starspots and plages mimic and inflate the radial-velocity signal of an orbiting planet, and the chance that all of these outliers would land on active hosts by coincidence is below one percent. The implication is uncomfortable but specific. The Mega-Earths were never there. The detection technique was just seeing starlight flicker, and the label stuck because the underlying objects were just hard enough to disprove.

The category was supposed to mark the upper edge of rocky planet formation. When Xavier Dumusque and colleagues at the Harvard-Smithsonian Center for Astrophysics used the HARPS-N spectrograph on La Palma in 2014 to weigh Kepler-10c, the result landed at seventeen Earth masses packed into a radius only 2.35 times Earth’s (Harvard Gazette, June 2014). That density, on the order of seven grams per cubic centimeter, was consistent with a compressed rocky interior under extreme pressure. The team coined the term “Mega-Earth” (Wikipedia: Mega-Earth) on stage at the Boston meeting of the American Astronomical Society, and Dimitar Sasselov called Kepler-10c the “Godzilla of Earths.” The discovery paper was published in The Astrophysical Journal in June 2014. Subsequent surveys added more candidates with apparent masses between ten and forty Earth masses and radii sitting inside the rocky planet regime, and at various points the literature has listed six to eight such worlds, depending on which mass-radius cuts are applied. Each one pressed against a theoretical limit set by collisional mantle stripping and post-formation erosion that no primordial rocky planet should be able to cross.

What jumps out of the resulting scatter plot is that every white-circle Mega-Earth candidate lies on the active side, while the gray-circle population of ordinary rocky and sub-Neptune-mass planets spans inactive through quiet. The four Mega-Earths the authors identify, WASP-84 c, TOI-1347 b, TOI-2322 c, and HD 63433 b, all orbit stars with log R prime HK above negative four point seven five. Three additional planets sit close to the Mega-Earth density regime: GJ 523 b, TOI-815 c, and HD 18599 b. All seven orbit active stars. The probability of that alignment by chance, given how many inactive and quiet-host rocky systems exist in the same sample, comes out below one percent. The authors also note that a previously Mega-Earth-classified world, HD 119130 b, was already re-measured by another group and found to have an inflated mass caused by constructive interference between the planet’s orbital signal and the star’s rotational modulation.

The mechanism behind the contamination is well known but tricky to remove. Starspots and the brighter magnetic regions called plages move across the disk of a rotating star and produce Doppler shifts in the integrated starlight that are indistinguishable, in many pipelines, from the reflex motion of a planet. Starspots suppress local convection and produce false radial-velocity signals at the star’s rotation period. Plages do the same at somewhat different amplitudes. When a planet’s orbital period happens to land near an integer or half-integer multiple of the star’s rotation period, the two signals can constructively interfere and inflate the inferred planet mass by a factor of two or more. That is the situation for several of the candidate Mega-Earth hosts, whose TESS light curves show clean rotational modulation at periods from roughly four to fourteen days. The full radial-velocity datasets that yielded the published masses came from public archives including the NASA Exoplanet Archive, which compiled discovery spectra from HARPS, PFS, and TESS follow-up campaigns. Gaussian-process regression, the tool most often used to handle stellar activity in radial-velocity fits, is only as good as its kernel choices and its priors. When the kernel is too smooth, the process absorbs genuine planetary motion as activity noise. When it is too wiggly, activity noise leaks into the planetary model and inflates the mass.

What the paper does not do is rule out rocky planets above ten Earth masses on theoretical grounds. The runaway gas accretion argument sets ten Earth masses as the threshold above which a core cannot avoid grabbing gas during formation, but it is a threshold, not a wall. Collisional mantle stripping after disk dispersal or photoevaporation of a once-larger planet’s envelope can, in principle, leave a bare rocky remnant. The authors are explicit that those pathways remain possible, just unproven. The Mega-Earth label, in their framing, has been applied to planets whose mass measurements cannot yet distinguish between a real ultra-dense rocky world and a noisy radial-velocity fit around an active star. Re-observing these systems with ESPRESSO on the Very Large Telescope, with HARPS on the TESS-Keck Survey infrastructure, or with NIRPS at La Silla, all of which have the spectral resolution to see activity-induced line-profile variations directly, would settle the question. Several of the candidate Mega-Earths have already been on those queues. The paper, which appeared on the arXiv preprint server on 8 October 2026 and is now in the resubmission cycle for The Astrophysical Journal Letters, lands in a catalog of corrections that have repeatedly eaten specific claimed populations of extreme exoplanets. Stellar contamination has eaten mini-Neptunes hiding inside hot-Jupiter mass measurements, cold Jupiters past ice lines that were artifacts of magnetic cycles, and small-radius planets that turned out to be diluted binaries. Each time, the underlying detection method is sound for inactive host stars and quietly wrong for active ones. Adding Mega-Earths to that list is, in a way, an expected move. The catalog of rocky worlds stays grounded. The Ultra-Massive Rocky Planet threshold, if it exists at all, moves somewhere more difficult to measure from the ground, perhaps requiring JWST transmission spectroscopy of these same systems to constrain atmospheric mass, or years of radial-velocity monitoring as activity cycles rotate through minimum phases. For now the simple chart is enough: a horizontal line at ten Earth masses, with seven suspected outliers sitting on the active side and zero on the quiet side. Pattern recognition cut the question in half.


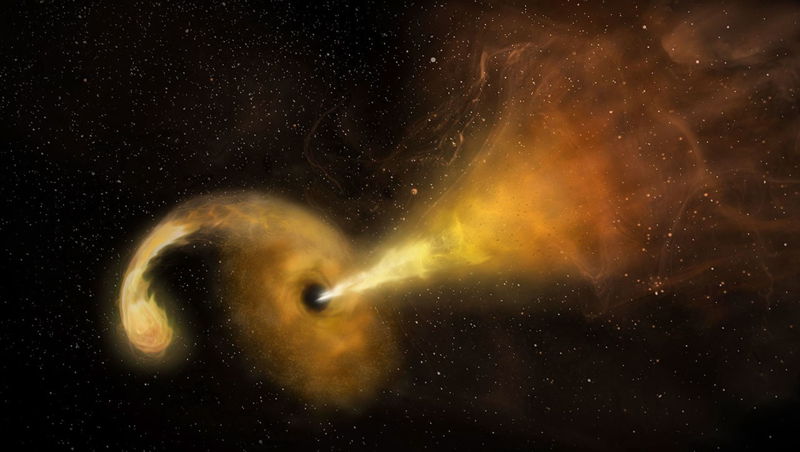
Artist's concept of a black hole pulling apart a star, with glowing debris curling into a disk and a bright jet streaming to the right


A flare appeared in November 2025 near the outer edge of a galaxy in Cetus. It shone in ultraviolet light with roughly the output of 10 billion Suns and, for a few months, outshone the galaxy itself. That sounds like the sort of event astronomers would notice immediately. The awkward part was its address.

The flare sat more than 30,000 light-years from the galaxy’s center, nowhere near the central supermassive black hole that should have been capable of producing it. Follow-up observations nevertheless showed the signature of a star pulled apart by a massive black hole. The event, named TDE 2025abcr, had exposed an otherwise dark object wandering through the galactic outskirts.

The NASA account of the discovery describes it as the most distant-from-center example of its kind. More important than the record is how it was found: a search deliberately stopped assuming that a galaxy’s biggest black holes must stay in the middle.

Artist’s concept of a tidal disruption event. Credit: NRAO/AUI/NSF/NASA. NASA JPL image page.

Supermassive black holes are usually found through their effects rather than by seeing the objects themselves. At a galaxy’s center, the surrounding stars and gas provide several ways to measure an unseen mass. Far from the nucleus, a quiet black hole can disappear against the sky. It may reveal itself only when matter falls in.

Tidal disruption events offer that brief illumination. NASA estimates that one occurs in a given galaxy about once every 100,000 years, while surveys find roughly 30 across the sky each year. Until recently, optical searches concentrated on galactic nuclei. That was a reasonable filter because known supermassive black holes lived there, but it also built the expected answer into the search.

TDE 2025abcr shows what happens when that positional filter is relaxed. The accepted paper and open preprint calls it the first optical tidal disruption event discovered in the outskirts of a host galaxy. Its inferred black hole mass is about 10^6.09 solar masses, far below the roughly 10^8.82-solar-mass black hole estimated at the host’s center. One galaxy may therefore contain two massive black holes with very different histories and locations.

Finding more such objects would put numbers on a poorly measured population. Wandering black holes preserve evidence of galaxy mergers, stripped dwarf galaxies, and gravitational encounters among black holes. They also test whether catalogs built around bright galactic centers have missed a class of massive objects hiding in plain sight.

The Zwicky Transient Facility, or ZTF, first flagged the brightening in November 2025. ZTF surveys the northern sky from Palomar Observatory and produces an enormous stream of changing points. According to NASA, about half a million flashes are detected each night. A custom version of the machine-learning classifier tdescore examined that stream without requiring candidates to coincide with a galaxy nucleus. It recognized the light curve of TDE 2025abcr even though the source was well off-center.

That initial match was only a prompt for more observing. The galaxy WISEA J014656.04-152214.7 lies about 750 million light-years away. The transient was separated from its nucleus by 9.5 arcseconds, corresponding to a projected distance of 9.3 kiloparsecs. Spectra from ground-based telescopes, including the SOAR telescope in Chile, showed hydrogen and helium emission associated with a tidal disruption event. NASA’s Neil Gehrels Swift Observatory then supplied ultraviolet and X-ray measurements unavailable from the ground. Swift’s ultraviolet telescope measured a temperature near 30,000 degrees Celsius.

Together, the light curve, spectrum, temperature, and location ruled out more ordinary explanations. The researchers classified the source as a hydrogen-and-helium tidal disruption event. Scaling relations between peak luminosity and black hole mass gave an estimate of 10^6.09 solar masses, with an uncertainty of 0.53 dex. That uncertainty is broad, but the result still separates the wandering object from the much heavier black hole expected in the main galaxy’s nucleus.

How did it get there? The team offers two possibilities. In one, several galaxies merged and the interaction among their central black holes ejected the lightest one toward the outskirts. In the other, the black hole remains at the center of a faint dwarf galaxy now being stripped during a minor merger. The dwarf’s stars may be too dim or too dispersed to stand out in current images.

Those explanations can be tested. Deep late-time imaging, after the flare fades, could expose a faint stellar system around the black hole. More off-nuclear events would reveal whether large offsets favor one merger history over another. The paper places the rate of events more than 3 kiloparsecs from a nucleus below 10 percent of the nuclear TDE rate, while predicting that the Vera C. Rubin Observatory could find dozens with resolvable offsets each year.

The timing has an engineering wrinkle. Swift’s pointed observations are temporarily suspended while the mission awaits an orbit boost. Its primary mission ran from 2004 to 2006, yet it has continued watching the changing sky for more than two decades. Rubin can supply a much larger optical sample, and NASA’s Roman telescope can extend the search to greater distances. Swift, once normal operations resume, remains useful for the ultraviolet and X-ray follow-up that turns an unusual point of light into a physical diagnosis.

A tidal disruption begins with a gradient. Gravity is stronger on the side of a star facing a black hole than on the far side. If the star passes close enough, that difference overwhelms the star’s self-gravity. The star stretches, breaks apart, and becomes a stream of gas. As the NASA tidal disruption explainer shows, some debris escapes while some returns, collides, heats up, and gathers around the black hole.

The rough boundary is the tidal radius, often written as r_t approximately equal to R_star times (M_BH/M_star)^(1/3). A larger star is disrupted farther out. A more massive black hole also raises the tidal radius, but only with the cube root of its mass. The event horizon, by contrast, grows directly with black hole mass. This difference explains why a million-solar-mass black hole can tear a Sun-like star apart outside its horizon, where the hot debris remains visible.

The flare is not a photograph of the black hole. It is radiation from gas responding to extreme gravity. Ultraviolet temperature constrains the hot emitting region. Spectral lines identify elements and track changing velocities. X-rays probe hotter material closer to the compact object. None of these measurements alone settles the case; their agreement does.

The classifier solves a different problem. A survey camera records real transients alongside variable stars, supernovae, moving objects, and instrumental artifacts. A model trained on known tidal disruption light curves can rank candidates, but a model trained only on nuclear examples may learn location as a shortcut. The off-nuclear version of tdescore removed that shortcut. Its success is a clean lesson in survey design: changing a selection rule can reveal objects the telescope had already become capable of seeing.

TDE 2025abcr did not make a wandering black hole appear. It made one observable for a few months. A star supplied the fuel, ZTF caught the changing light, and Swift helped establish what produced it. The result is a black hole of roughly a million solar masses projected 9.3 kiloparsecs from the center of a massive galaxy.

The remaining question is whether this object was kicked out of a galactic nucleus or still occupies the fading core of a stripped dwarf. Late-time imaging may answer that for this system. Rubin’s larger alert stream can answer the population question by finding enough examples to compare.

The useful change was modest: researchers searched outside the place where theory and habit told them to look. If Rubin finds the predicted dozens of resolvable off-center events each year, TDE 2025abcr will become less of an oddity and more of a map marker for a hidden population moving through galactic outskirts.


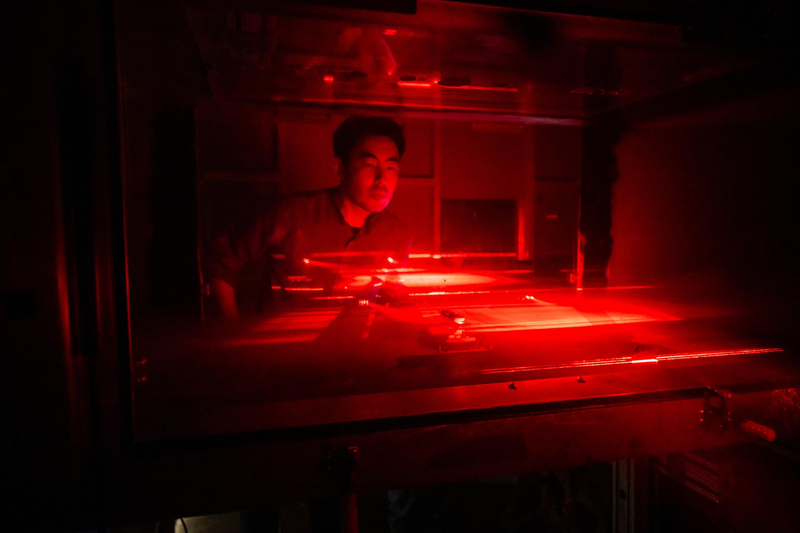
Engineer Chullhee (Chace) Cho performing wind tunnel testing on a hardware component of the Deep Atmosphere Venus Investigation of Noble gases, Chemistry, and Imaging (DAVINCI) descent sphere at NASA Goddard, August 5, 2026.


For an hour, the ceramic-lined furnace at Rex Heat Treat in Bedford, Pennsylvania, climbed from room temperature to 465 degrees Celsius. The vessel inside was titanium, about a meter across, the size of an exercise ball. The DAVINCI team put it through that profile six times. Six times it came out the same shape it went in. Each run mimicked the way the probe will heat up over the fifty-five to sixty minutes of its one-way trip through the atmosphere of Venus, a place whose surface sits at 740 kelvin and a pressure equivalent to nine hundred meters of seawater. The fact that the engineering development unit survived its own near-death preview is the news from NASA Goddard this week, and the reason scientists who study Venus are starting to plan around a real measurement instead of a hypothesis (NASA Science, 24 September 2026).

What DAVINCI is after is older than the program. Venus and Earth started as near twins, similar size, similar rock, similar distance from a young Sun. Today one is a temperate water world and the other is a planet whose surface would crush a submarine and whose clouds rain sulfuric acid. The question of when and how that divergence happened, and whether Venus ever had liquid oceans, has been the central question of inner-Solar-System science for two generations. The Pioneer Venus Multiprobe dropped four small entry probes in 1978, and Vega 2 carried the Soviet Vega program’s last successful lander to the surface in 1984. Venera 14 returned the only close-up images of Venus’s surface, and they are forty-four years old. Every chemical measurement below forty kilometers of altitude that exists today was made by instruments that fit inside a Soviet-era school bus and ran for a few minutes before the heat killed them (Garvin et al., 2022, Planetary Science Journal 3, 117).

The mission NASA picked to fill that gap is named, improbably, after Leonardo. Deep Atmosphere Venus Investigation of Noble gases, Chemistry, and Imaging started as a Discovery proposal in 2015, lost to Lucy and Psyche, came back as DAVINCI+ in 2019, and was selected in June 2021 alongside its companion orbiter VERITAS. The flight system is two pieces: a Lockheed Martin carrier that will perform two flybys of Venus to map cloud motions and surface composition, and a descent probe that will be released about two days before atmospheric entry. The current schedule puts launch in December 2030, atmospheric entry in 2034 or 2035, and a one-hour descent that ends at Alpha Regio, a tessera, a piece of the old continent-like crust that may hold the chemistry of whatever ocean Venus once had (NASA, Discovery Program selection, 2 June 2021; Wikipedia, DAVINCI).

The August furnace tests at Rex Heat Treat are about the inside of the probe, not the heat shield. The DAVINCI descent sphere, an oblate titanium pressure vessel about 0.98 meters by 0.85 meters and roughly two hundred kilograms, is what carries the science instruments down. The carbon-phenolic aeroshell that surrounds it for entry, a 2.24-meter cone designed to absorb peak heating above ten thousand degrees Celsius during the minutes of peak dynamic pressure, burns away and falls off below the cloud layer. After that the descent sphere is on its own, passively cooled by a layered thermal-soak design and by the buoyancy of the lower atmosphere, broadcasting measurements for an hour through a relay on the carrier spacecraft nine thousand kilometers overhead. The team put more than a hundred thermal sensors on instrument simulators inside the development unit and watched them through every cycle. Kristen Brown, the probe manager at Goddard, called the system a huge engineering challenge because the instruments have to be kept alive while the probe deliberately lets hot Venus gas in through inlet ports to feed the mass spectrometer and tunable laser spectrometer. The tests verified that the layered insulation, the inlet geometry, and the internal layout can do both at once (NASA Science, 24 September 2026; Garvin et al., 2022).

The science payload is the reason anyone cares about an hour of in-situ measurement. DAVINCI carries five primary instruments inside the descent sphere plus a context imager. The Venus Mass Spectrometer and the Venus Tunable Laser Spectrometer are tuned to read the ratios of noble gases, sulfur species, and water-related molecules with enough precision to test the leading hypothesis for Venus’s history. That hypothesis goes like this: early Venus was hot but had water; the water dissociated in the upper atmosphere, the hydrogen escaped to space, and a runaway greenhouse locked the planet into its present state. If the mass spec finds a primordial argon and neon inventory that matches a wet early Venus, the runaway model survives; if the ratios look like the mantle of a dry planet, the story changes. The Venus Descent Imager and the Venus Imaging System for Observational Reconnaissance, riding on the descent sphere and the carrier respectively, will produce the first sub-hundred-meter pixel-scale images of tessera terrain and the highest-resolution images of the surface since the Venera landers. Below the clouds the descent sphere’s pressure rises to roughly ninety-two bar and the temperature pins to four hundred and sixty-seven degrees Celsius, conditions the instruments are rated for, but only if the thermal design lets them keep measuring all the way down (Garvin et al., 2022; Wikipedia, Atmosphere of Venus).

Two engineering choices make that possible. First, the descent sphere is hermetically sealed: every gas path between the hot outside and the cold inside is broken by a long, narrow inlet that lets flow in without letting heat conduct in. Second, the relay link to the carrier operates at X-band through a high-gain antenna on the back shell, with the carrier recording the descent and playing it back to Earth later. Together the choices turn the descent sphere into something like a deep-ocean submersible, a thin titanium shell, internally cold, externally roasting, surviving because the thermal mass of the vessel is large compared to the heat leaking in through the instrument feed-throughs. The descent profile is also gentler than a Mars entry. Venus’s thick atmosphere is itself the brake, dropping entry velocity to about thirty meters per second by the time the parachute stage jettisons and the sphere free-falls the last thirty kilometers of cloudy, acidic air to the surface.

The test campaign is the second of two major engineering milestones the team targeted for 2026. The first, in June at Crater Island in Utah, was a VADIX helicopter demonstration of the descent imager concept under realistic lighting and dust; the second, just completed in Bedford, was the thermal survival test of the descent sphere itself. The team now turns to final design and fabrication, with a third milestone likely in 2027 covering full-up entry-vehicle qualification, then integration with the carrier and launch from Cape Canaveral in the December 2030 window. If the schedule holds, the first new measurements from below Venus’s cloud base in fifty years will arrive on Earth in the spring of 2035. They will not settle the runaway-greenhouse question on their own, but they will give planetary scientists a starting point that no present model of Venus has, measured chemistry, measured wind, measured surface composition, at every altitude from seventy kilometers down. That dataset, not the next spectacular image, is what will change the science.


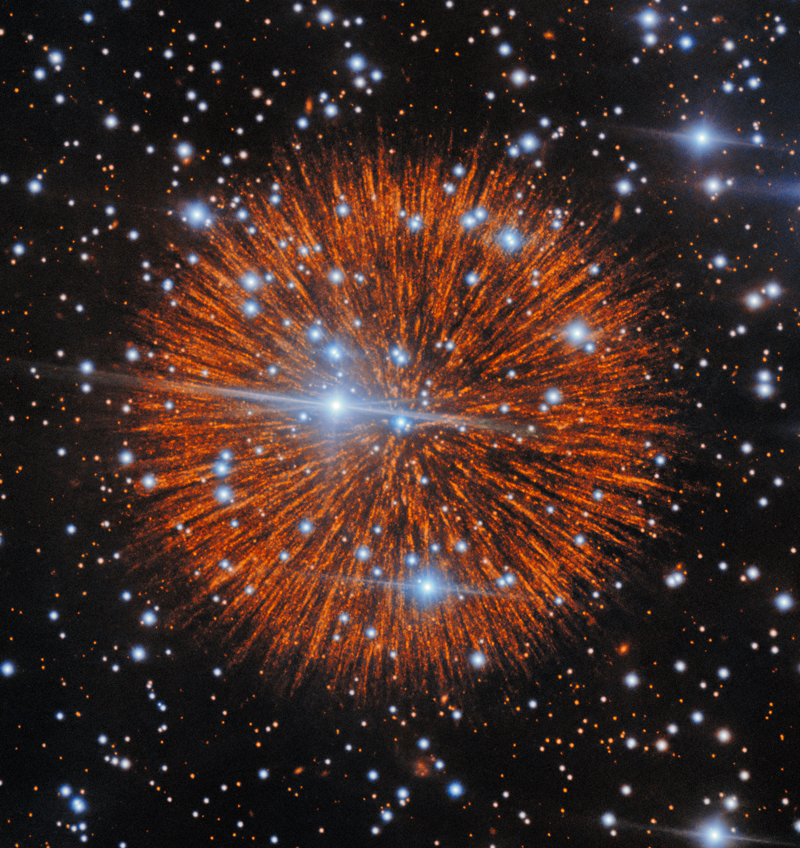
Gemini North narrowband image of the supernova remnant Pa 30, captured with GMOS in [S II] and [O III] filters showing the orange radial filaments resolved into cascades of small knots around the bright blue central star, IRAS 00500+6713.


In the constellation Cassiopeia there is a small, oddly symmetrical puff of gas that, on the best nights, looks like a firework frozen at the instant it bursts. Astronomers call it Pa 30, and it is the leading candidate for the remains of a supernova that flared over China, Japan, and the medieval Middle East in the summer of 1181. New narrowband imaging from the Gemini North telescope on Maunakea, published on 6 October 2026 in The Astrophysical Journal, shows that Pa 30’s famous radial filaments are not smooth streamers at all. They are chains of small, evenly spaced knots of gas, lined up like beads on a string along every spoke of the nebula, and the new observations resolve about ten times more of them than any previous study had seen (Cunningham et al. 2026 ApJ; NOIRLab press release). That changes what astronomers thought they were looking at, and it gives the field a way to measure how the ejecta of an 850-year-old failed thermonuclear supernova actually broke up as it ran outward.

Pa 30 was nothing more than an entry in a star catalogue until 2013, when an American amateur astronomer named Dana Patchick, sorting through Wide-field Infrared Survey Explorer data for a citizen-science hunt for planetary nebulae, picked out a previously unrecognized infrared source he labelled “Pa 30” (Sci.News). Follow-up imaging on the 2.1-metre telescope at Kitt Peak and then the 2.4-metre Hiltner telescope revealed a faint nebula threaded by remarkably straight radial filaments, almost perfectly circular in outline, with a hot blue star at the centre (Cunningham et al. 2026 arXiv:2610.06424). The reason that matters is that a normal Type Ia supernova is the catastrophic disruption of a white dwarf that has been pushed over the Chandrasekhar mass limit by accretion from a companion. The white dwarf is destroyed completely; no central star survives; the expanding debris forms a roughly spherical shell with no heartbeat. Pa 30 has a star at its centre that is still very much alive and very hot. Spectra put its surface temperature at roughly 200,000 kelvin and its stellar wind at about 16,000 kilometres per second (Cunningham et al. 2026 ApJ). That is the calling card of the much rarer Type Iax class, a family of faint thermonuclear explosions in which the white dwarf survives the blast, sometimes barely. Only a handful of Type Iax events have been catalogued, and Pa 30 is the only confirmed one whose remnant we can resolve in detail.

The 1181 identification is what turns Pa 30 from a curiosity into a calibration point. Eight separate texts record that a “guest star” appeared in Cassiopeia between 4 and 6 August 1181 and remained visible to the naked eye for 185 days. For decades the historical remnant was confused with the radio pulsar wind nebula 3C 58, but 3C 58 turned out to be too old to match. In 2021, Andreas Ritter and a team at Queen’s University Belfast identified Pa 30, with its associated central star (which they dubbed Parker’s Star after the Hong Kong astronomer Quentin Parker), as the much more plausible remnant of the 1181 event (Sci.News). The geometry fit: an age of roughly 850 years, a position consistent with the historical records, and an ejecta velocity near 1,000 kilometres per second. The 2026 Gemini North campaign, led by Tim Cunningham, then at the Center for Astrophysics at Harvard and Smithsonian and now at the University of Warwick, with Ilaria Caiazzo at the Institute of Science and Technology Austria, John Raymond, and Scott Kenyon, set out to see what was hidden in the filaments at the highest resolution available from the ground. They used the Gemini Multi-Object Spectrograph (GMOS) in narrowband filters tuned to the [S II] and [O III] emission lines of low-ionization gas, and took very long exposures to pull faint substructure out of the background. Each radial spoke resolved into a string of small bright knots separated by fainter gaps, marching outward from near the central object, and the [O III] imaging produced the first confirmation that the diffuse oxygen emission in the nebula is co-spatial with the sulphur filaments rather than being a separate, smoother component (Cunningham et al. 2026 ApJ).

The other headline from the same campaign is a quiet one: the centre of the nebula sits almost exactly where the central star sits. Surviving supernova remnants are expected to recoil, and models of double-white-dwarf mergers predict a kick of anywhere from a few to several hundred kilometres per second for whatever survives the blast. Cunningham and colleagues used their imaging to pin the geometric centre of Pa 30 with a Monte Carlo Markov chain and compared it to the position of the central star, concluding that any transverse kick must be under about 100 kilometres per second at the 3-sigma level (Cunningham et al. 2026 arXiv:2610.06424). That is unusually small for a merger survivor. It tightens the constraint on how energetic and asymmetric the explosion could have been, and it adds another piece of evidence that the 1181 event really was a Type Iax: a comparatively gentle thermonuclear runaway in which much of the white dwarf’s mass was ejected but a substantial core remained intact, sitting nearly where it began. What the knots themselves are made of is the open question the new data sets up. If the filaments were once smooth, their beaded structure implies either that the ejecta itself was clumpy on small scales when it was launched, or that the interstellar or circumstellar material the ejecta ran into was inhomogeneous enough to break the flow up into discrete radiative-cooling zones. The characteristic spacing Cunningham’s team measures, around 10^16 centimetres per knot, is roughly the size scale that Rayleigh-Taylor fingers in supernova remnants are expected to produce, and strings of similar knot cascades can be seen in the core-collapse remnant Cassiopeia A, although without Pa 30’s strict radial geometry (Cunningham et al. 2026 ApJ).

Follow-up is already in the queue. STScI program 18082, accepted in June 2026, will pair the Gemini narrowband imaging with a 16-orbit Hubble WFC3 campaign in [S II] to map Pa 30’s filaments across their full length, and JWST program 9111, in parallel, is using MIRI’s integral-field unit to obtain mid-infrared spectra of six bright filaments to measure their dust content and cooling balance. The combination should let the team tie the optical knots to specific ejecta species (oxygen, neon, sulphur) and to the dust that survived the explosion, and to test whether the beading is consistent with a clumpy progenitor or a clumpy medium. There is also a separate, very recent coda to the Pa 30 story: a separate team announced in early October 2026 that the central star, IRAS 00500+6713, has a measurable green tint in its visible-light spectrum, the first white dwarf to show one, painting it with the same mechanism that gives oxygen-rich Wolf-Rayet stars their colour (NASA APOD 2026 October 7). The 1181 supernova is the only historical Milky Way Type Ia-class event whose remnant we can resolve and the only Type Iax remnant at all, and with knots now measurable one by one, a quiet central star that did not fly away, and a Hubble and JWST follow-up in flight, it is the closest thing the field has to a benchmark for what a failed-but-not-quite thermonuclear supernova looks like 850 years after it happened.