OrbitalHub

Where curiosity reaches escape velocity.

Domain is for sale. $50,000,000.00 USD. Direct any inquiries to contact@orbitalhub.com.

Archive for the Astronomy category


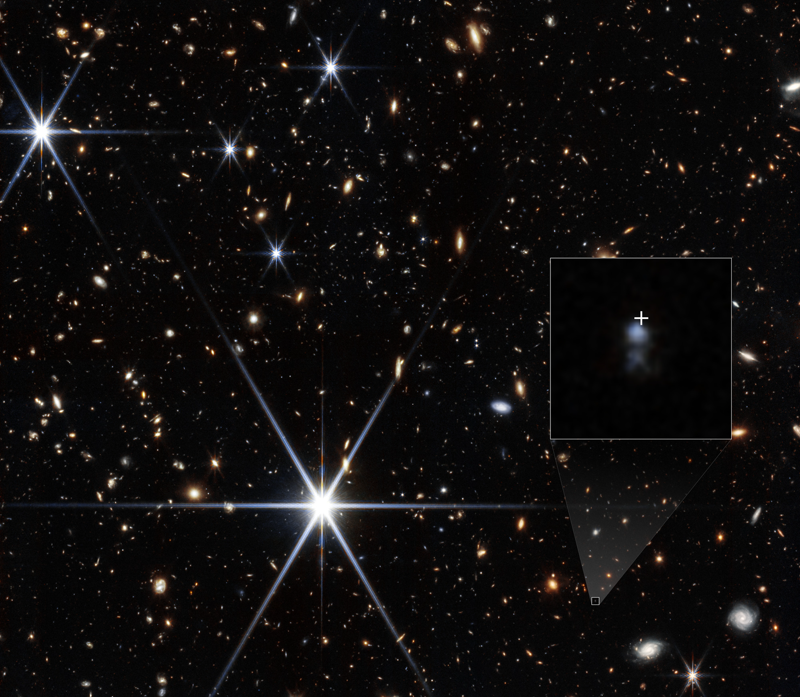
A composite NIRCam image centred on the host galaxy of FRB 20240304B in the constellation Virgo at right ascension 12:11:59 and declination +11:48:46, showing a faint blue dwarf galaxy inside a small inset box with a white cross marking the exact radio position of the burst, set against a crowded field of more distant galaxies and brighter foreground stars with diffraction spikes. Image: NASA Webb release assets at science.nasa.gov/asset/webb/frb-20240304b-nircam-image, credit NASA, ESA, CSA, STScI, Themiya Nanayakkara (USYD); image processing Joseph DePasquale (STScI).


On March 4, 2024, a 64-dish radio array in the South African Karoo picked up a flash that lasted less than a blink. The pulse, named FRB 20240304B and reported on the NASA Webb mission page, arrived at the MeerKAT telescope at 00:50:12.567 UTC with a dispersion measure of 2458 pc cm^-3, a value so high that the signal had clearly travelled through a vast column of ionised gas before reaching Earth. Localising it to within arc-second precision on the sky took another thirty seconds of offline processing. Doing anything useful with that position took the James Webb Space Telescope. In the October 8, 2026 issue of Science, the team led by Manisha Caleb and Themiya Nanayakkara at the University of Sydney report that Webb pinned the burst to a faint dwarf galaxy at a spectroscopic redshift of 2.148 plus or minus 0.001, a record that more than doubles the redshift reach of any previously localised fast radio burst.

The result matters because fast radio bursts, millisecond flashes of coherent radio emission whose origins are still debated, have until now been almost entirely local phenomena by cosmic standards. Of roughly one hundred FRBs with redshifts measured from their host galaxies, the great majority sit at redshifts below 0.5. Pushing that frontier to z = 2.148 means the team can now read the line-of-sight through roughly eighty percent of cosmic history in a single burst. The Macquart relation, which converts an FRB’s dispersion measure into an integrated electron-density estimate along the line of sight, has been constrained almost entirely by nearby events. A single very distant source stretches the calibration into the regime where cosmological ionised gas dominates the budget and where the missing baryons problem, once a curiosity of low-redshift surveys, becomes directly measurable.

To find a host, the team first searched public surveys and ran deep optical and near-infrared follow-up at the Keck and MMT observatories. The host stayed invisible down to five-sigma limiting magnitudes of R = 26.24 and J = 23.38 in the AB system. A faint, distant dwarf at redshift two is dim enough that ground-based eight- and ten-metre telescopes cannot pick it out of the foreground, which is exactly the regime where Webb’s cold infrared sensitivity overwhelms everything else in the astronomer toolkit. The team was awarded Director’s Discretionary Time on the observatory (programme 6779) and turned the Near Infrared Camera onto the field in the F200W and F322W2 filters on 26 December 2024. A candidate host appeared at an offset of about 0.3 arcseconds from the radio position. The Probabilistic Association of Transients to their Hosts (PATH) formalism gave a 97.5 percent posterior probability that the candidate is the real counterpart, with only a 2.4 percent residual chance of an unseen alternative.

The clincher was spectroscopy. Webb’s Near Infrared Spectrograph Integral Field Spectrograph caught strong H-alpha and [O III] lambda 5007 emission lines from the candidate, two of the canonical redshift markers at this cosmic epoch. The measured redshift of 2.148, defined to three decimal places, places the burst firmly in what cosmologists call cosmic noon, the era between roughly two and four billion years after the Big Bang when the cosmic star-formation rate reached its peak. MeerKAT’s dispersion measure had predicted a redshift of 2.8 with a 1.6 to 3.4 range, so the spectroscopic answer was consistent with the radio estimate but on the lower side of its confidence range.

The host galaxy itself turned out to be the bigger surprise. Most FRB host galaxies discovered to date are massive, dusty, vigorously star-forming systems. This host is none of those things. It has a stellar mass of about ten million solar masses, around a thousand times less than the team’s prior expectation, and a star-formation rate of about 0.2 solar masses per year. Its gas-phase metallicity is only ten to twenty percent of solar. By contrast, the FRB with the most well-studied host to date, FRB 20121102A, sits in a galaxy about ten times more luminous. The galaxy is, in the words of lead author Manisha Caleb, “a little dwarf galaxy, although it was actively forming stars.”

That mismatch is where the science gets sharp. There are two leading classes of FRB progenitor model in the current literature. The first invokes the merger of two neutron stars, compact objects whose orbit shrinks over billions of years through gravitational-wave emission until they collide, an end-stage process that should preferentially occur in older galaxies with evolved stellar populations. The second invokes young magnetars, the highly magnetised neutron stars left behind when a massive star ends its life in a supernova, that can power a fast radio burst through starquake-like activity within only millions of years of their birth. A dwarf host at cosmic noon with the metallicity of a primordial starburst fits the second scenario cleanly. The Milky Way’s own Galactic magnetar SGR J1935+2154, located only about ten kiloparsecs away, has produced FRB-like bursts in modern observations, and the metallicity of the new host is in the range where the initial mass function favours the formation of the very massive progenitors that become magnetars.

The team concludes that a neutron-star merger is unlikely to be the source of FRB 20240304B. The energetics back this up: the isotropic-equivalent energy of the burst is around ten to the forty-one erg, on the high end of what is reported for non-repeating FRBs but consistent with the magnetar picture.

FRBs are not just telephone signals from exotic objects, they are probes of everything their light passes through. Each burst carries an imprint of every free-electron it encountered between source and observer, which means a single very distant FRB can trace the cosmic web of ionised matter, the diffuse intergalactic medium, the circumgalactic halos of intervening galaxy clusters, and the warm interstellar medium of the Milky Way itself in one observation. The team’s dispersion-measure analysis for FRB 20240304B found the imprint of two structures along the sightline: an intervening galaxy group at a redshift of 0.3, about 3.5 billion light-years from Earth, and the nearby Virgo Cluster, which lies about 54 million light-years away in the constellation that gives the burst’s host its other nickname. Splitting the dispersion-measure budget across these contributions is what calibrates the Macquart relation across most of cosmic time.

The immediate next step is more of the same. The team estimates that MeerKAT can detect and localise several FRBs per year at redshifts above one, and the upcoming SKA-Mid array, with its order-of-magnitude jump in sensitivity, should push that rate higher. Each new burst becomes a Webb target for spectroscopy, and each new spectrum refines the picture of where and how these energetic flares arise. Whether most FRBs turn out to be magnetars, mergers, or some mixture is still an open question, but the new host galaxy, small, metal-poor, vigorously star-forming, and viewed as it was ten billion years ago, is the kind of place where a magnetar should be living. That is enough, for now, to weight the debate.
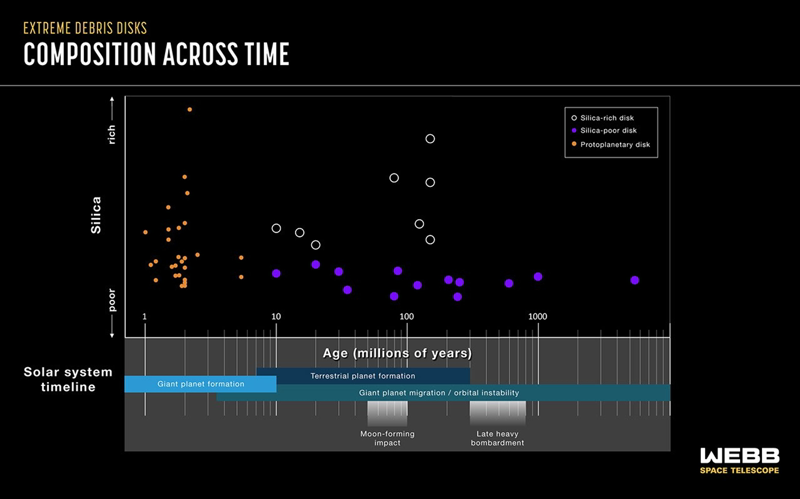


A scatter plot of disk chemistry versus stellar age: silica content from poor to rich on the y-axis and age from 1 to several thousand million years on a logarithmic x-axis, with black open circles marking silica-rich disks, purple filled circles marking silica-poor disks, and orange filled circles marking protoplanetary disks. A solar-system timeline below shows blue bands for giant planet formation, terrestrial planet formation, and giant planet migration, with gray bands marking the Moon-forming impact and the Late Heavy Bombardment. STScI image, derived from Su et al. 2026.


The figure every planetary scientist carries in their head is the Moon-forming impact: a Mars-sized body called Theia slamming into the infant Earth roughly 100 million years after the Sun was born, vaporising rock, blasting a disk of debris into orbit, and leaving behind a moon that still shows the chemical scar of that single catastrophic day. The trouble is that this picture has lived mostly inside models and inside Apollo-era geochemistry, with no direct way to watch an equivalent event happen elsewhere. NASA’s James Webb Space Telescope has now produced the largest mid-infrared sample yet of extreme debris disks, the rare young stellar systems whose warm dust tells astronomers that something inside them has just been smashed to pieces. The team, led by Kate Su at the Space Science Institute in Boulder, Colorado, reports that the sample splits cleanly into two populations whose separation lines up, almost uncannily, with the timing of the impact that built our Moon.

These collisions matter because they are how rocky planets finish being built. A young star starts life wrapped in a gas-rich protoplanetary disk where dust accretes into planetary seeds, then spends the next few hundred million years refining those seeds into fully grown worlds. By the time the gas is gone, what is left is a colder, thinner debris disk populated by asteroid and comet-like bodies. Most of those debris disks are quiet, with low infrared brightness and dust grains sitting at their original sizes, and a planetary scientist would describe such a system as a settled, post-construction environment. A small fraction are not quiet, and these are the extreme debris disks. They have unusually large amounts of warm dust close to the star, in the region where rocky planets orbit our Sun, and the only way to make that much warm dust is to start with recently shattered, vaporised, or melted rock. Estimates from Spitzer and early Webb data put the fraction at roughly one percent of young stars showing observable signs of this phase, a low number than what theorists expect from models of late-stage accretion, and possibly including our own solar system during the brief epoch when Earth was finishing its assembly.

For Su’s team the breakthrough was less about finding the disks and more about characterising them. Webb’s Mid-Infrared Instrument, with its 6.5-metre primary mirror sitting in the cold L2 environment, can read the chemical fingerprints of silicate minerals in the dust at wavelengths no previous instrument had enough sensitivity to pursue. Some of the disks are silica-rich, with spectra full of features from glassy, high-temperature minerals like the volcanic glass obsidian on Earth. Some are silica-poor, dominated instead by forsterite, the same mineral that gives some Hawaiian beaches their green tint. According to Su’s reading of the mineral record, a silica-rich disk is the sign of a high-energy impact between Mars-sized bodies, where collisions vaporise enough rock to leave behind freshly quenched silica glass. A silica-poor disk comes from gentler, lower-energy collisions between Moon-sized bodies, where the debris is just shattered rock rather than vapor. The geometry of the collision, not just its existence, shows up in the infrared spectrum.

The ages of the disks fall in line with their chemistry. Of the 21 disks the team compiled (five drawn from retired Spitzer archives and 16 from new Webb observations), about one third are silica-rich, and they appear only around stars younger than 300 million years. The remaining two thirds are silica-poor, persist across a much wider age range, and show larger swings in infrared brightness. The age boundary is doing real work. Silica-rich impacts, the team argues, are a young-system phenomenon, products of the chaotic last stage of terrestrial planet assembly. Once a system has settled into a stable architecture, the big bodies stop crashing into each other and only the smaller, lower-energy rubble collisions continue. This is what makes the boundary line up with the Moon-forming epoch. Geochemists place the giant impact at roughly 100 million years after the Sun formed, deep inside the silica-rich range. If the Sun went through its own extreme debris disk phase, the chemistry of its dust would have to be silica-rich.

The solar-system timeline beyond the Moon-forming impact also has a place in the picture. Su’s team points to the Late Heavy Bombardment as a possible silica-poor phase for the Sun, a window roughly 600 to 800 million years after formation when the giant planets migrated far enough to destabilise smaller orbits and trigger fresh cratering across the inner system. The age fits the silica-poor range, where the disks are still appearing a billion years into stellar life, and the mechanism fits the irregular brightness swings the team measures, since orbital instability produces bursts of dust rather than steady amounts. Both the Moon-forming phase and the Late Heavy Bombardment phase are inferred events that happened here, and both have plausible counterparts in the catalogue Su has now built. The chart accompanying the paper makes the alignment visible: protoplanetary disks fill the first ten million years, silica-rich disks take over between roughly ten and one hundred million years, and silica-poor disks continue to show up across the full timeline to several billion years.

There is an honest gap in the picture. Of the 21 disks, only three sit in the silica-poor, old-system range that the team needs to confirm the Late Heavy Bombardment analogy. As coauthor Attila Moor of Konkoly Observatory put it, three disks are not enough to test the hypothesis, and Webb time over the next several cycles will determine whether older silica-poor systems are simply rare or whether the picture needs to be redrawn. The current catalogue is enough to show that Mars-sized collisions leave a recognisable chemical fingerprint in the dust, that the fingerprint disappears after a few hundred million years, and that the disappearance happens for a reason that the Solar System’s own record independently supports.

For planetary science the lesson is operational rather than philosophical. When Su’s team says they have used Webb to bring together the big picture of how rocky planets formed and how giant planets evolved, what they mean is that infrared spectra can now resolve the difference between two collision regimes that previously looked the same in dust-mass measurements. That kind of resolution opens a path to testing formation theories on a per-system basis rather than inferring them only from our own neighbourhood. Earth is no longer the only place we can read the chemistry of giant impacts. There are now twenty-one other laboratories in the catalogue, with more on the way, and the odds that one of them catches a collision in progress just got measurably better.


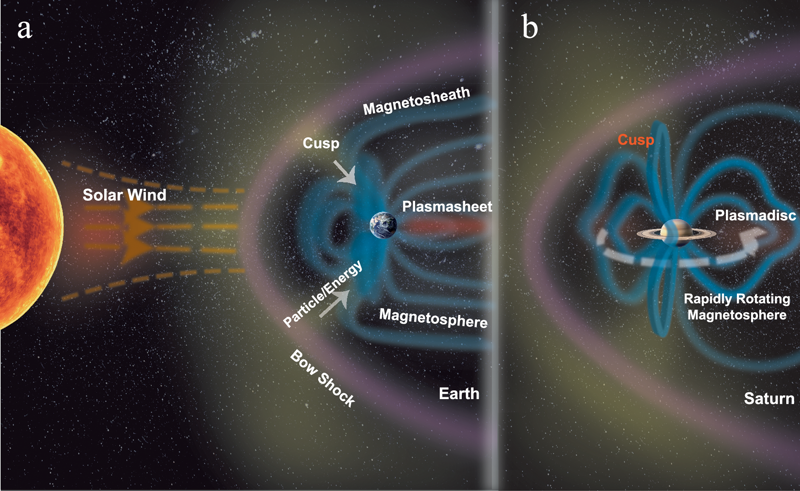
Schematic of Earth's (left) and Saturn's (right) magnetospheres, with the solar wind, bow shock, magnetosheath, plasmasheet or plasmadisc, and the magnetic cusps labelled. Saturn's field is more than ten times wider than the planet and rotates rapidly, dragging its cusp into the afternoon. Image credit: Xu et al., doi: 10.1038/s41467-026-69666-9, licensed under CC BY-NC-ND 4.0.


Earth’s magnetosphere is, by planetary standards, a tidy thing. The solar wind blows outward from the Sun, the planet’s magnetic field pushes back, and the funnel-shaped openings near the north and south poles, called cusps, sit almost directly under the Sun at local noon. That is the place where the incoming stream of charged particles most cleanly slips through the magnetic shield and into the atmosphere. Saturn does nothing of the kind. A team led by Dr. Yan Xu of the Southern University of Science and Technology has now mapped the kronian cusp using six years of archival Cassini magnetometer and plasma data, and found that the opening is dragged well into the afternoon. On average it sits between 13:00 and 15:00 local Saturn time, and in some events it extends toward 20:00, three to eight hours from where Earth’s equivalent sits. The culprit, the team argues, is not the solar wind at all. It is Saturn’s 10.7-hour rotation and the heavy load of ionized water vapor that the moon Enceladus pumps into the magnetosphere from its south-polar plumes.

The paper, published on 1 April 2026 in Nature Communications by Xu, Zhonghua Yao, Andrew Coates, Licia Ray, Sarah Badman, Chris Arridge and nine co-authors, is more than a curiosity about a single planet. The result is direct observational evidence for a long-standing theoretical claim: that on rapidly spinning gas giants with active moons, the planet’s own rotation can become the dominant force shaping its magnetosphere, more important than the Sun. If that is true at Saturn, it almost certainly extends to Jupiter, where the same physics plays out at larger scale, and to the growing catalog of exoplanets whose magnetic environments astronomers are now trying to characterize from a distance. “This study provides critical evidence for a long-held theory, that the rapid spin of massive planets like Saturn with active moons replaces the solar wind as the dominant force shaping magnetospheres,” Coates, a professor at University College London’s Mullard Space Science Laboratory, said in the UCL release.

There is a more practical reason the result matters. Saturn’s auroras are unusually bright and unusually variable, and one of the open questions in kronian physics has been why the most energetic emissions appear in the afternoon sector rather than at noon as on Earth (Lancaster University press release, August 10, 2026). A cusp that lives in the afternoon is also where magnetic reconnection, the explosive snapping and reconnecting of magnetic field lines that accelerates particles to keV energies and beyond, is most likely to fire. Knowing where the cusp sits helps the community locate the engine room of Saturn’s auroras, and the figure and full discussion have been widely covered in the planetary-science press (Sci.News writeup).

The analysis uses data from two of Cassini’s instruments, the magnetometer (MAG) and the Cassini Plasma Spectrometer (CAPS), collected between 2004 and 2010. Cassini spent thirteen years orbiting Saturn before its deliberate plunge into the planet’s cloud tops on 15 September 2017, and its archive is still turning up new science more than eight years after end of mission. For this study, the team pulled 67 discrete cusp crossings from the MAG and electron spectrometer data, then used a magnetic-field-line tracing model to localize each event in kronian local time. The result, summarized in the paper’s Figure 4, is a statistical map that looks nothing like Earth’s: instead of a single peak at noon, the kronian cusp occurrence rate is broadly distributed across the afternoon and early evening, with the centroid shifted several hours past local noon.

Two ingredients go into the explanation. The first is rotation. Saturn’s day is about 10.7 hours long, roughly 2.25 times shorter than Earth’s, and the planet’s deep interior is thought to rotate almost as a solid body. That fast spin drags the magnetic field, and everything locked to it, around the planet. The second is internal plasma loading. Enceladus, a small icy moon orbiting deep inside Saturn’s magnetosphere, vents water vapor from fractures near its south pole at a rate that turns out to be significant for the planet’s space environment. Cassini first imaged those plumes in 2005, and the ionized water they produce loads Saturn’s magnetosphere with heavy ions, including O+, OH+ and water-group species. Once ionized, this material is picked up by Saturn’s rotating magnetic field and pulled around the planet, where it contributes pressure that competes with the solar wind.

A 2019 paper in the Journal of Geophysical Research: Space Physics had already shown that Saturn’s equatorial current sheet oscillates with a period tied to the planet’s rotation rate, and that the sheet’s position depends on the balance between the solar wind pushing from outside and the internal plasma pushing from inside. The Xu et al. result extends that picture to the polar cusp, and shows that the imbalance is large enough to move the cusp by hours of local time.

The magnetosphere is the cavity carved out of the solar wind by a planet’s magnetic field. Its outer boundary, called the magnetopause, is the surface where the pressure of the planet’s field balances the pressure of the incoming solar wind. On Earth, the magnetopause is roughly ten Earth radii upstream, and the cusps are narrow funnel-shaped regions near the magnetic poles where field lines converge and dip back into the atmosphere. Charged particles from the solar wind can ride these open field lines directly into the upper atmosphere, which is why the cusps are preferred sites for auroral precipitation and direct solar wind entry into the magnetosphere.

The picture changes when a planet rotates fast and carries a lot of plasma around with it. At Saturn, the magnetosphere is enormous, more than ten times wider than the planet itself, and the heavy load of Enceladus-derived ions gives the internal plasma pressure enough weight to push the magnetopause outward on the night side and compress it on the day side. The fast rotation then drags the whole asymmetric structure around the planet. In the team’s high-resolution simulations, the net result is that the cusps are no longer located near local noon but are pushed several hours toward dusk.

That matters because of magnetic reconnection, the process by which oppositely directed magnetic field lines snap and reconnect across the magnetopause, releasing stored magnetic energy and accelerating particles to high energies. The location of the cusp sets the stage for where reconnection is most likely to occur, and where reconnection occurs is where the most energetic charged particles enter the magnetosphere. A cusp that sits in the afternoon sector therefore predicts afternoon-loaded energetic particles and auroral emissions concentrated on the afternoon and evening side of the polar cap.

The team also addressed a secondary question. Saturn’s magnetic field is famously hard to measure, because the planet’s radio emissions, the usual proxy for rotation rate, are unusually weak compared to Jupiter’s. The kronian rotation period has been a long-running puzzle. The Xu et al. result does not solve it, but it constrains one variable that goes into rotation-period models: the spatial distribution of plasma inside the magnetosphere.

Saturn’s magnetosphere is not a scaled-up Earth. The kronian cusp, the place where the solar wind enters the atmosphere most easily, is shifted into the afternoon because of two things the Earth does not have in any meaningful amount: a 10.7-hour rotation that drags magnetic field lines around the planet, and an active icy moon that loads the magnetosphere with water-group plasma. The Xu et al. 2026 paper compiles 67 such events from Cassini’s first six years at Saturn, and the statistical map of cusp occurrence has its centroid at 13:00 to 15:00 local time, with some events reaching 20:00.

The next test is at Jupiter, where Juno is still returning magnetometer data and where the same physics should produce a similarly skewed cusp distribution at larger scale. Looking further out, the framework should help astronomers reading magnetic signatures of hot Jupiters around other stars, where rapid rotation and intense plasma loading are the rule.


October 12, 2026

Roman’s coronagraph opens its eye

Posted by


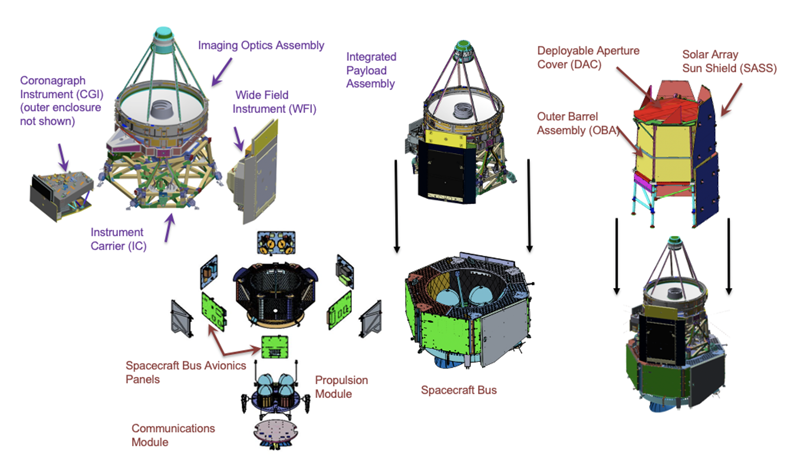
Schematic of the Nancy Grace Roman Space Telescope with the Coronagraph Instrument (CGI) called out as a separate module from the Wide Field Instrument (WFI), both attached to the Imaging Optics Assembly and Instrument Carrier, with the Spacecraft Bus and Solar Array Sun Shield shown separately. Source: Wikimedia Commons: Scheme of Roman Space Telescope (NASA public-domain artwork).


Five weeks after lifting off from Kennedy Space Center on a Falcon Heavy, NASA’s Nancy Grace Roman Space Telescope did the one thing its coronagraph was built to do. On September 22, 2026, the Coronagraph Instrument, a technology demonstrator bolted onto the side of the Wide Field Instrument and shielded from starlight by a system of masks and deformable mirrors, opened to cosmic light for the first time, according to a NASA Roman blog post on September 30 and a contemporaneous Caltech announcement that also noted the milestone on September 27. The team had kept the detectors slightly warmer than they will run during science operations to keep contamination from settling on them, so the first image was a noisy one. Five days later, on September 27, they cooled the detectors and pointed again at a new patch of the Large Magellanic Cloud, and the second frame showed what a star field is supposed to look like. The coronagraph had a focused image, and the team could exhale.

The milestone matters because Roman’s coronagraph is the first active, deformable-mirror coronagraph ever operated in space. Hubble’s coronagraphs were passive: a black spot in the focal plane to physically block starlight, with no way to clean up the diffraction rings and speckles that left a bright star’s halo drowning out any nearby planet. Roman’s coronagraph, designed and built at NASA’s Jet Propulsion Laboratory and operated from Caltech’s IPAC, has two deformable mirrors that reshape themselves about 100 times a second to push the residual starlight into a controlled pattern the team calls a “dark hole.” If the approach works, it will be the technological seed for the Habitable Worlds Observatory, the still-in-formulation flagship NASA wants to launch in the 2040s to image Earth-like planets around Sun-like stars. None of that is possible until a deformable-mirror coronagraph has actually been tested in orbit, which is what made September 22 a quiet but real turning point.

The story behind September 22 starts with launch. Roman left Earth on August 30, 2026 (the mission profile on Wikipedia covers the launch, the cruise to L2, and the planned five-year primary survey), and the Wide Field Instrument and Coronagraph Instrument have been powering on and stretching out one subsystem after another as the observatory cruises toward its halo orbit around the Sun-Earth second Lagrange point. The coronagraph itself woke up on September 1. Mid-month it deployed its mechanical limbs and electronics. The team then spent September 15 through 21 testing the fine-guidance system, a piece of the observatory’s attitude control that has no separate hardware, but instead reads guide-star positions from a small patch of each of the 18 infrared detectors in the Wide Field Instrument. The fine-guidance system reports those positions to the spacecraft’s attitude control about four times per second, and the attitude control nudges the observatory a tiny amount each time to keep it from drifting. Tests confirmed Roman could hold pointing stable to better than one hundred-thousandth of a degree for half an hour at a time with the Wide Field Instrument, and for eight hours at a time with the Coronagraph, a tighter constraint because the coronagraph’s own internal stability loop was also running.

The stability budget for the coronagraph is what makes the second observation more impressive than the first. Even a few nanometers of mirror motion, or a few milliarcseconds of pointing error, would let unwanted starlight leak around the coronagraph’s masks and overwhelm a planet roughly a millionth as bright as its host star. Engineers put the current pointing performance in the same terms they use for any other precision pointing system: keeping a laser focused on a U.S. dime from about 150 miles away, with a goal of stretching that to roughly 230 miles as the commissioning continues. With the fine-guidance loop and the coronagraph’s own internal loop both running, on September 22 the team allowed starlight from a faint star in the Large Magellanic Cloud to fall on the coronagraph’s detectors. The image was blurry by design because the detectors were running warmer than they would in steady-state science, but it confirmed the optical path from the primary mirror, through the coronagraph masks and deformable mirrors, to the focal plane was clear and focused.

Five days later the team ran a second observation, this time after cooling the detectors toward their final operating temperature for better sensitivity, and pointed at a new region of the Large Magellanic Cloud where the team expected many stars in a single frame. The coronagraph saw them. That second observation confirmed the team could reliably move the field of view and keep the coronagraph stable while doing so. Roman’s coronagraph instrument scientist Vanessa Bailey, at JPL, summed up the second observation in plain language: “we’re breathing a sigh of relief.” Alexandra Greenbaum, coronagraph data management lead at IPAC, framed the milestone around what comes next: she’s looking forward to the rest of commissioning on both the operations and the data-processing side.

The technology itself is the science and engineering deep dive here, because that is what makes the milestone a milestone. A coronagraph suppresses starlight so a much fainter planet or disk next to that star becomes detectable. In a passive coronagraph, like the one on Hubble’s STIS instrument or on James Webb’s NIRCam, a physical mask in the focal plane blocks the bright star’s core, but the wave nature of light still spreads some of that starlight into a halo of rings and speckles around the mask edge. Roman’s coronagraph actively corrects the wavefront of the incoming light using two deformable mirrors, surfaces whose shapes can be changed hundreds of times per second by pushing on the back of the mirror with hundreds of small actuators. When the deformable-mirror pattern is right, the speckle pattern from starlight interferes with itself and cancels out across a small region of the image, opening what the team calls the “dark hole.” That dark hole is where a much fainter planet, if there is one, would be visible. The trade is that the dark-hole trick only works for a narrow annulus around the star, and the deformable mirrors must keep running or the dark hole closes within milliseconds. Roman’s coronagraph uses two 64-by-64 actuator mirrors and a set of focal-plane masks that physically block the starlight before the deformable mirrors do their work, and the September 22 observation was a sanity check that all of those pieces are aligned well enough to deliver a focused image at all.

The other piece that makes the coronagraph unusual is the fine-guidance system, which is part of why the September 15-to-21 testing week mattered. Hubble, JWST, and most space telescopes carry a separate guider instrument, basically a small auxiliary telescope that locks onto a guide star and tells the main telescope where it is pointing. Roman does not have one. Instead, the team reuses a few pixels on the edges of the Wide Field Instrument’s 18 infrared detectors to track guide stars, and uses the spectra of those guide stars, not just their positions, to hold pointing steady. That gives Roman a way to point more precisely than a star-image tracker would, because spectra carry more information than a centroid, and it saves mass by removing a separate instrument. Roman’s guiding lead Begoña Vila, at Goddard, said the team is looking forward to validating that spectral-guiding mode in the coming weeks. The September 15-to-21 tests used position-only guiding; spectral guiding is the second tier, and confirming it is one of the remaining milestones of commissioning.

What comes next is a three-month commissioning campaign that will run Roman through a series of progressively harder tests. The coronagraph team will practice keeping the dark hole stable for longer and longer exposures, will test the deformable-mirror control loop under realistic thermal conditions, and will try imaging the dust disks that the coronagraph was originally scoped to study. NASA expects Roman’s first image release in early 2027, with the coronagraph’s first science-quality image landing later in the year once the deformable-mirror dark hole is reliably closing on demand. The September 22 and 27 observations are not those images. They are the “we have a working instrument” sign on the door, and the second one shows that the door is on hinges.


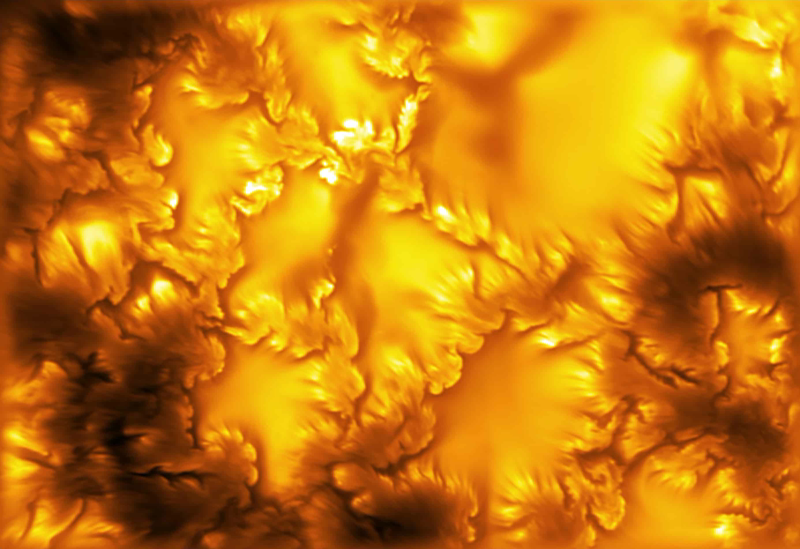
The highest-resolution image of the Sun's photosphere ever captured, taken at 416 nm by the Inouye Solar Telescope, showing granulation cells in golden orange with darker intergranular lanes and small vortex-like swirls along the edges of magnetic structures. Image source: NSF/NSO/AURA/MPS.


For roughly a century and a half, Kelvin-Helmholtz instability has lived a quiet life in physics. It explained the curls at the crests of ocean waves in a stiff breeze. It showed up in the banded clouds of Jupiter and Saturn. It was theorized to happen on the Sun’s visible surface, where hot plasma bubbles up and slides sideways past magnetic field lines, but no one had ever caught it doing it. That changed on August 5, 2026, when David Kuridze at the U.S. National Science Foundation National Solar Observatory and colleagues published the first unambiguous observation of Kelvin-Helmholtz vortices in the Sun’s photosphere, captured by the 4-meter Daniel K. Inouye Solar Telescope on Maui. The features are tiny: roughly 20 kilometers across, with an instability wavelength between 50 and 65 kilometers. The NSF NSO press release went out the same day, and the result was covered widely afterward.

Solar physicists have spent the better part of two decades arguing about a simple question: what keeps braiding the Sun’s magnetic field? The field is built up by a global dynamo, regenerated on an 11-year cycle, and released in flares and coronal mass ejections that drive space weather at Earth. The release happens through magnetic reconnection, where tangled field lines snap and reset into a lower-energy configuration, but something has to braid the lines in the first place, and existing models have struggled to braid them fast enough. The leading candidate has been “flux braiding” by granular flows (the bubbling of the Sun’s surface as hot plasma rises, cools, and sinks), but no one had directly observed the small-scale mechanism that makes that braiding efficient.

That is what the new result changes. The images show that wherever the photospheric magnetic field is strong enough, the boundary of the magnetic structure becomes sheared by the surrounding granular flow, and that shear rolls up into vortices with the wavelength and shape predicted by classical Kelvin-Helmholtz theory. The vortices are not rare. They are everywhere the field is strong. That gives the braiding mechanism a physical engine: KHI-driven turbulence, persistent and ubiquitous, capable of twisting field lines on the right timescale. It also gives coronal heating, the long-standing puzzle of why the Sun’s outer atmosphere is more than a million degrees Kelvin while the surface is only 5800 K, a candidate answer, since the same shear that braids the field also mixes magnetized and unmagnetized plasma and pumps energy upward.

The Inouye Solar Telescope, also known as DKIST, sits at roughly 3000 meters on Haleakalā, with a 4-meter primary mirror (the largest in any dedicated solar telescope). Science operations started in late 2021 after two decades of construction. The August 5 paper pulls together observations from the telescope’s Visible Broadband Imager (VBI), which captures the photosphere in narrow wavelength bands tuned to specific spectral lines. The KHI data were taken at 416 nanometers, a wavelength sensitive to the photosphere’s quiet magnetic regions.

Kuridze’s team is international: the National Solar Observatory in Boulder; the NSF NCAR High Altitude Observatory (HAO); and the Max Planck Institute for Solar System Research (MPS) in Göttingen. Twelve co-authors include Friedrich Wöger and Thomas Rimmele from NSO; Matthias Rempel from HAO; and Robert Cameron and Sami Solanki from MPS. The paper also validates, at the highest resolution to date, MURaM simulations (Max Planck/University of Chicago Radiative MHD), which simulate the Sun’s surface from first-principles physics. The agreement on vortex structures, wavelength, and fine-scale striations was close enough that the team could rule out alternative explanations.

The vortices appear as small curls at the edges of magnetic field concentrations, where the surrounding plasma flows at one speed and the flux tube moves at another. The curls break down into thin dark stripes a few kilometers wide, the finest-scale dark striations known on the Sun. In the comparison image the team published, the simulated frame and the observed frame are nearly indistinguishable, which convinced the referees that the feature was real and not an artifact. The structures are stable on the timescales of minutes, long enough to rule out noise, but short enough that they could only have been caught with sub-second exposure times.

The timing matters. August 5 lands during the peak of Solar Cycle 25, when the Sun’s magnetic field is most disordered and space-weather events are most likely to affect satellites and power grids. Kuridze told CNN the discovery is “a really efficient way for the Sun to break big plasma flows down into smaller motions,” letting the Sun heat its corona to millions of degrees. Rempel called the agreement between the Inouye observations and the MURaM simulations “the highest resolution validation of solar magnetohydrodynamic simulations to date,” in coverage summarized by Sci.News.

Kelvin-Helmholtz instability, formulated around 1870 by Lord Kelvin and Hermann von Helmholtz, describes how a flat interface between two fluid layers moving at different speeds can spontaneously wrinkle. Any small perturbation along the interface gets amplified by the shear: the high-speed side drags the boundary forward, the low-speed side holds it back, and the differential motion feeds back into the perturbation until the boundary rolls up into a train of spiral vortices. The spacing of the vortices, the instability wavelength, is set by the shear velocity, the density contrast across the interface, and the magnetic tension that resists the rolling.

In the Sun’s photosphere, the relevant interface is between a magnetic flux tube (a vertical column of stronger magnetic field anchored in the Sun’s surface) and the surrounding non-magnetized plasma. The flux tube is buoyant: it has lower density than its surroundings because magnetic pressure partially replaces gas pressure. It also moves more slowly than the surrounding plasma, which is shoved sideways by granulation. That is exactly the configuration for Kelvin-Helmholtz: a denser, slower fluid next to a less-dense, faster fluid, with a magnetic interface that resists being broken. As the team observed, the interface deforms, vortices form, and thin dark stripes are shed downstream, just as classical theory predicts.

The numbers line up. The team measured the instability wavelength between 50 and 65 kilometers in both observations and MURaM simulations, matching the wavelength computed from the measured shear and density contrast within a factor of two. The vortex diameters are smaller, on the order of 20 kilometers, the right size for the boundary layer to wrap around before the vortices detach. A single granulation cell on the Sun’s surface is about 1000 kilometers across, so each granule contains many thousands of vortices when magnetic flux is present. Every granule has magnetic flux threading it, and every flux tube has a sheared boundary.

This matters because the same vortices that braid the magnetic field also mix it. Magnetic flux diffusion, the rate at which the Sun’s field spreads out and reconnects across the photosphere, has been a stubborn parameter in dynamo models: predicted values were too low to explain the 11-year cycle, and observed values were hard to pin down. KHI-driven mixing gives a physical source for that diffusion, on the right spatial and temporal scales. It also pumps energy upward: the vortices shed kinetic energy that cascades to smaller scales, where viscous and resistive dissipation convert it to heat in the chromosphere and corona. Whether that cascade is large enough to be a major contributor to coronal heating is what the team is now pursuing, with automated detection pipelines to count vortices across the full active region.

The August 5 paper is a settled result, not a live event: the Nature paper, the DKIST data, the MURaM simulations, and the imagery are all public and archived. What changes is the resolution of the field. The Inouye Solar Telescope is resolving features at the 20-kilometer scale on the Sun’s surface, and the team has done the comparison work to rule out alternative explanations. The next step is automated detection of these vortices in the existing DKIST archive, which runs into the petabyte range. For space-weather prediction, the practical step is to fold KHI-driven magnetic diffusion into the operational models that drive the next solar cycle’s forecasts. The first such updates, from HAO and MPS, are expected within the year. The Sun has been running its 11-year magnetic cycle for at least the past few hundred cycles. We are only now watching it run.


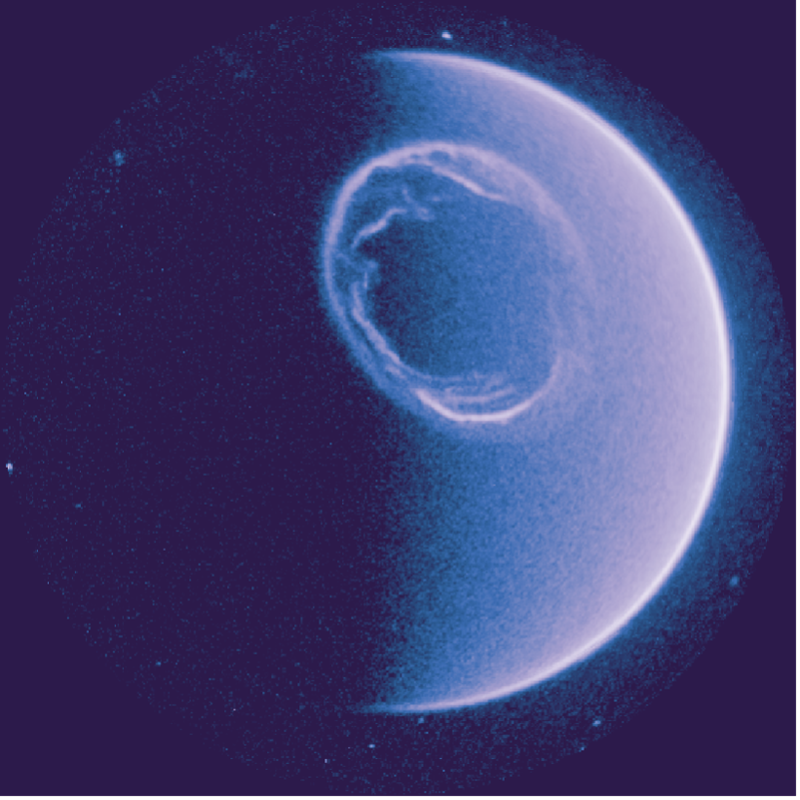
Earth's northern hemisphere as seen by SMILE's UVI camera on 24 July 2026, showing the dayside and nightside auroral oval in ultraviolet light. (Image credit: ESA & CAS/Smile/UVI)


For most of the last eighteen years, anyone wanting to see the whole northern auroral oval at once has had to piece together images from low-Earth orbit, stitching narrow camera swaths into a quilt. The ultraviolet imager on the new SMILE spacecraft ended that gap on 24 July 2026, and on 30 September 2026 the European Space Agency released the result: a 45-hour ultraviolet movie of the entire ring of northern lights, dayside and nightside together, with an auroral substorm frozen mid-ripple. It is the first complete ultraviolet portrait of the oval since NASA’s Polar mission ended in 2008, and the early frames are already changing how researchers think about the boundary between the solar wind and Earth’s magnetic shield.

SMILE, the Solar wind Magnetosphere Ionosphere Link Explorer, is the first space mission jointly selected, funded, built, launched, and operated by ESA and the Chinese Academy of Sciences. It launched on 19 May 2026 aboard a Vega-C from Europe’s Spaceport in French Guiana, reached its science orbit on 20 June, and on 23 September 2026 ESA declared the spacecraft ready to start routine science operations. The mission is built around a question that has lingered since the magnetosphere was first sketched in the 1960s: how does the Sun’s wind of charged particles couple, end to end, to the bright auroras people watch from the ground. Past missions like ESA’s Cluster constellation and NASA’s IMAGE have studied pieces of that problem. SMILE is the first to watch the whole system in one go.

The instrument that produced the released image is UVI, the ultraviolet aurora imager, one of four science payloads aboard the 2,300-kilogram spacecraft (1,580 kilograms of that is propellant used to climb to its operational orbit). UVI was switched on 16 July 2026 and began returning data on 24 July, when the spacecraft caught a substorm in progress. Substorms are short disturbances in the magnetosphere, produced when a pulse of solar wind compresses Earth’s magnetic field lines, fires a burst of energetic particles down toward both poles, and lights up the oval for tens of minutes. The released 58-second clip covers 00:00 to 00:58 Universal Time, with the timestamp ticking in the upper left corner and distant ultraviolet stars drifting in the background. The way the bright ring ripples and brightens across those 58 seconds is the signature of a substorm loading and unloading the magnetotail.

The image at the top of this post is a single frame from that clip. The crescent Earth is light blue, the way it always looks in the ultraviolet Lyman-alpha and far-ultraviolet bands UVI is tuned to. Around the north pole, the white swirl is the auroral oval itself, including the dayside arc that ground cameras cannot see because the Sun drowns it out. The image is square because UVI’s field of view is roughly 10 degrees across, and the spacecraft’s highly inclined, highly elliptical orbit takes it as far as 121,000 km above the North Pole at apogee, nearly a third of the way to the Moon. From that height, the camera can frame the entire oval in a single exposure. The other three instruments contribute context that UVI alone cannot: SXI, a soft X-ray imager led by the University of Leicester, will map the magnetopause, the boundary where the solar wind meets Earth’s magnetic field, by imaging X-rays produced when solar wind ions swap charge with neutral atoms in the geocorona. MAG, a boom-mounted magnetometer, samples the local field strength. LIA, a light ion analyzer on the platform, counts the solar wind particles themselves. The combination is what makes SMILE different: it is a magnetosphere-wide camera, not a single-region probe.

The science the mission is built to chase is space weather. Solar storms can knock out satellites, drag down power grids, and force airlines to reroute polar flights, and the most damaging ones are the hardest to predict because the chain from solar wind to ground-level aurora runs through a magnetosphere that nobody has watched in its entirety. SMILE’s 45-hour continuous ultraviolet sessions are aimed at filling that gap, capturing the oval through enough of a solar rotation to see how the magnetosphere responds as the wind direction and density shift. ESA expects about 300 substorms across the three-year nominal mission, more than usual because the Sun is at the peak of its eleven-year cycle. The mission consortium, reported by India Today, includes more than 250 European and Chinese scientists and 14 contributing countries, with Airbus Defence and Space leading the payload module assembly at ESA’s ESTEC technical centre in the Netherlands. The mission also carries the first instrument ever designed to look at the magnetopause in X-ray light, opening a window that no previous mission has had.

There are open questions that no amount of engineering has answered yet. SXI, the soft X-ray imager, is currently too sensitive to stray light when pointed at Earth, and the team is uploading new settings and software to the spacecraft to bring the background down. The good news is that the unwanted light is dropping on its own as SMILE’s orbit carries it farther from Earth and as the north pole tilts into winter darkness. Mid-October 2026 should bring SXI’s first clean view of the magnetopause or the northern polar cusp, the funnel-shaped hole in the magnetic field above the pole through which solar wind ions rain down. Once SXI lights up, SMILE will be returning simultaneous X-ray and ultraviolet movies of the same events, the first time anyone has correlated the two views frame by frame. The auroral substorm clip itself, covered by Space.com on 2 October, is what put SMILE in front of a public audience that had not heard of the mission before.

What comes out of the next few months is going to be a database, not a single picture. The first ultraviolet still is the proof that the camera and the orbit work, and the GIF of the 24 July substorm is a teaser for the kind of change the camera can resolve. The real work begins in late October 2026, when SXI is expected to deliver its first usable magnetopause image and the four-instrument observation campaign gets underway. Three years from now, the dataset SMILE accumulates should let researchers tie specific solar wind conditions to specific ground-level disturbances in a way that current models, which lean heavily on extrapolation, cannot. That is the kind of data that takes the guesswork out of space weather forecasts, and that is what the mission was conceived to deliver. The first still was the postcard; the science database is what the postcard is advertising.