
OrbitalHub

Where curiosity reaches escape velocity.

Domain is for sale. $50,000,000.00 USD. Direct any inquiries to contact@orbitalhub.com.


A glowing DNA double helix unfurling into a grid of single-letter variant predictions, with genome browser tracks for splicing, expression, and chromatin at the base


For a patient whose genome has just been sequenced, the diagnostic question usually is not whether a strange variant exists. There will be dozens. The question is which one of them is making them sick. On 8 September 2026, Google DeepMind released AlphaGenome Atlas, a one-petabyte, nine-billion-row table that aims to make that triage a single look-up instead of a multi-month investigation. It is the largest precomputed biological dataset the company has ever released, more than thirty times the size of the AlphaFold Protein Structure Database at launch (DeepMind, 2026), and it covers the 98 percent of the human genome that does not code for proteins at all.

What the team has done is straightforward to describe and almost absurd in its engineering ambition: take the AlphaGenome sequence-to-function model they published in Nature in January 2026, run it across every possible single-letter substitution at every one of the roughly three billion positions of the human reference genome, store the predictions, and serve them on the open web. Every variant. In advance. With feature attributions attached. With a single composite score, the AlphaGenome Variant Impact (AVI), that collapses the predictions into a number clinical researchers can rank variants by. The bottleneck in human genetics, in other words, has just moved.

To see why this matters, it helps to remember where the field stood a decade ago. In the early 2010s, the human genome was widely described as 98 percent “junk DNA.” That framing did not survive contact with ENCODE, the Roadmap Epigenomics Project, GTEx, or any of the consortium-scale projects that mapped chromatin accessibility, transcription factor binding, histone modifications, and three-dimensional genome contacts across hundreds of cell types. By the early 2020s the consensus was unambiguous: most of the variants statistically associated with common traits and many rare diseases live outside coding exons, in regulatory regions whose effect on the organism can only be inferred by reading the sequence around them and computing what those regions should be doing (Nature, Avsec et al., 2026). The Human Cell Atlas, the 4D Nucleome, FANTOM5 — they produced the data. Predicting the effect of any given mutation on gene expression, splicing, or chromatin, on demand, was the missing piece.

DeepMind’s path to Atlas runs through three increasingly ambitious releases. AlphaFold, in 2020, solved the decades-old protein folding problem and earned Demis Hassabis and John Jumper a share of the 2024 Nobel Prize in Chemistry (Nobel Foundation, 2024). AlphaMissense, in 2023, classified all 71 million possible missense variants in the protein-coding part of the genome as likely benign or pathogenic. Both tools covered only the 2 percent that codes for proteins. AlphaGenome, first released for non-commercial research in June 2025 and described in Nature in January 2026, covers the other 98 percent. Atlas is the precomputed, freely searchable version of that model (DeepMind, 2026; Avsec et al., Nature, 2026).

The early-access users announced alongside the release illustrate what shifts when the bottleneck moves. Laura Covill and Anne O’Donnell-Luria at the Broad Institute used the AVI score to reprioritise a variant in DNM1, a gene strongly linked to epileptic encephalopathy, that had been overlooked in earlier analyses; AlphaGenome predicted an abnormal splice site extending the resulting protein, a mechanism subsequently confirmed by laboratory experiments (DeepMind, 2026). Gareth Hawkes, an MRC fellow at the University of Exeter, ran the Atlas over whole-genome data from more than 54,000 UK Biobank participants and reported 22 percent more non-coding genetic associations than prior pipelines surfaced, including regulatory variants affecting PLA2G7 and EGLN1 and nineteen new regions linked to body mass index. At the Stowers Institute, Julia Zeitlinger and Melanie Weilert used the database to separate transcription factors by their regulatory effects on chromatin, a problem that has resisted biochemical characterisation for two decades.

The architecture behind those results is what makes the engineering tractable. AlphaGenome uses a U-Net-style neural network: an encoder that compresses one million base pairs of input DNA into a dense representation, a stack of transformer blocks that pass information between distant regulatory elements across that window, and a decoder that reconstructs base-pair-resolution predictions across eleven molecular modalities — gene expression, RNA splicing, chromatin accessibility, histone modification, transcription factor binding, three-dimensional contacts, and others — for hundreds of human and mouse cell types (Avsec et al., Nature, 2026). The model was pre-trained on 256 Google TPUv3 chips working in parallel over data from ENCODE, GTEx, the 4D Nucleome, and FANTOM5, and then distilled into a smaller student model that completes the full all-modality, all-cell-type prediction for a single variant in under one second on a single NVIDIA H100 GPU. DeepMind’s genomics lead Žiga Avsec told reporters the team needed an 80-fold speedup over their initial pipeline to make Atlas feasible; they reached it through a combination of model distillation, GPU kernel optimisation, and aggressive elimination of redundant computation (DeepMind, 2026).

The AVI score itself is what lets researchers act on those predictions. It folds the eleven AlphaGenome modalities together with AlphaMissense’s protein-impact estimates and an evolutionary-conservation signal into a single number. On solved rare-disease cases from the GREGoR Consortium, the score placed the known causal variant in the top fifty candidates 29.5 percent of the time; CADD, the most widely used genome-wide variant scoring system in clinical genomics today, managed 12.5 percent on the same benchmark — a 2.4-fold improvement on the metric that matters most to a clinician staring at a patient’s exome (DeepMind, 2026). Each AVI score is paired with feature attributions that say which modality is doing the heavy lifting for any given variant, so a researcher can see not just that a mutation looks bad but why it looks bad.

What changes now is the geometry of the work. Before Atlas, a clinical genomics group that wanted to score a list of candidate variants had to either run a model themselves, rent the compute, or wait on a collaborator who could. After Atlas, they open a browser, type a chromosome coordinate, and read off the score. The cost has collapsed from days of GPU time and a real infrastructure bill to a single API call. The companion AlphaGenome Variant Impact score is freely available through a web portal and API for non-commercial research now, with commercial availability on Google Cloud slated to follow. DeepMind is explicit that the output is not approved for clinical use, and independent reviewers have flagged the obvious limits: many diseases involve multiple interacting variants rather than a single mutation, and some enhancers act over distances longer than the one-million-base-pair window AlphaGenome examines, so their effects fall outside what the model can see (NeoScienceHub, 2026).

The next twenty years of precision medicine will be shaped less by any single sequencing technology than by how quickly reference databases like this one become the substrate that all downstream tools assume exists. AlphaFold did that for structural biology between 2021 and 2025: a problem that used to take a graduate student a year collapsed into something a high schooler could look up. AlphaGenome Atlas has now attempted the same move for the rest of the genome. Whether it actually accelerates diagnoses and mechanism discovery at scale will not be settled in the press release; it will be settled in the next five years of clinical genetics journals, where the question of how often a researcher who never had to run the model themselves first ends up reading the right page of the answer.
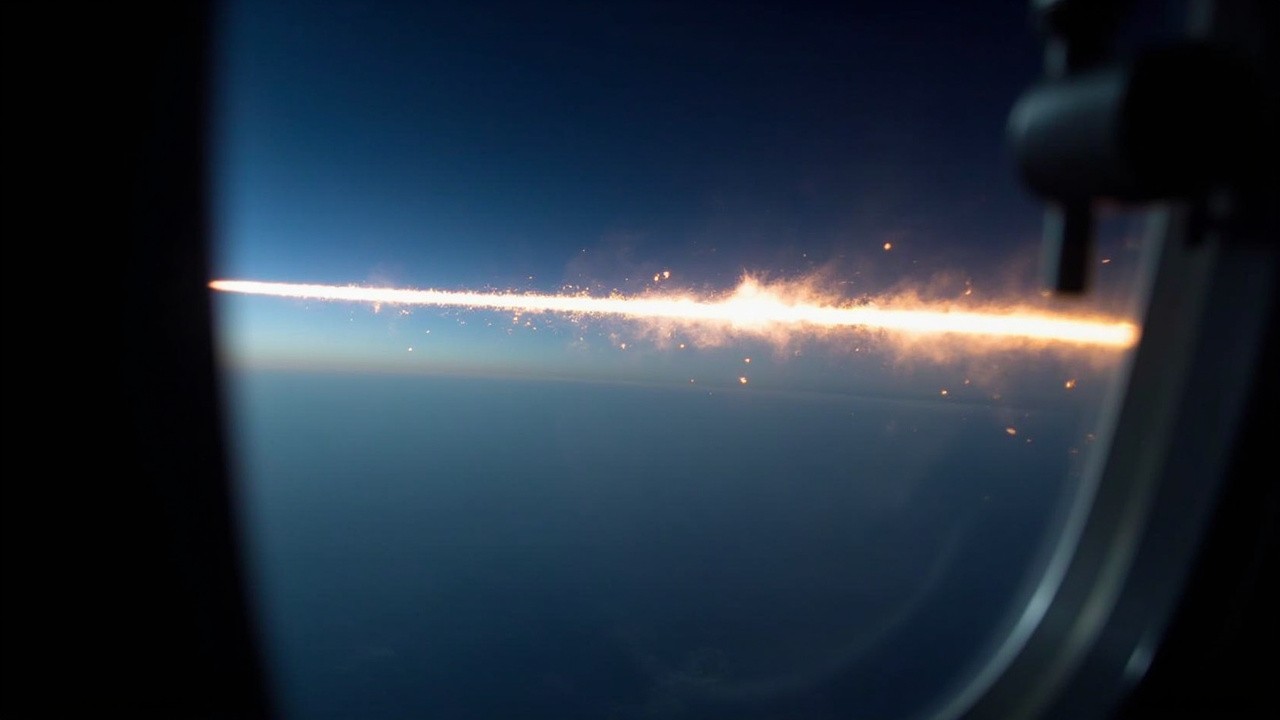


A reentry fireball streaks across a twilight sky above a dark ocean, seen through the window of an observation aircraft, its trail breaking into glowing fragments.

Illustration of the view from the ROSIE observation aircraft during the Tango reentry on 1 September 2026; a generated image, not a photograph of the event.


At 21:30:31 UTC on 1 September 2026, a thread of glowing aluminium and titanium began to lose coherence somewhere above the South Pacific and slid into a long, ragged line of fire. A chartered aircraft that had lifted off from Tonga banked hard at the right moment — the pilot contributing, by ESA’s later account, a few extra seconds in the cockpit’s favour — and twenty-nine of its thirty instruments tracked the breakup for about fifty seconds across the darkening sky. Back at the European Space Operations Centre (ESOC) in Darmstadt, the flight control team had already lost the spacecraft’s signal through Kourou about fifteen minutes earlier. Cluster II’s longest-running act was over. Samba had gone the day before, on 31 August at 17:39 EDT. Twenty-six years of magnetospheric science, four burning satellites, one airborne chase that ESA is now turning into design rules for an entire decade of constellation launches.

The Cluster finale marks the deliberate marriage of two ideas that have spent decades talking past each other: orbital debris mitigation and atmospheric-entry science. Until recently, design for demise — building satellites that burn up cleanly, with minimal surviving fragments and minimal aluminium-oxide pollution in the upper atmosphere — was almost entirely a laboratory exercise. Engineers sent components into plasma wind tunnels, like the arc-heated facility at the German Aerospace Center (DLR) in Cologne, and inferred how a whole spacecraft would come apart. The Cluster campaign is the first time four real, retired satellites have been observed in their actual death throes on a repeatable schedule (ESA, 2 September 2026).

The mission itself began in failure and ended in patience. ESA’s original four-satellite Cluster was destroyed in June 1996 on the maiden flight of Ariane 5 (Flight 501). The rebuilt Cluster II launched in pairs aboard two Soyuz-Fregat rockets from Baikonur on 16 July and 9 August 2000, each Soyuz upper stage releasing two 1,200-kilogram, 2.9 by 1.3 metre spinning cylinders — Rumba, Salsa, Samba, and Tango — built by Dornier (now part of Airbus). Each carried 71 kilograms of magnetometers, wave experiments, particle detectors, and electron-drift instruments drawing 224 watts from their solar cells (Wikipedia, Cluster II spacecraft; ESA, 2000). The quartet went into a highly elliptical orbit with perigee near four Earth radii (~25,500 km) and apogee near 19.6 Earth radii (~125,000 km), inclined close to 90° so that every other pass would cross the dayside magnetopause and every other would dive through the magnetotail on the night side. The orbital period was about 57 hours (HandWiki, Cluster II; Wikipedia, Cluster II). Twenty-four years is the formal mission duration; science operations were formally closed out in March 2024 to give ESA time to choreograph the end.

Cluster’s enduring scientific contribution was something earlier missions could not do: simultaneous, three-dimensional sampling of the same plasma event from four separated platforms. Cluster showed, with measurements from a tetrahedral formation spaced from a few hundred to a few thousand kilometres apart, that what looked like a single flux transfer event or substorm onset was usually a structured three-dimensional phenomenon with different signatures at different points (ESA, Cluster mission archive). NASA’s MMS mission and the joint CNSA-ESA Double Star mission eventually built themselves out from the Cluster playbook.

The deliberate end of life began in November 2024. ESA’s flight dynamics team fired a handful of small thruster burns on Salsa and Rumba, lowering their perigees and rotating the timing of their next atmospheric passes so that any surviving fragments would fall over an uninhabited stretch of the South Pacific — and so that an aircraft packed with sensors could be waiting. Salsa reentered on 8 September 2024; Rumba followed on 22 October 2025; in late January 2026, the same team nudged Samba and Tango to align their reentry footprints within twenty-four hours of each other and within reach of an aircraft staging out of Tonga (astronomy.com, 4 September 2026; ESA, Cluster reentry ground tracks, August 2026). ESA calls this operation “targeted reentry.” Nobody in the space-debris community had done it four times in a row before.

The ROSIE airborne observation campaign — Reentry Science Observatory for the Ionosphere and the Atmosphere, run by Astros Solutions under ESA contract — packed optical cameras, infrared spectrometers, photometers, and high-frame-rate imagers from the University of Stuttgart’s HEFDiG group and several European partners onto a single airframe. Twenty-nine of thirty instruments worked for both reentries. On Tango, the pilot banked the plane at the calculated moment to keep the disintegrating streak centred in the instruments’ field of view for an extra few seconds. The accuracy was, by ESA’s own description, “to the second” (ESA, 2 September 2026; phys.org, 2 September 2026).

The orbital mechanics of getting a magnetospheric constellation to die on cue is a problem of its own. Earth’s oblateness, expressed through the J2 zonal harmonic of the geopotential, precesses the orbit’s node at about 7.5° per year; lunar and solar third-body perturbations cycle the perigee distance through a roughly twelve-year pattern in and out of the denser atmospheric regime (Wikipedia, Cluster II; ESA mission materials). Cluster’s perigee originally sat near 25,500 km; by a 2014 epoch, perigee had dropped to around 16,000 km and apogee to about 117,000 km (Wikipedia, Cluster II infobox, 13 March 2014 epoch). That migration is why the finale was possible at all: by waiting for perigee to swing low, the team could count on natural drag to do most of the breakup work and use only small nudges to steer the ground track to a known-empty patch of ocean.

What actually happens to an intact satellite at the moment of atmospheric entry is poorly constrained by theory. The standard engineering heuristic for stagnation-point heating is Sutton-Biblarz’s approximation, in the form q ∝ sqrt(rho / R_n) * v^3, where rho is local atmospheric density, R_n is the leading-edge nose radius, and v is the entry velocity. For Cluster’s penultimate perigee dips to about 110 km altitude at relative velocities above 10 km/s, the stagnation heating rate lands in the neighbourhood of tens of megawatts per square metre of forward-facing surface (Sutton & Biblarz, Rocket Propulsion Elements; astronomy.com, 4 September 2026). The way a real satellite comes apart depends on which joints fail first — tank welds, harness connectors, solar-array hinges — and on small differences in alloy, paint, and thermal mass, which is exactly what single-part wind-tunnel tests cannot reproduce.

Cluster’s early reentries already produced two concrete findings. Stijn Lemmens, ESA’s acting head of space debris, reports that the upper-atmosphere models used to predict where the satellites would break up underestimated the local density by about twenty per cent — a small error at high altitude that compounds into a larger miss at the breakup point. Salsa also began to disintegrate earlier than conservative models predicted, with structural joints letting go at a higher altitude than expected (ESA, 2 September 2026). Both findings flow into ESA’s design-for-demise guidance for future spacecraft, with the goal of avoiding the two failure modes that worry planners most: titanium fragments landing on shipping lanes and aluminium-oxide particulates persisting in the stratosphere.

The follow-up is already in build. The Draco mission — Destruction and Re-entry Consolidated Observation — is scheduled to launch in 2027. Draco is essentially an instrumented test article: more than two hundred sensors, four cameras, and a hardened capsule to bring the data home after the spacecraft itself has disintegrated. ROSIE will fly underneath for a fourth campaign. With three real-satellite practice runs in hand, the airborne team will finally be able to match what the outside saw with what the inside felt (ESA, 2 September 2026; phys.org, 2 September 2026).

Cluster II’s last command to Tango, sent from the Kourou ground station minutes before the link died, was not the end of a mission. It was the opening argument for a new routine: spacecraft designed from the start to die on schedule, in known places, in ways that scientists can see coming. Low Earth orbit is on track to triple its mass by the early 2030s, which means atmospheric reentry will move from occasional accident to industrial throughput. ESA turned Cluster’s natural decay into a scheduled experiment; the four-satellite, four-year, four-burning-run dataset will feed directly into the design rules for the next decade of constellation launches — better joint choices, better materials, fewer surprises in the stratosphere. Twenty-six years of magnetospheric science, then four years of being studied on the way down. That is a hard record for any mission to argue with.


September 21, 2026

Rapidus, IBM, and Japan’s 2nm gamble

Posted by


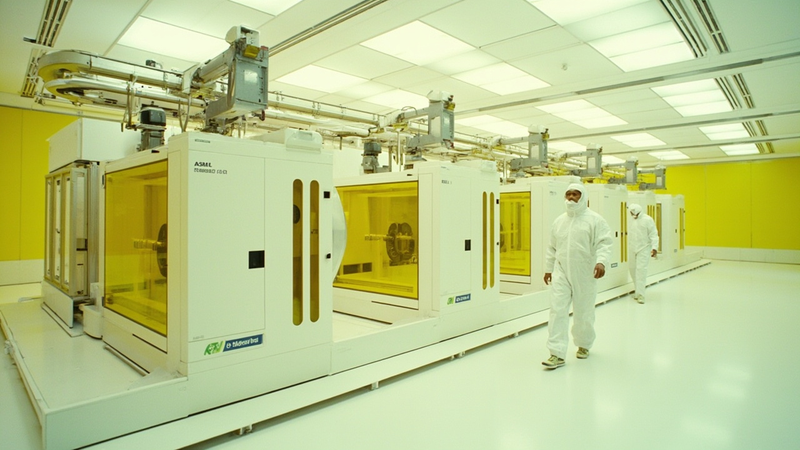
A row of EUV lithography scanners inside a modern semiconductor cleanroom, similar to the equipment installed at Rapidus's IIM-1 pilot fab in Chitose, Hokkaido.


For the past year, the headlines about leading-edge chips have read like a closed case. TSMC pulled the first 2 nm wafers off its Hsinchu line in late 2025, with Apple taking the first slice. Samsung’s competing gate-all-around (GAA) node followed shortly after. Intel’s 18A staggered through yield issues. The story was supposed to be a foundry duopoly asserting itself once again.

Then there is a small company in Chitose, Hokkaido, with a cleanroom the size of an aircraft hangar and a different idea about how a fab should run. Rapidus is trying to do something the rest of the industry has decided is impossible: build leading-edge logic chips one wafer at a time, ship a customer’s design back in fifty days, and enter mass production in 2027, about two years behind the leaders. The bet is not that Japan can outspend Taiwan. It is that some chip buyers no longer want a foundry that treats them like a queue number.

Three things are happening at once. Demand for AI training and inference silicon is growing roughly 30 percent a year. Geopolitics is making the concentration of leading-edge fabs in one corner of the Pacific a strategic liability. And the cost of a new fab has crossed the line where only a sovereign wealth fund, the U.S. CHIPS Act, or a national budget can write the check. TSMC is on track to push 2 nm capacity past 100,000 wafers a month by the end of 2026 and is already sampling A16 (1.6 nm) with backside power delivery to its largest customers.

That concentration is what Rapidus was created to dilute. The Japanese government has put in roughly 1.4 trillion yen directly. Private investors added 920 billion yen in a February 2026 round, taking cumulative support past 2.35 trillion yen. Sony, Toyota, Kioxia, Denso, NEC, SoftBank, and Canon now sit on the shareholder list. The state is the largest single holder.

What they bought is a thesis: that the foundry business can be unbundled. Volume production belongs to TSMC and Samsung. Fast-turn prototyping and small-batch manufacturing for AI startups and Japanese industrial customers can be a separate business. Tenstorrent, the AI chip company led by Jim Keller, signed on as an early customer. Canon became the first major Japanese anchor in March 2026 with a 40 billion yen joint program for image-processing silicon.

Rapidus did not start as a chip company. It started in 2022 as a question inside Japan’s Ministry of Economy, Trade and Industry: who would build the country’s processors if access to TSMC at 5 nm and below were cut off? In roughly eighteen months, the answer became a state-backed foundry that would license IBM’s most advanced transistor design and build a cleanroom around it.

The IBM connection is the keystone. In May 2021, IBM demonstrated a 2 nm test chip on a GAA nanosheet architecture at its Albany NanoTech Complex in New York, a research fab jointly funded by IBM, the State University of New York, and a rotating set of equipment vendors. Albany is a lab, not a production line. IBM has not owned a fab since selling its chip business to GlobalFoundries in 2015. It needed a partner willing to take its research and run it for real.

Rapidus signed on in December 2022 and sent 150 engineers to Albany for two years; half have now rotated back. The cleanroom, IIM-1 (Innovative Integration for Manufacturing), broke ground in September 2023. The first ASML NXE:3800E extreme ultraviolet (EUV) scanner arrived in December 2024 and printed its first wafer in April 2025. By July 18, 2025, Rapidus had working 2 nm GAA transistors on a prototype wafer, with electrical characteristics the company said met its targets (Rapidus press release, July 2025).

The harder work has come since. CTO Kazunari Ishimaru acknowledged in a March 2026 interview that the July 2025 milestone had been announced “ahead of full readiness,” with significant work done between September and November 2025 to bring transistor performance in line. A Process Design Kit went out to customers in Q1 2026. Customer test chips are scheduled to start running in late 2026, with mass production targeted for the second half of 2027.

The pricing target is roughly 3 to 3.5 million yen per wafer, a 50 percent premium over TSMC’s mature nodes but reportedly competitive with N2. Capacity is 6,000 wafer starts per month initially, ramping to 25,000 in the first year. To put that in scale, TSMC’s 2 nm output alone is expected to exceed 100,000 wafers a month by mid-2026. Rapidus is not trying to match that volume. It is trying to make the customer interaction different.

The reason Rapidus is in the conversation at all is the transistor. For twenty years the industry rode a structure called FinFET: a vertical fin of silicon with the gate wrapped around three sides. FinFETs scaled cleanly to about 5 nm. Below that, leakage through the bottom of the fin starts to dominate, and the supply voltage V_DD cannot drop further without losing switching speed.

A gate-all-around nanosheet transistor solves this by replacing the fin with a stack of thin horizontal silicon sheets, each fully surrounded on all four sides by the gate stack. The electrostatic coupling between gate and channel is described by a term called the subthreshold swing, and the relevant limit is

S = (kT / q) * ln(10) * (1 + C_dep / C_ox)

where kT / q is the thermal voltage (about 26 mV at room temperature), C_dep is the depletion capacitance in the channel, and C_ox is the gate oxide capacitance. As C_ox grows relative to C_dep, S falls toward 60 mV per decade, the theoretical minimum, and off-state leakage drops with it. Wrapping the gate on all four sides drives C_ox up, which is why GAA is the only way to keep scaling below 3 nm.

The engineering cost is enormous. GAA nanosheets require multiple epitaxial growth steps, selective layer reductions to set the threshold voltage, and extreme ultraviolet lithography at a 13.5 nm wavelength. Each NXE:3800E EUV scanner costs roughly 200 million dollars and runs at about 195 wafers per hour. Rapidus has installed more than 200 such tools in IIM-1 in less than a year.

Single-wafer processing, moving each wafer through every step individually rather than batching in lots of 25, is the other bet. Batch processing is faster per step but extends the cycle time. A typical TSMC N3 wafer takes about 120 days from order to delivery; Rapidus is targeting 50. Achieving that means tighter scheduling, more material-handling automation, and a manufacturing execution system that can coordinate several hundred tool types in real time.

Rapidus will probably not threaten TSMC’s volume business. Apple alone will consume more 2 nm wafers in 2026 than Rapidus plans to ship in its first year of mass production. The geopolitical and ecosystem advantages TSMC has built are not moveable in a single fab cycle.

What Rapidus may do is create a third option for chip designers who have spent a decade with two. Tenstorrent’s bet is that fast tape-out and design-manufacturing co-optimization can compress the time between a new AI model and a chip that runs it. Canon’s bet is that having a domestic 2 nm source for image processing matters more than having the cheapest one. The state’s bet is that 2.35 trillion yen is worth the option of not being locked out of the leading edge by 2030.

Whether any of these bets pay off will be visible in the defect density charts of late 2027. Until then, the most interesting question in semiconductors is not who is winning the 2 nm race. It is whether there is room for someone who is not in it at all.


September 14, 2026

Three solid stages and a 3D-printed engine

Posted by


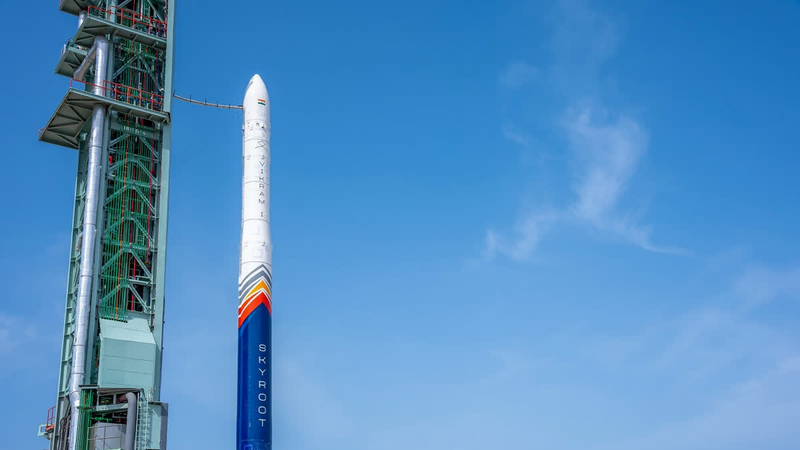
Vikram-1 on the First Launch Pad at SDSC-SHAR before Mission Aagaman. Credit: IANS / Skyroot Aerospace via ETV Bharat.


On July 18, 2026, at 06:35 UTC, a 22-meter rocket lifted off from the First Launch Pad at the Satish Dhawan Space Centre on Sriharikota island. Twelve minutes later, four payloads were floating in a 450-kilometer orbit at a 60-degree inclination, marking the first time an Indian private company had reached orbit under its own name. The rocket was built by Hyderabad-based Skyroot Aerospace, and the mission was named Aagaman, Sanskrit for “arrival.” It gave India a third-country credential — only the United States and China have carried one since 2008.

For two decades, India’s orbital launches have carried the same institutional stamp: the Indian Space Research Organisation, ISRO. PSLV, GSLV, and the upcoming GSLV Mk III have flown from the same two pads at Sriharikota since 1993. When the government created the Indian National Space Promotion and Authorisation Centre, IN-SPACe, in June 2020, the explicit goal was to break that monopoly. Funding followed: India’s private space sector pulled in roughly $353 million from 2020 through 2024, with another $150 million in fiscal 2025, and the startup count climbed from a handful to more than 200 (Financial Express, 2026).

What was still missing was a proof of orbit. Suborbital hops like Vikram-S in November 2022 showed that a private firm could build a rocket and reach space. They did not show that one could deliver a payload to a precise altitude and inclination. Vikram-1 closes that gap. With Mission Aagaman complete, Skyroot joined SpaceX and Rocket Lab in the United States and LandSpace’s Zhuque-2 in China as the only commercial operators to have reached orbit with a privately developed first stage (Reuters, July 18 2026).

The market is large enough to make the milestone more than symbolic. India already runs one of the more aggressive small-satellite launch programs in Asia, and Chandana told CNBC that 70 to 80 percent of Skyroot’s eventual customers will sit outside India, across the United States, Europe, and Southeast Asia. A dedicated small-sat ride at roughly $15,000 per kilogram or less could undercut dedicated Electron and Taurus-Mini flights for payloads under 350 kilograms.

The two founders met at ISRO. Pawan Kumar Chandana had spent six years on Indian launch vehicle programs, mostly at the Vikram Sarabhai Space Centre (VSSC). Naga Bharath Daka had designed avionics modules for flight computers. Both studied at IIT Kharagpur. They left ISRO in 2018, raised about $1.35 million from Myntra founder Mukesh Bansal and CureFit co-founder Ankit Nagori, and registered Skyroot Aerospace on June 12, 2018, two years before any private launch regulation existed.

IN-SPACe arrived in 2020, after Skyroot had already begun carbon-fiber airframe tooling. By 2022 the company launched Vikram-S on Mission Prarambh, a suborbital flight that reached about 89 kilometers and validated roughly 80 percent of the technology stack: the all-carbon composite airframe, the solid propulsion, the thermal protection, and the avionics.

Vikram-1 took another three and a half years. The three solid stages (Kalam-1200, Kalam-250, and Kalam-100, named for missile scientist A. P. J. Abdul Kalam) each had to be static-fired at ISRO’s STEX/VAST complex at Sriharikota. The liquid Orbital Adjustment Module with its Raman engine was hot-tested at the ISRO Propulsion Complex at Mahendragiri under IN-SPACe oversight. Skyroot’s first 100 percent 3D-printed bipropellant injector ran successfully in 2020; a Raman-II hot fire at Mahendragiri ran 10 seconds in July 2023 at a chamber pressure of 8.5 bar.

The launch attempt slipped from 2024 into a 23-day window opening July 12, 2026. Chandana told CNBC-TV18 that “we have done everything that could be done to test Vikram-1 on ground.” On July 18 an automated hold extended the countdown while engineers rechecked navigation parameters; lift-off came at 12:05 PM IST, roughly 35 minutes behind the original schedule. Payload separation finished by T+900 seconds, and Skyroot declared mission success. At least one more developmental flight sits between Aagaman and any commercial manifest.

Vikram-1 is a four-stage rocket, 22 meters tall and 1.7 meters in diameter, the first orbital launcher in India built entirely from carbon-fiber-reinforced polymer (CFRP). The material choice matters because CFRP motor cases weigh roughly 30 to 50 percent less than equivalent steel or aluminum cases at the same burst pressure (Nature 2021, CFRP motor-case studies). For a small launcher, that drop translates directly into payload fraction: every kilogram saved in dry mass leaves room for a kilogram of propellant, and propellant is cheaper to deliver to orbit than structure.

The three solid motors run a typical Indian composite propellant: about 68 percent ammonium perchlorate oxidizer, 18 percent aluminum powder, and 14 percent hydroxyl-terminated polybutadiene (HTPB) binder. The first-stage casing, the Kalam-1200, is the longest monolithic composite motor built at ISRO’s Solid Propellant Space Booster Plant, 11 meters long and 1.7 meters in diameter, loaded with about 30 tonnes of propellant. The case is filament-wound at angles of roughly ±55 and ±20 degrees over the cylinder, transitioning to ±45 and 80 degrees at the domes, an arrangement tuned to balance hoop stress, axial load, and torsional stiffness. Inside the case, an EPDM rubber insulator protects the carbon fiber from 3,000-Kelvin combustion gas. Thrust vector control on the upper solid stages uses a carbon-ablative flex nozzle deflecting the throat a few degrees with hydraulic actuators.

The fourth stage, the Orbital Adjustment Module, is a cluster of four Raman engines burning monomethylhydrazine against nitrogen tetroxide (MMH/NTO), the classic hypergolic storable bipropellant. Hypergolic ignition fires the moment the two liquids touch: no spark, no igniter, no start sequence to fail. That property lets the module relight multiple times during a single mission, which is the whole selling point for rideshare flights where each payload owner wants a slightly different altitude.

The Raman engine uses 100 percent 3D-printed injector and chamber hardware. According to Skyroot, additive manufacturing cuts injector mass by roughly 50 percent and trims part count and lead time by roughly 80 percent compared with machined injector plates. A single laser powder-bed-fusion build produces the injector in one piece, eliminating several hundred discrete passages and brazed joints. That kind of simplification makes a small team viable against larger state programs.

For the sizing math: with a 1,200-kilonewton first stage, a specific impulse near 270 seconds at sea level, and a structural mass fraction in the 0.10 to 0.12 range, the ideal delta-v budget for a 450-kilometer circular orbit at 60-degree inclination comes to about 9.4 kilometers per second. The four stages roughly hit that, leaving a margin near 1.2 kilometers per second for gravity and drag losses, in line with industry norms for small launchers.

The full Vikram family still has to come online: Vikram-2 with its 3D-printed Dhawan cryogenic engine in 2027, then Vikram-3. The team is now 500 engineers, working from a 60,000-square-foot “Max-Q” campus in Hyderabad that the company describes as the largest private rocket development facility in South Asia. Investment caught up in May 2026, when Skyroot became India’s first space-tech unicorn at a $1.1 billion valuation after a $60 million round that included GIC, BlackRock, Sherpalo Ventures, and Playbook Partners.

The wider lesson is structural. India did not get a private space industry by accident; it got one by writing rules, opening access to shared test stands, and waiting long enough for the engineering to mature. The flight on July 18 was a scheduled checkpoint on a plan that started in 2020, not a surprise ending. Other countries will study whether that same sequence (regulator first, infrastructure second, orbital capability third) can run faster in their own markets. That question will probably matter more than Vikram-1 itself.


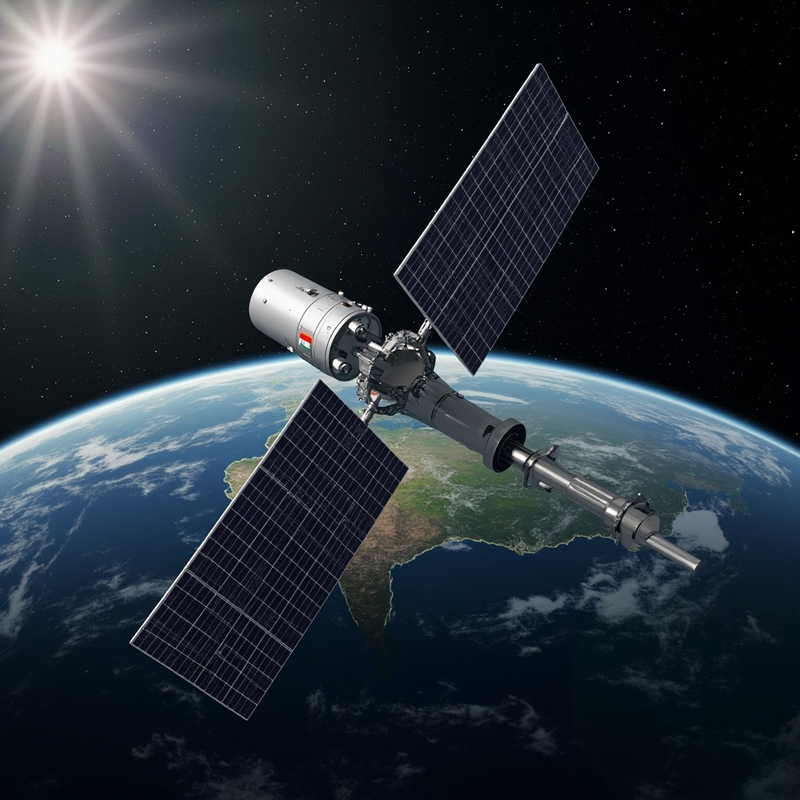
ISRO's EOS-05 (GISAT-1A) hyperspectral Earth observation satellite parked at geostationary altitude 36,000 km above the equator, its 700 mm Ritchey-Chrétien telescope pointed nadir at the Indian subcontinent below — visualized as a false-color hyperspectral data cube across VNIR and SWIR bands.


At 02:55 Indian Standard Time on 4 September 2026, the seventeenth operational Geosynchronous Satellite Launch Vehicle — GSLV-F17 — cleared the second launch pad at Sriharikota with a 2,368-kilogram payload, lit its indigenous cryogenic upper stage, and pushed India’s heaviest geostationary passenger into a sub-geosynchronous transfer orbit eighteen minutes later (ISRO mission brochure, August 2026; Wikipedia EOS-05). What makes that routine sentence matter is what the payload is. EOS-05, also known as GISAT-1A, is the first hyperspectral Earth-observing imager ever stationed at geostationary altitude. From roughly 36,000 km above the equator it can sweep the entire Indian landmass every thirty minutes at 42 m resolution and revisit a selected field every five minutes — a cadence no low-Earth-orbit constellation can match for fast-moving hazards.

What changes because of this is the temporal resolution of what India can see. Until now, the country’s civilian Earth-observation stack lived mostly at 600 to 800 km on the IRS series and on a small number of dedicated weather satellites. EOS-05 folds two things into one geostationary platform: near-real-time imaging, and the hyperspectral imaging no civilian operator has flown from GEO before. The combination has no current peer. From 35,786 km, 414 spectral channels are now listening to the subcontinent across visible, near-infrared and short-wave infrared bands, watching floods, fires, crop stress and industrial plumes as they happen rather than as a satellite passes overhead.

The history behind the launch matters. The first GISAT was meant to do exactly this. On 12 August 2021, GSLV-F10 lifted off from the same Sriharikota pad with the 2,268 kg GISAT-1 and its cryogenic upper stage failed to ignite; the satellite burned up over the Bay of Bengal (The Wire, August 2021). ISRO rebuilt the cryogenic engine programme, re-qualified the Cryogenic Upper Stage, and quietly prepared a near-twin spacecraft with refinements drawn from five years of post-failure analysis. EOS-05 carries the same 700 mm Ritchey–Chrétien telescope and I-2K bus as the lost satellite, with upgraded detector thermal control and a more capable onboard formatter. When the same rocket class that failed in 2021 succeeded on 4 September 2026, it completed a five-year recovery that almost no one outside India’s space programme was watching.

What the rocket did after lift-off tells the harder part of the engineering story. GSLV-F17 did not drop EOS-05 at geostationary altitude. It dropped it into a low sub-GTO at around 171 km, a parking orbit deliberately chosen to keep the cryogenic upper stage’s burn time short (Wikipedia EOS-05). From there, the spacecraft used its own apogee motor in three burns over 5, 6 and 7 September to climb to its operational 35,786 km × ~35,786 km geostationary orbit. The two longest burns on 5 and 6 September totalled roughly 5,406 seconds — ninety minutes of cumulative thrust — raising apogee from 20,000 to 31,129 km and then to 35,786 km in stages. This is the standard GEO playbook, but EOS-05 is the heaviest payload GSLV has ever pushed through it.

The optical design is what makes the instrument special. A 700 mm Ritchey–Chrétien primary is small by ground-astronomy standards — Hubble’s mirror is 2.4 m — but it is the largest aperture ISRO has ever flown for Earth observation. From 36,000 km, diffraction-limited resolution scales linearly with aperture and inversely with wavelength, so the trade-off comes down to where you point your photons. EOS-05 splits the available light three ways. The multispectral Visible and Near-Infrared (MX-VNIR) channel uses six broad bands from 0.45 to 0.875 μm and lands at 42 m ground sample distance — the finest spatial resolution any imaging payload has ever delivered from geostationary orbit. The hyperspectral VNIR (HyS-VNIR) channel splits the same window into 158 narrow slices from 0.375 to 1.0 μm at 318 m. The hyperspectral Short-Wave Infrared (HyS-SWIR) channel runs from 0.9 to 2.5 μm across 256 bands at 191 m. Adding 158 and 256 gives 414 hyperspectral channels; with the six multispectral bands stacked on top, the total detector count exceeds 420.

The reason that matters is spectroscopy. A multispectral imager sees colour; a hyperspectral imager sees chemistry. Mineral dust has a different spectral signature than volcanic ash; healthy vegetation has a sharp red-edge near 0.7 μm; a chlorinated industrial plume absorbs differently than a hydrocarbon one. From low Earth orbit, agencies have done this for decades — NASA’s Hyperion on EO-1, ESA’s EnMAP, the Italian Space Agency’s PRISMA hypersatellite — but those satellites revisit a given point every few days at best. EOS-05 is the first time the world has had that chemical sensitivity continuously, watching one continent, refreshed every thirty minutes. A cyclone making landfall on the Odisha coast, a methane plume from a gas flare in Assam, a crop pest outbreak spreading through Punjab — all become things that can be detected within a single orbit of the satellite above.

The engineering trade-offs behind those numbers come down to two constraints. First, photon budget: a 700 mm mirror at 36,000 km gathers roughly the same per-unit-area flux as a small ground telescope, and the satellite stares at any given scene for tens of seconds rather than the milliseconds a LEO sensor collects per pass. The HyS-SWIR bands pay for that penalty with coarser spatial resolution (191 m instead of 42 m) and wider spectral slices. Second, thermal stability: a hyperspectral detector must hold its wavelength calibration to a fraction of a band over hours of stare time, so EOS-05 carries a closed-cycle cooler that pins the SWIR focal plane near 150 K. Without it, the 256 SWIR channels would smear into noise within minutes of eclipse exit.

What this changes is the cadence of Indian disaster response and agricultural monitoring. The Indian National Disaster Management Authority, the Indian Agricultural Research Council, and state forest departments will receive a continuous stream of 42 m imagery refreshed every thirty minutes over the entire country — a temporal density no civilian operator on Earth could match from GEO before this year. The same data feeds weather models through cloud-motion winds and aerosol optical depth retrievals that no other geostationary weather satellite can currently produce, because none of them carry hyperspectral imagers. The six-band MX-VNIR will provide what the older INSAT-3DR can only approximate in coarse thermal IR; the 414 hyperspectral channels will provide what the LEO hyperspectral fleet cannot — continuity.

Two other satellites are still on ISRO’s drawing board for the GISAT series — GISAT-2 and a planned third. For the next few years, EOS-05 will sit alone at 36,000 km, pointing its 700 mm mirror at one subcontinent, and rewriting what Earth observation means when you can watch a country breathe.


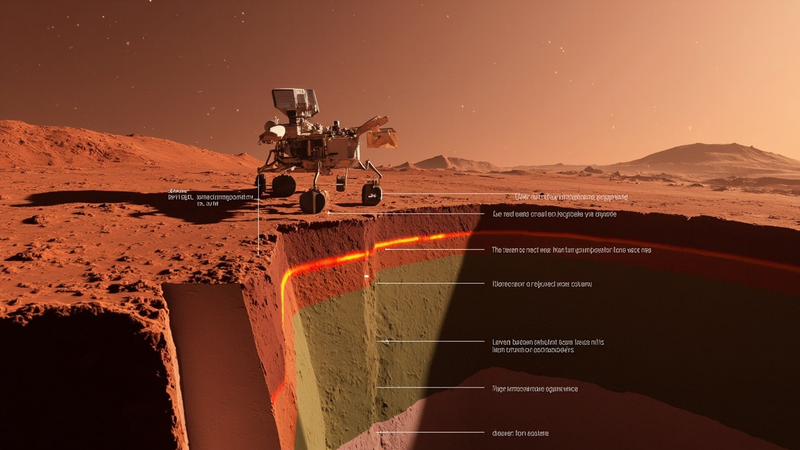
Cross-section of the Martian interior beneath the InSight lander: rust-red regolith above a 24-kilometer-thick basaltic upper crust, a sharp chemical discontinuity shown as a glowing orange line, and an olive-grey ultramafic lower crust descending into the mantle — all under one unbroken stagnant-lid shell.


A seismometer about the size of a basketball, planted on the Martian surface in late 2018, has just handed Earth-bound geophysicists a result that overturns a thirty-year assumption about how rocky planets assemble their crust. Nested inside the tremor record from NASA’s Interior Exploration using Seismic Investigations, Geodesy and Heat Transport (InSight) lander, a team at the University of Oxford has identified a chemical boundary roughly 24 kilometers below the Martian surface that looks suspiciously like the differentiated roots beneath Earth’s volcanic arcs. The implication, published this summer in Nature Astronomy, is that Mars once ran something close to Earth’s transcrustal magmatic systems — without any of the moving plates that geologists have long treated as a prerequisite for that level of crustal complexity (Mackay-Champion et al., Nature Astronomy, 2026).

Why this matters goes well beyond a footnote about Martian geology. If a planet with a single, unbroken lithospheric shell can still drive large, long-lived systems of melt accumulation, crystal settling, and chemical differentiation across its crust, then the basic recipe for building “evolved” crust does not require plate tectonics at all. That has direct consequences for how researchers rank the habitability of rocky exoplanets around other stars: a planet need not have a subdivided, mobile lid to keep its interior hot, recycle volatiles into the crust, and supply surface chemistry for billions of years of geologic time (University of Oxford press release, 24 June 2026).

The story that produced the result starts with InSight’s touchdown in Elysium Planitia on 26 November 2018. The lander deployed SEIS — a three-axis broadband seismometer built by CNES with contributions from IPGP and the Max Planck Institute for Solar System Research, weighing roughly 30 kilograms including its wind and thermal shield — directly onto the regolith using a small robotic arm. For the next four Earth years, until dust on the solar panels throttled power generation and ended nominal operations in late 2022, the instrument listened for marsquakes and the rumble of distant meteoroid impacts, gradually assembling a seismic catalog that geophysicists are still mining (Banerdt et al., Nature Geoscience, 2020). By mission end SEIS had recorded more than 1,300 candidate events distributed across the planet, the bulk of which were the high-frequency surface waves generated when mid-sized space rocks punched through the thin Martian atmosphere and detonated at the surface. What the new study does is take that catalog back to a question that has hung over Mars geophysics since the Viking era: what does the boundary detected by earlier receiver-function analyses, sitting somewhere between 20 and 30 kilometers depth, actually represent? Older interpretations ranged from a layer of frozen groundwater to a contact between volcanic flows and older basement rock. The Oxford group, led by Tobermory Mackay-Champion (now at the University of Bristol) with co-authors Mike Kendall and Jon Wade, reframed the question. They asked whether the discontinuity could be matched by a change in bulk rock chemistry rather than by an abrupt change in porosity or fluid content — and they did it by treating the receiver functions as a chemical assay rather than a structural one.

To answer that, the team assembled hundreds of plausible mineral assemblages — basaltic, andesitic, ultramafic, and exotic carbonatitic end-members — and ran each through thermodynamic equilibrium calculations at Martian crustal pressures and temperatures to determine stable mineralogy. They then predicted the seismic velocities those mineralogies should produce, using the standard relation V_p = sqrt((K + 4*mu/3)/rho) for compressional-wave speed, where K is the bulk modulus, mu the shear modulus, and rho the rock density, and the analogous V_s = sqrt(mu/rho) for shear. Because each mineral has a different temperature- and pressure-dependent stiffness, two compositionally distinct layers can have measurably different Vp/Vs ratios even at the same average density — and that is the lever the new study is pulling. Comparing those predictions with the actual P- and S-wave travel times picked out of marsquake and impact waveforms, the team found that the signal was systematic rather than scattered. The match that best explained the velocities above and below the boundary amounted, in plain terms, to a chemical sandwich. Below roughly 24 km, the seismic properties fit ultramafic assemblages dominated by olivine and low-calcium pyroxene — rocks high in iron and magnesium, low in silica, with densities around 3,200 to 3,300 kilograms per cubic meter. Above the boundary, the velocities matched basalt-like mafic compositions: higher silica, plagioclase-rich, with densities closer to 2,900 kilograms per cubic meter. The transition is on the order of a five to ten percent jump in Vp and a sharper change in Vp/Vs — the exact fingerprint you would expect if a deep cumulate pile sat beneath a more differentiated upper crust (Phys.org coverage of Mackay-Champion et al., 2026).

The way Earth geologists read that pattern is by analogy with what happens beneath active volcanic arcs on our own planet. A magmatic system that persists across the whole thickness of the crust tends to leave a chemical stratigraphy behind in its cooled roots. Dense, primitive cumulates settle out at depth; buoyant, silica-enriched differentiates rise through buoyancy-driven flow. What you end up with is a basalt-rich upper crust sitting on top of an ultramafic residue — exactly the layering the InSight data imply at the Martian mid-crustal discontinuity, except that on Earth the pattern is usually sustained for tens of millions of years by the steady down-going flux of subducting oceanic slabs. On Mars there is nothing sliding under anything.

The constraint that gives the result its bite is horizontal scale. The receiver functions that defined the 24 km boundary stacked across multiple marsquakes recorded at the same lander over several years, with the same converted-phase polarity and amplitude showing up across the catalog, which means the boundary must be laterally continuous over hundreds, possibly thousands, of kilometers across the northern lowlands (Khan et al., JGR Planets, 2023). Combined with the velocity match, the most parsimonious reading is a transcrustal magmatic system of the kind Earth hosts beneath the Andes or the Cascades — but operating within a stagnant lid, where heat is lost by conduction through the lithosphere rather than by advection in subduction zones.

What this changes looking forward is partly about Mars and partly about every rocky world sitting in the temperate zones around other stars. The classical assumption that habitability requires plate tectonics to recycle carbon, water, and other volatiles through a long-lived surface-interior cycle is no longer looking ironclad. A planet can plausibly keep its crust chemically active for billions of years through a different engine — one driven by mantle plumes, heat-pipe volcanism, or stagnant-lid overturn — that does not depend on a moving lid. The next two decades of exoplanet science — the era of the Nancy Grace Roman Space Telescope coronagraph, JWST atmospheric spectra of rocky habitable-zone targets, and eventually thirty-meter-class ground-based reconnaissance that may pick up volcanic outgassing signatures directly — will inherit a rubric where internal dynamics are an axis of habitability, but not the same axis as Earth’s. The next Mars geophysics flagship, be it a network mission like the proposed FSSM/Seismic Mars or a geodetic successor to InSight, will be designed to ask a follow-on question that the single-station SEIS catalog could not: how many such layers are there, and did the chemistry of the upper crust keep evolving through the Hesperian and into the Amazonian, or did the transcrustal engine shut down a billion years ago? Mars, in this reading, looks less like a frozen failed Earth and more like a different successful one — a planet that ran a long-lived chemical factory without ever needing to crack its lid.