
OrbitalHub

Where curiosity reaches escape velocity.

Domain is for sale. $50,000,000.00 USD. Direct any inquiries to contact@orbitalhub.com.

Archive for October, 2026


Argonne's hard X-ray nanoprobe at beamline 26-ID at the Advanced Photon Source: a multimodal LLM agent's chat panel on the left, the synchrotron X-ray nanoprobe illuminating a microchip in the center, and a ptychographic reconstruction on the right showing the interface between two doped regions of a microchip in false-color orange-red and teal-blue.

A microchip sat on the stage of beamline 26-ID at Argonne National Laboratory on a Tuesday in early October. Instead of guiding a motorized stage through a hand-scripted raster, a researcher typed “find the interface between these two regions” into a chat box. A software agent read the instruction, parsed a freshly reconstructed X-ray image, picked a new point on the sample, asked the beamline to move there, looked again, and decided on a third step. After a handful of those scan-reason-move cycles, the agent locked onto the boundary the user wanted and switched itself into a higher-resolution scan mode. No operator wrote Python. The human in the room just talked to the microscope.


That experiment, run at the joint Center for Nanoscale Materials and Advanced Photon Source hard X-ray nanoprobe in the first week of October 2026, is the first time a working agentic AI has steered a synchrotron beamline end-to-end through natural language. The team behind it, drawn from Argonne, Lawrence Berkeley, Brookhaven, SLAC, and Oak Ridge national laboratories, is calling the broader effort SYNAPS-I, short for Synergistic Neutron and Photon Science–Intelligence, and plugging it into the Department of Energy’s Genesis Mission as a flagship demonstration of what an AI-augmented user facility can look like in 2026 (Argonne, October 5, 2026).

For most of the synchrotron’s seventy-year history, the bottleneck at a beamline has not been the X-ray source. It has been the human at the controls. A modern storage ring like the APS sends electrons whirling at seven gigaelectronvolts through a 1.1-kilometer ring of bending magnets, where they shed X-rays bright enough to resolve features a few nanometers across. The catch is that the data deluge starts the moment the shutter opens. At 26-ID, a single experiment at a third-generation nanoprobe writes millions of ptychographic diffraction patterns in a few hours, and every pattern needs a heavy iterative computation to turn back into a usable image. Without live reconstruction, the team on shift has to choose what to scan on the basis of intuition and a coarse preview, then fly home and discover, days later, that the region of interest was three millimeters to the left the whole time.

The SYNAPS-I project, launched in 2025 and led out of Lawrence Berkeley, set out to change that ratio. The first phase, publicly reported in April 2026, replaced the slow offline reconstruction with a real-time engine. The engine, a fine-tuned 2D vision transformer the team calls PtychoFM, ingests raw diffraction patterns as they stream off the detector and returns a reconstructed phase-and-magnitude image in seconds (Argonne, April 2026). The math itself is well understood: a coherent X-ray beam is scanned across the sample in overlapping circles, and the resulting diffraction patterns are stitched together in Fourier space using a difference-map or gradient-descent solver. What PtychoFM adds is a learned prior, a model trained on enough examples that it can skip most of the iteration and guess a plausible reconstruction from a single forward pass, then refine it on the fly as more data arrives. For a beamline scientist, that turns hours of post-experiment waiting into a real-time video feed of structure under the beam.

The second phase, announced in early October, is what made the headline demo possible. The team wrapped PtychoFM in an agentic layer that uses a multimodal large language model as its decision-maker, alongside Meta’s Segment Anything Model 3 (SAM3) as its image-segmentation eye. The agent reads each new image, calls SAM3 to label the structures it sees, and reasons about what to do next in plain English — or rather, in plain tokens. “Agentic AI solves this by interpreting the images reconstructed in real time by PtychoFM, our ptychographic model, leveraging the vision capability of a multimodal large language model,” said Ming Du, an Argonne computational scientist on the SYNAPS-I team, in the October release. The architectural pattern is now familiar from the wider AI world: an LLM plays the role of a slow, generalist planner, a smaller specialist model handles perception, and a set of tool calls translate decisions into beamline commands. Here the tools are the motor controllers of a nanoprobe stage and a reconstruction pipeline running on the Argonne Leadership Computing Facility.

The integration was not trivial. SAM3 is a foundation model of non-trivial size, and the team needed it available to every beamline in the DOE complex rather than baked into one workstation. The Argonne Leadership Computing Facility stood up a cloud-style inference service, the ALCF Inference Service launched earlier in 2026, and the SYNAPS-I team plumbed SAM3 into it. From the agent’s point of view, segmentation is a function call. From the operator’s point of view, asking the beamline “what’s at this spot?” and getting a labeled map back is now as cheap as a chat reply.

The microelectronics demo that closed the October announcement was deliberately mundane. The interface between two doped regions in a chip is a classic defect-investigation target; in 2026 it is also a target that is genuinely hard to localize across devices, because process variation shifts the boundary unpredictably from wafer to wafer. Aileen Luo, the Argonne assistant computational scientist who led the ptychography-model work, framed the result this way: real-time reconstruction “changes the way experiments are performed, enabling researchers to adjust measurements on the fly instead of discovering key features they missed after the experiment has ended” (Argonne, October 2026). The agentic layer extends that loop by closing it. The microscope now decides what to scan next, not just what it has already seen.

What changes because of this is not the physics. The X-ray wavelength, the optics, the sample stage, and the math of ptychographic reconstruction are all the same as a decade ago. What changes is the operator. A graduate student who used to spend a year learning EPICS control scripts can now describe what they want in a sentence and spend the saved time on the science. That is the same labor-shifting move that swept structural biology when cryo-EM got its own AI denoisers, and astronomy when adaptive-optics pipelines learned to schedule themselves. Beamlines are next. By 2030 it is reasonable to expect that a substantial fraction of routine scanning at a synchrotron user facility will be conversational: the operator sets a goal, the agent handles the geometry, the human reviews the result and asks for the next scan.

The cleverness here is mostly plumbing. PtychoFM does the hard imaging work. SAM3 does the segmentation. A multimodal LLM does the planning. The novelty of SYNAPS-I is that Argonne, Berkeley, Brookhaven, SLAC, and Oak Ridge wired those pieces into the same end-to-end loop on a working beamline, and the Department of Energy underwrote it through Genesis. That is harder to copy than any single model. It is also more useful.



Layered bedrock in a crater within Arabia Terra on Mars, captured by HiRISE aboard Mars Reconnaissance Orbiter and released September 28 2026.


A new overhead image of a Martian crater floor shows branching ridges of pale bedrock winding between darker, dust-floored troughs, an arrangement that looks more like a coral reef than a piece of the red planet. The picture was captured by the High Resolution Imaging Science Experiment, HiRISE, aboard NASA’s Mars Reconnaissance Orbiter and released on September 28, 2026, by HiRISE co-investigator Cathy Weitz of the Planetary Science Institute (Space.com photo of the day for September 28, 2026; Daily Galaxy, September 28, 2026). The terrain sits inside the Arabia Terra region, a vast upland that many planetary geologists regard as one of the oldest, most heavily cratered provinces on Mars. The shapes in the image are not biological. They are layered sedimentary rocks that have been eroded into ridges and pits, and the way those layers repeat across many craters is what makes the image worth a second look. For viewers who only know Mars as a smooth red dot in the night sky, the picture is a reminder of how much texture the planet keeps when you look closely.

What Arabia Terra offers is a stratigraphic archive. Each thin band visible in the rock records a moment in Martian climate history, and the bands stack one on top of another across hundreds of meters of relief. The rhythmic nature of those layers is the whole point. A repeating pattern across a region this large does not arise from one storm, one flood, or one impact; it implies a process that pulsed on and off again and again. The MRO camera that took the picture has been in orbit since 2006, and HiRISE has been returning 25-centimeter-per-pixel images of the Martian surface for almost the entire mission. With more than 100,000 images already on the public catalog, the September 28 release is not a new instrument result. It is a fresh reminder that some of the strongest evidence for an active, water-influenced early climate on Mars has been sitting in the MRO archive for years, waiting for someone to look at it with the right question. The 100,000-image mark was passed in October 2025 on the Syrtis Major plains, and the camera has continued adding observations since.

The deposits were first described as a regional phenomenon in a 2020 paper in JGR Planets by Stack and colleagues (Stack et al. 2020, JGR Planets), who used a combination of HiRISE stereo topography and mineral mapping from the Compact Reconnaissance Imaging Spectrometer for Mars (CRISM) to show that the layered rocks in many Arabia Terra craters share a common stratigraphy. Their preferred explanation was groundwater-fed evaporitic deposition, where water just below the surface cycled up, evaporated, and left behind minerals and fine sediments in regular layers. Lewis and colleagues at the California Institute of Technology had already noted in 2014 (Lewis et al. 2014, JGR Planets) that the rhythmic layering in this part of Mars matches the patterns left by air-fall dust and ash on Earth, which alternate under the influence of orbital cycles. Weitz’s own commentary for the new picture pulls those threads together. The layers are rhythmic, they are widespread, and the most plausible global drivers on Mars are dust storms and groundwater, not isolated local events. Crater counts performed by the same group suggest the layered sequence accumulated mostly during the Hesperian period, roughly 3.0 to 3.7 billion years ago, with the topmost beds stretching into the Amazonian, which is the ongoing geologic era on Mars and the one in which the planet lost most of its surface water. Earlier work by Fergason and Christensen in 2008 had already used thermal imaging to flag the same layered terrain as a candidate record of dust-driven deposition, and the 2020 paper builds on that line of argument.

The image itself is about five kilometers across. The bright ridges are bedrock that has resisted erosion longer than the surrounding material. The darker, bluer-looking troughs are a mix of wind-blown sand and what HiRISE team members call aeolian ripples, the same kind of sand patterns that form under persistent winds in terrestrial deserts. The pits, jagged edges, and crenulated rims the image shows are not the original shapes of the rock. They are erosion scars. Each one marks a layer that has been removed and a layer that has not. The contrast between the two tones is a function of the difference in composition and grain size between the original sediment that hardened into rock and the loose debris that fell on top of it later. HiRISE resolves these textures because it images through three separate color filters and stitches them together; the false-color composites that the team releases are designed to make compositional differences pop, which is why a single scene can look bluish in some places and pinkish in others. HiRISE itself is a 0.5-meter reflecting telescope on MRO, and at MRO’s 250-to-316-kilometer orbit altitude it can pick out features smaller than a meter across. Most of what we know about the fine-scale stratigraphy of Mars has come from that resolution combined with stereo imaging, which lets the team build digital terrain models and measure layer thicknesses down to a fraction of a meter.

The deeper lesson is about how scientists read climate records on a planet that does not have trees, ice cores, or ocean sediment. On Earth, the story of past climate comes from layered archives in lake beds, sea floors, and ice sheets. On Mars, the same role is played by impact craters, which act as ready-made sediment traps and which subsequently get exhumed by wind. Arabia Terra is particularly worth studying because it has been around long enough to have collected material from the Noachian period more than 3.7 billion years ago, when most evidence suggests Mars had a much thicker atmosphere and liquid water on its surface. The layered deposits in the September 28 image are younger than that, but they preserve the same kind of memory. A geologist looking at the rock can read off changes in chemistry, dust load, and water availability across hundreds of millions of years.

A few things remain unsettled. The image does not confirm a single formation mechanism, and the team has been careful not to claim it does. The rhythmic pattern is consistent with several hypotheses, and the right next step is to compare the layer thicknesses and mineralogy from one crater to the next, which the 2020 Stack analysis already started. Future observations from the Mars Reconnaissance Orbiter, and eventually from missions now in development, can sample more of these layered terrains with high-resolution spectroscopy and will be able to test whether groundwater, dust, or volcanic ash dominates the mix. Until then, the picture is best read as a working document: a region that has been taking notes on Martian climate for billions of years, and an instrument still healthy enough to read those notes from orbit.


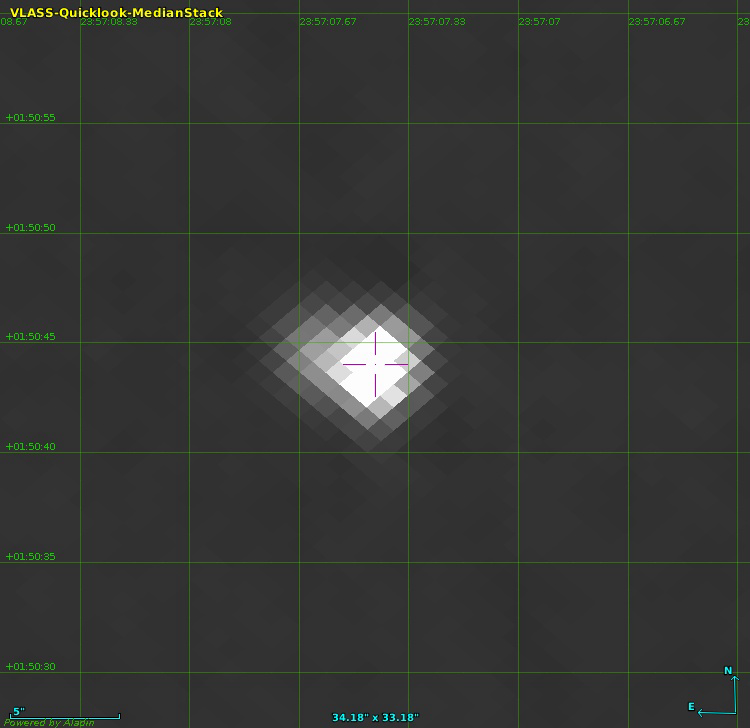
VLASS 3 GHz radio image of TXS 2354+015, with a magenta cross marking the precise optical position of the host galaxy at right ascension 23:57:07 and declination plus 01:50:45; the field of view is roughly 34 by 33 arcseconds and the bright central source is the target's compact radio core. Image: Balmaverde et al. 2026, Figure 4 right panel, retrieved from the arXiv HTML build at arxiv.org/html/2609.28632v1/VLASS.jpg.


On 18 September 2025, the European Southern Observatory’s Very Large Telescope turned its FORS2 spectrograph toward a point of sky in Pisces that no telescope had ever measured at high resolution. The target, catalogued as TXS 2354+015, had been flagged two years earlier as a candidate high-redshift radio galaxy because the optical light from its host galaxy dropped sharply between the green and red filter bands of the Subaru telescope’s Hyper Suprime-Cam. The September observations, reported by Barbara Balmaverde of the INAF Astrophysical Observatory of Turin and four colleagues in a paper uploaded to the arXiv preprint server on 23 September 2026, produced a single bright asymmetric emission line at 7220 Angstroms with an equivalent width of 900 Angstroms and a flux of just under one ten-thousandth of a billionth of an erg per square centimeter per second. That signature, confirmed by a second emission line at the wavelength expected for NV at the same redshift, fixed the source’s redshift at 4.946, a value that places the galaxy as it looked when the universe was 1.1 billion years old and the cosmic microwave background was still warm.

The result makes TXS 2354+015 the most powerful radio galaxy currently known. The team measured its intrinsic radio luminosity at a rest-frame frequency of 500 megahertz, a value long used as the standard reference for comparing radio galaxies because the emission is uncontaminated by synchrotron self-absorption at the source’s redshift. They found 6.2 times ten to the twenty-ninth watts per hertz, almost twice the previous record, held since 2008 by TN J0924-2201 at 3.22 times ten to the twenty-ninth. The new source edges past a threshold that had stood for nearly two decades, and the gain comes not from a marginal improvement but from a clean factor of two.

High-redshift radio galaxies matter because they are the most extreme manifestations of accretion onto a supermassive black hole that the early universe produces, and because the energy the jets pump into the surrounding gas regulates star formation in the host galaxy and balances the cooling of the intracluster medium in its neighbourhood. Numerical simulations of how massive galaxies grow require this feedback to match the observed galaxy luminosity function, so finding the brightest examples at the highest redshifts is a way to test how aggressive that feedback could have been at the time galaxies were assembling their first bulges. The candidate selection is also where the new paper departs from tradition: earlier searches for radio galaxies beyond redshift three relied on the ultra-steep-spectrum technique, which is biased toward one subpopulation, and the team argues that selecting candidates by their optical dropout in the red filter of the Hyper Suprime-Cam Subaru Strategic Program, the Lyman-break method, catches high-redshift radio galaxies whose flat radio spectra would slip past the steepness cut. TXS 2354+015 itself has a radio spectral slope of 0.94, well short of the steepness criterion of 1.3 that traditional searches enforce, and the authors present it as the prototype of an entire missed population.

The follow-up spectroscopy was conducted at the VLT under programme 116.28LA.001 on 18 September 2025, and the radio data were assembled from two large surveys rather than a single observation. The team used the FORS2 spectrograph with the GRIS600RI grism and GG435 blocking filter, a setup that delivers wavelength coverage from 5120 to 8450 Angstroms at a resolution of about 300 kilometres per second; they placed the slit so that it included both the target and a brighter pivot star four arcseconds to the northwest, then took two 1218-second exposures. The extracted spectrum showed a continuum below the detection threshold on the red side of the line and a sharply asymmetric emission line whose blue edge drops within a single resolution element, the canonical signature of the Lyman-alpha line from a galaxy whose neutral hydrogen is being eaten away by the intergalactic medium at that epoch, and a second emission feature at the wavelength expected for doubly ionised nitrogen at the same redshift sealed the identification. The 150 megahertz TIFR GMRT Sky Survey, produced with India’s Giant Metrewave Radio Telescope, gave the low-frequency anchor at 25 arcsecond resolution and 17.5 millijansky sensitivity, while the Karl G. Jansky Very Large Array Sky Survey gave the high-frequency anchor at 3 gigahertz, 2.5 arcsecond resolution, and 70 microjansky noise. The team cross-matched the two catalogs, looked for HSC-SSP optical counterparts within 1.5 arcseconds of the VLA positions, and selected candidates with the Lyman-break dropout signature in the red filter. The candidate that survived was TXS 2354+015, with a radio flux density bright enough to ensure a robust identification and a clean offset of just 0.2 arcseconds between the VLA and optical positions. The 3 GHz image itself, retrieved from the HTML build of the paper, shows a single compact source on a flat background, the canonical appearance of an unresolved high-redshift radio core.

The combined picture is more striking than any single measurement. The host galaxy, as seen by Subaru in the i-band, has a half-light diameter of about 5 kiloparsecs, several times larger than the typical 1.5 kiloparsec radius of a z equals five galaxy in deep-field samples, and the Lyman-alpha emission line is spatially extended over a full width at half maximum of roughly 6 kiloparsecs, consistent with the giant Lyman-alpha nebulae that are known to surround powerful high-redshift radio galaxies and that are aligned with the radio jet axis. The radio position angle, measured from a marginal Gaussian fit to the VLASS image, is 71 degrees, while the slit was oriented at minus 30 degrees, almost perpendicular to the jet, so the team’s measurement likely underestimates the true extent of the nebula. The stellar mass the team infers from the host’s mid-infrared luminosity carries an unusually long list of caveats: the WISE W1 band at 3.4 micrometres captures several emission lines at this redshift, with the brightest being the doubly ionised oxygen line at 5007 Angstroms rest frame, and extrapolating the well-known correlation between radio power and that line’s luminosity from low-redshift samples suggests a host stellar mass near 2 times ten to the twelfth solar masses, a value that would place the galaxy at the very top of the local luminosity function, but a younger stellar population would reduce the estimate by a factor of ten and better spectral energy distribution coverage is required before the number can be trusted.

The discovery will not stay unique for long. The combination of the Lyman-break dropout selection with the cross-matched radio catalogs is now a template that can be reapplied to the rest of the HSC-SSP wide field, a 1400-square-degree footprint that the team estimates contains hundreds of similar candidates. Each one will need VLT or Keck spectroscopy to confirm its redshift, but the path from candidate to confirmed high-redshift radio galaxy is now routine rather than rare, and outside coverage has already framed TXS 2354+015 as the prototype of a population that the older ultra-steep-spectrum searches missed. The implication is that the radio-loud active galactic nuclei population at z greater than four is larger, flatter-spectrum, and more energetic than the existing sample suggested, and that the brightest examples may have been hiding in plain sight in the same wide-area optical surveys that astronomers have been using to find high-redshift galaxies for the past decade. Whether TXS 2354+015 is itself unique or merely the first of a new class is the question the next round of spectroscopy will answer.


WASP-189b echoes the chemistry of its host star. Image: 2026 10 16 wasp 189b magnesium silicon.


Almost 320 light-years away, in the direction of the constellation Libra, a giant planet swings around its star in just under three days, glowing red and orange because the side that faces the star is hot enough to vaporize rock. WASP-189b is the textbook example of a class that astronomers call ultra-hot Jupiters, planets that look like Jupiter in size and bulk composition but orbit so close to their stars that their dayside temperatures climb above 2,500 kelvin, well past the vaporization point of minerals such as magnesium, silicon, and iron. New observations of WASP-189b with the Immersion Grating Infrared Spectrograph (IGRINS), mounted on the Gemini South telescope in Chile, have produced the first simultaneous measurement of gaseous magnesium and silicon in any exoplanet atmosphere, and the ratio between the two elements in the planet turns out to match the ratio in its host star. The result, published by Jorge Antonio Sanchez of Arizona State University and an international team in Nature Communications on 18 February 2026 and highlighted in a NOIRLab press release on 13 October 2026, is the first direct evidence for a long-standing assumption that astronomers have used since exoplanet science began (Sanchez et al. 2026, Nature Communications; NOIRLab press release noirlab2609).

The assumption in question is simple to state and powerful in practice. Planets form from the same protoplanetary disk of gas and dust as their host star, and the chemistry of that disk is set by the chemistry of the parent molecular cloud. The expectation, therefore, is that the relative proportions of the major rock-forming elements in a planet should match the relative proportions of those same elements in the star. In the Solar System this expectation has been borne out within a factor of about two for the rocky planets, and the small departures from a perfect match are useful constraints on the violent early history of the inner Solar System. For every other planetary system astronomers can detect, the question had to be inferred. Stellar spectra are easy to come by, because stars are bright, but exoplanet spectra are not, because exoplanets are faint, sit right next to a much brighter source of light, and are usually moving quickly through the background. Until the new WASP-189b measurement, no team had ever detected two rocky-element species in a single exoplanet at the same time, so the assumption that exoplanet chemistry tracks stellar chemistry was reasonable but unverified (SciTechDaily; ScienceDaily).

Why the magnesium-to-silicon ratio, in particular? The two elements sit at the heart of rock-forming mineralogy. Magnesium and silicon together build the silicates that make up most of Earth’s mantle, the olivine and pyroxene minerals that dominate the rocky bodies of the inner Solar System, and the iron-magnesium-silicate matrix that is the default material from which any rocky planet is expected to condense. The Mg/Si ratio of a planet, more than its absolute abundance of either element, sets the dominant mineral phases it can carry, which in turn control how easy it is for a planet to retain plate tectonics, generate a magnetic dynamo, and outgas volatiles that contribute to oceans and atmosphere. The same ratio in a star, measurable from high-resolution stellar spectra, has therefore been used for two decades as a proxy for the mineralogy of any rocky planets in that system, even ones whose spectra are beyond current reach. The WASP-189b result is the first observational check on that proxy, and it passes (NOIRLab Nuggets: Decoding Planet Origins with Gemini).

WASP-189b is a useful target for this measurement for a reason that has nothing to do with its bulk composition and everything to do with its orbit. The host star, catalogued as HD 133112, is a hot blue-white A-type star about 2.7 times the mass of the Sun. The planet is tidally locked, with the same hemisphere permanently facing the star, and its 2.7-day orbit takes it through a particularly favorable alignment called secondary eclipse, when the planet passes behind the star as seen from Earth. During secondary eclipse the planet’s own emission drops out of the combined spectrum and the star’s emission drops in, and a careful subtraction of one from the other yields the planet’s dayside spectrum in isolation. The IGRINS spectrograph, built by a consortium led by the University of Texas at Austin, Korea Astronomy and Space Science Institute, and the Korea Institute of Science and Technology, was a visiting instrument on Gemini South from 2022 to 2023 and was chosen because its near-infrared coverage and spectral resolving power are high enough to separate the planet’s individual atomic and molecular lines from the much brighter signal of the host star. The team collected a series of transit and eclipse observations of WASP-189b with IGRINS at Gemini South, then used high-resolution cross-correlation techniques to extract the magnesium and silicon lines from the planet’s contribution. The matched Mg/Si ratio was the central result (Sanchez et al. 2026, Nature Communications).

The instrumentation choice was a constraint as much as a convenience. Ground-based telescopes can deliver the spectral resolution that this kind of work requires only in narrow wavelength windows where Earth’s atmosphere happens to be transparent, and the near-infrared windows around 1.5 and 2.3 micrometers are the most productive because they sit in absorption bands of gaseous magnesium and silicon at the temperatures found in ultra-hot Jupiter atmospheres. The IGRINS spectrograph covers both windows simultaneously, which is what made the simultaneous detection possible. A more common approach in the field is to use a space telescope such as Hubble or JWST, but the trade-off is that those instruments do not have the same spectral resolving power and cannot easily separate the planet’s line from the star’s line for atomic species at high temperature. The success of the IGRINS run on Gemini South, and the fact that the instrument’s successor IGRINS-2 has now been commissioned as a facility-class instrument on Gemini North in Hawaiʻi, is a sign that high-resolution ground-based spectroscopy is on its way to becoming a standard tool for this kind of measurement, with more targets and more elements in the coming years.

A practical consequence of the result is that the long list of rocky exoplanet host stars whose Mg/Si ratios have already been measured, mostly by ground-based stellar surveys, can now be used with more confidence to predict the mineralogy of any rocky worlds in those systems. The assumption is no longer just a reasonable extrapolation from Solar System chemistry. It is a tested prediction, validated for one of the hottest and most alien gas giants in the catalogues, and almost certainly applicable, to a close approximation, to cooler and more temperate planets that no instrument yet exists to measure directly. For astrobiologists in particular the result closes a methodological gap: the standard practice of using a star’s elemental makeup to estimate the geochemistry of its planets, and through that the suitability of those planets for plate tectonics, magnetic fields, and long-term habitability, is now backed by direct observation rather than by an unverified assumption.

The IGRINS-2 commissioning on Gemini North, and the parallel development of other high-resolution spectrographs for the upcoming extremely large telescopes, suggest that the WASP-189b measurement is the first of a series rather than a one-off. The next steps are likely to involve measuring additional ultra-hot Jupiters with comparable precision, extending the technique to cooler gas giants and Neptune-class planets where the chemistry is more complex, and eventually applying the same kind of cross-correlation analysis to rocky planets around small stars, where the same Mg/Si assumption will need to be tested under different conditions. None of that happens quickly, and the WASP-189b result will remain the cleanest single demonstration of the principle for some time, but the door it opens is the same one that exoplanet science has been pushing on for the past two decades: turning stellar spectra, which are easy to obtain, into statements about planetary interiors, which are not.


The IonQ trapped-ion system architecture, where surface-code syndromes from a chain of barium ion qubits are routed to a classical decoder that has to keep pace with each gate cycle


On 22 September 2026, IonQ researchers posted a paper that quietly removes one of the most stubborn bottlenecks in quantum computing. Nicolas Delfosse, Min Ye, and Andrii Maksymov showed that a real-time decoder for fault-tolerant quantum error correction can run end-to-end on a single commercial CPU — specifically a 12-core Apple M4 Max laptop chip (arXiv:2608.25027). The benchmark held 408 logical qubits alive across more than a million T gates while adding only 0.02 percent of “stretch” time on top of the quantum run. Until now, every credible demonstration of a useful fault-tolerant quantum computer assumed a fleet of FPGAs, custom silicon, or beefy GPU clusters babysitting the qubits in real time. IonQ just argued, with measurements, that one is enough.

That claim matters more than it sounds. Quantum error correction has been the field’s longest-running promise and its largest engineering gap. A physical qubit loses coherence in microseconds; without constant repair, no useful computation finishes. The standard fix — a surface code — spreads each logical qubit across hundreds or thousands of physical qubits, measures parity checks (“syndromes”) between them, and feeds the syndrome stream to a classical decoder that has to guess which physical qubit flipped and push a correction back before the next gate fires. The classical side has to keep up. If decoding lags behind the quantum cycle, the quantum computer idles. If decoding fails, the logical qubit decays. This real-time constraint has shaped every architecture choice since Peter Shor introduced the first quantum code in 1995 and John Preskill coined the term fault tolerance four years later.

What IonQ did, in plain engineering terms, was throw out the assumption that fault tolerance requires exotic hardware. The team benchmarked a decoder on a workload they call MegaQuOp: roughly a million quantum operations, the threshold at which any algorithm starts to do something useful. Their dual-decoder architecture runs simultaneously on the memory blocks where logical data lives and on magic-state factories where the resource states that produce T gates are distilled. On a trapped-ion machine with a 1–5 millisecond cycle time — slower than superconducting systems but far cleaner per operation — the decoder finished its work in tens of microseconds per round, leaving the qubits essentially idle for the rest of the cycle.

The benchmarks themselves were a tour of the workloads any fault-tolerant computer will face. One was a measurement-induced phase transition circuit: 40 layers of random two-qubit gates compiled into Clifford and T gates at an average cost of 538 T gates per random gate, producing more than a million T gates across 102 logical qubits (arXiv:2608.25027, Tables I–IV). Another was a single sixth-order Trotter step of a disordered Heisenberg model: 64 sites on 102 logical qubits, then 266 sites on all 408. These are not synthetic stress tests; they map onto the early problems a useful quantum computer will tackle — chemistry, materials, condensed-matter simulation. Running them in real time, on commodity silicon, is the kind of result that moves a roadmap from “lab demo” to “engineering project.”

The decoder IonQ used is a variation on the minimum-weight perfect-matching (MWPM) algorithm that has dominated surface codes since Daniel Gottesman published the foundational results in 1997. Each syndrome measurement is a small piece of evidence about where an error happened; the decoder has to connect those pieces into consistent error chains and infer the most likely physical failure. The classical challenge is that the matching problem scales superlinearly with the number of qubits and gates, and the latencies required are measured in microseconds, not milliseconds. The way IonQ kept it tractable was to use a fast, sparse-graph formulation and to split the workload between two decoders running in parallel — one for memory, one for factory — so neither saturates the CPU. The result is a workload that fits comfortably on a 12-core laptop, with cores to spare.

This is also why the “single CPU” claim is not a marketing trick. The alternative — running the decoder on a rack of FPGAs, or on a dedicated ASIC, or on a GPU cluster — has been the design choice at IBM, Google, and Quantinuum. Each approach works in a lab. Each one also adds cost, power, and integration risk at exactly the moment the industry is trying to scale from hundreds to thousands of logical qubits. IonQ is betting that trapped-ion hardware, with its longer cycles and cleaner qubits, lets a conventional CPU do the work that other architectures have had to throw specialized hardware at. If the bet holds, the unit economics of a fault-tolerant machine shift sharply: the classical co-processor stops being a separate procurement line and starts being a server in the rack.

The result lands inside IonQ’s broader architectural plan, the Walking Cat scheme for fault-tolerant trapped-ion computing. Walking Cat is the company’s response to one of the hardest problems in the field: ion traps do not scale the way superconducting lattices do, because all the ions in a trap see the same control fields. Walking Cat threads the qubits through a chain of zones — memory, factory, measurement — moving them physically between regions while the controller keeps the surface code coherent. A lightweight decoder that fits on a CPU is a precondition for that scheme, because every zone transition generates syndromes that have to be processed before the next move. The 408-qubit benchmark is, in effect, the first measurement that says this scheme is implementable at scale.

What changes because of this. The next twelve months in fault-tolerant quantum computing will look different than the last twelve. Demonstrations that used to require a roomful of custom electronics will fit on a workstation; university groups will be able to reproduce them without privileged access to ASIC foundries. For IonQ, the result is a public milestone on the path from 256 physical qubits to “industrial-scale platforms controlling thousands of qubits,” to use the wording of the company’s 22 September announcement. For the field, it is one of those rare engineering results that removes a future constraint rather than adding one. Quantum error correction is no longer waiting for hardware. It is waiting for algorithms — and that, finally, is the right order of operations.


A faint, dark, isolated Y-dwarf brown dwarf glowing dim red-brown against a sparse starfield, with translucent water-ice cloud bands swirling over its banded atmosphere, representing WISE 0855-0714 drifting alone 7.4 light-years from the Sun.


Somewhere in the constellation Hydra, about 7.43 light-years from the Sun, an object slightly larger than Jupiter and roughly twice Jupiter’s mass sits at 265 kelvins and slowly rotates, surrounded by water-ice clouds. It is the coldest known brown dwarf, a failed star with no fusion at its core, and on a single clear orbit of the James Webb Space Telescope, a team led by Brittany Miles of the University of Arizona’s Steward Observatory pointed the Near-Infrared Spectrograph at it for eleven straight hours. The result, announced on 8 October 2026 and accepted for publication in The Astrophysical Journal, is the first direct evidence that water clouds thicken and thin on a body outside the solar system. The air is moving. The weather is real. We can now watch it.

Brown dwarfs have always been a category problem. Too massive to be planets — at least thirteen Jupiter masses is the conventional lower bound — and too small to clear their neighborhoods, they are also too small to ignite steady hydrogen fusion. They glow with the residual heat of their formation, dimming visibly year over year as they radiate it away. A young T-type brown dwarf can sit at 1,500 K and look vaguely like a hot Jupiter. A middle-aged one in the L-T-Y sequence cools through a thousand kelvins and changes chemistry, with silicate and iron clouds raining out of its atmosphere at successive temperature plateaus. By the time an object reaches the Y class, somewhere below 500 K, water has frozen into clouds at the level of the photosphere, and the chemistry has become alien enough that it overlaps with what a cold, isolated gas-giant planet would look like. WISE J085510.83-071442.5, the object that Kevin Luhman first identified in the WISE survey in 2013, sits so far down the cooling track that its own temperature is below the freezing point of water. That is why astronomers care about it. It is the closest analog to a free-floating giant planet that we can see in detail (Luhman 2014, ApJ 786, L18).

The new work leans on that proximity. With a parallax of 439.0 ± 2.4 milliarcseconds measured against background quasars (Luhman & Esplin 2014), WISE 0855 is the fourth-closest stellar system to the Sun, after Alpha Centauri, Barnard’s Star, and Luhman 16. At 2.278 parsecs it is close enough that JWST can collect a medium-resolution spectrum, R ≈ 1,000, with high signal-to-noise in fifteen-minute slices across an entire rotation. The team obtained 32 such spectra, one every fifteen minutes for eleven hours, watching the same atmospheric column long enough to track features as they came in and out of view. The result is not a static spectrum. It is a movie with chemical resolution.

What they saw falls into two distinct layers. In the upper atmosphere, between roughly 1 and 4 bar of pressure, the water-ice cloud opacity oscillates. Some rotation phases show deeper, thicker clouds; others show clearer air, with the underlying gas-phase water absorption features rising into view. Below that, near 70 bar, the abundances of carbon monoxide and, in particular, phosphine (PH₃) vary in a way that does not match a quiet atmosphere. The team interprets the deeper signal as convective dredging: parcels of gas from well below the photosphere are rising, cooling, and being mixed into the visible layers, carrying with them the products of high-pressure chemistry. Phosphine, in particular, is hard to make in a cold, hydrogen-rich atmosphere at equilibrium; seeing it vary is a fingerprint of disequilibrium mixing, the same vertical transport that drives Earth’s weather but in a gas made mostly of molecular hydrogen and helium.

Why this matters is partly a question of what the older instruments could not do. Pre-JWST photometry of WISE 0855 measured the total brightness changes as the object rotated, but photometry collapses everything — clouds, chemistry, temperature — into a single flux number. NIRSpec at R ≈ 1,000 resolves individual molecular lines, so a cloud’s signature can be told apart from a chemistry change by the wavelength dependence. A water-ice cloud dims more in the continuum than in a line core; phosphine varies in a sharp, narrow band near 4.3 μm. That wavelength-resolved time series is what turns “the brightness is changing” into “the air is moving,” and only JWST has the combination of light grasp, wavelength coverage, and stability to make the measurement.

The broader payoff is the bridge the result builds between solar-system science and exoplanet science. Jupiter, the only other place where we can stare at water-ice clouds for a full rotation, has its own meteorology, and the cloud structures are different in kind — banded, with sharp shear zones and lightning-driven convection. The brown-dwarf version is slower, colder, and chemically simpler, but the physics overlaps. Carbon monoxide and phosphine chemistry in hydrogen-rich air follows the same quench kinetics, the same vertical-mixing timescales, the same temperature-dependent pathways. Modeling tools built for Jupiter’s atmosphere can be ported across. As the team puts it, the cloud-thickness modulation they see in WISE 0855 sits at pressures close to the photosphere, while the CO and PH₃ modulation sits much deeper; the two signals decouple, which they would not if a single effect were driving both. The weather is layered, the way weather here is layered.

There is a second, quieter implication. Brown dwarfs are not the only objects at this effective temperature. The directly imaged giant planets around HR 8799, β Pictoris, and a handful of other young A-stars sit at L-to-T spectral types, with brightness temperatures around 1,000 to 1,500 K. The colder, free-floating Y-dwarfs like WISE 0855 are the only objects old enough and cool enough to make the photospheric chemistry fully settled, and that makes them the closest natural laboratory for what an isolated Jupiter-mass planet would look like after it stops glowing from formation heat. The same NIRSpec time-series technique, applied to a young, hot Jupiter, will not work — the contrast against the host star is too steep — but applied to a Y-dwarf, it works because the dwarf is its own light source. If the team can repeat the measurement on a slightly warmer or slightly cooler Y-dwarf, they can map how the cloud layer’s vertical position and the convective mixing depth depend on effective temperature. That is a phase diagram of substellar weather waiting to be filled in.

For the moment, the headline is small and concrete: on one eleven-hour night, JWST watched water clouds form and dissipate on an object only 7.43 light-years away. The first exoplanet weather report, in the strict sense, is in. The next step is repetition across the Y class, where a small population of cold brown dwarfs within 20 parsecs is already known and the JWST time-allocation committee is more than willing to spend hours on them. The fields that should move fastest are the cloud microphysics of water ice in hydrogen-rich gas and the rate at which disequilibrium chemistry can reshuffle carbon and phosphorus through an atmosphere with no stellar irradiation to drive it. Both questions have been waiting, in a sense, for a Webb that could simply sit on one cold dot for half a night and watch. That wait is over.