OrbitalHub

Where curiosity reaches escape velocity.

Domain is for sale. $50,000,000.00 USD. Direct any inquiries to contact@orbitalhub.com.

Archive for October, 2026

October 17, 2026

JAXA’s MMX is finally going to Phobos

Posted by


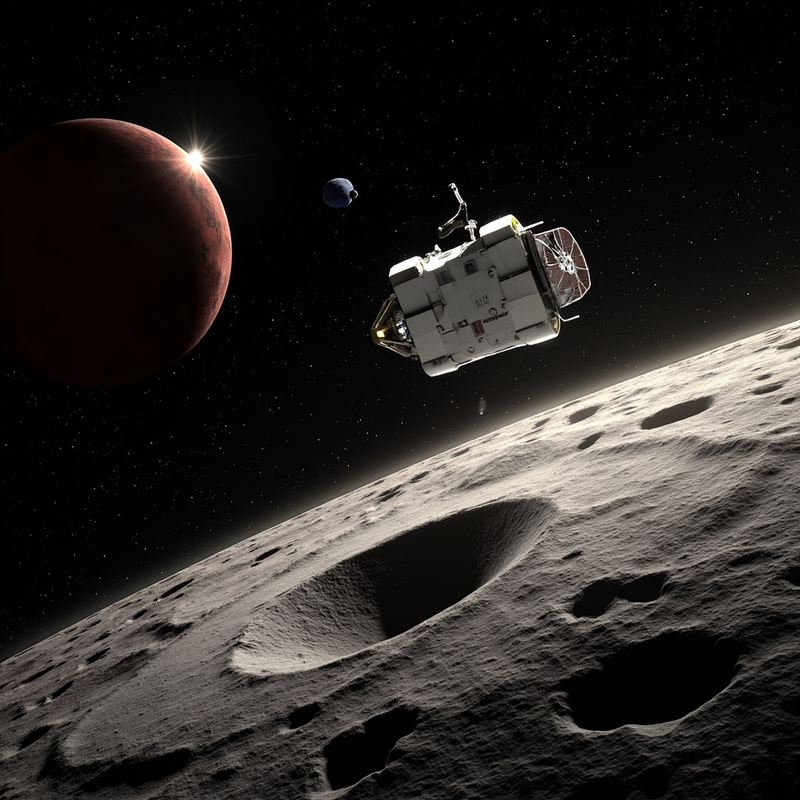
JAXA's MMX spacecraft approaching Phobos — a gray cratered body with the large Stickney crater dominating the foreground, the spacecraft three-quarter view with its high-gain antenna pointed at distant Earth, the red disk of Mars in the background, and the smaller moon Deimos as a tiny point of light nearby.

On Sunday morning Japan time, a 4,000-kilogram spacecraft will leave Tanegashima Space Center on Japan’s new H3 rocket and begin a five-year journey to do something nobody has done before: touch a moon of another planet and bring a piece of it home. The mission is the Martian Moons eXploration probe (MMX), and its destination is Phobos, a 22-kilometer rock that swings around Mars three times a day and is slowly falling inward. A small capsule will land in an Australian desert in 2031 carrying at least ten grams of alien dirt that may finally settle a sixty-year argument about where Phobos came from.


That argument is unusually clean for planetary science. Two possibilities fit the observations, and they point in opposite directions. Either Phobos and its smaller sibling Deimos are captured asteroids — dark, carbon-rich bodies pulled in from the outer main belt — in which case they should resemble primitive outer-belt material. Or they are the wreckage of a giant impact on early Mars, a process analogous to how Earth’s own Moon formed, in which case they should be dry, glass-rich, and chemically indistinguishable from Martian basalt. Existing remote sensing cannot break the tie. Phobos is too small and too dark for Earth-based spectroscopy to read its surface cleanly, and the two theories predict mineralogies that differ in subtle ways. Only a sample under a laboratory bench can decide.

That is what JAXA is sending MMX to do. Approved in February 2020 under project manager Yasuhiro Kawakatsu and shipped to Tanegashima in March 2026, the probe lifts off at 04:41 JST on 20 October 2026, 19:41 UTC on the 19th (ESA, 13 October 2026). The probe is built in three modules: a 1,800-kilogram propulsion section carrying about 1,900 kilograms of bipropellant, a 150-kilogram exploration module, and a 1,050-kilogram return module that will eventually fire its own engine, depart Phobos, and re-enter Earth’s atmosphere. The rocket is the H3-24L, the four-solid-booster variant of Japan’s flagship. The H3 failed its first two flights in 2023, and getting it back to operational status was the engineering prerequisite that made MMX possible at all.

Seven instruments ride on the main spacecraft, and four more sit on a small rover called IDEFIX that will be deployed in early 2029. NASA’s contribution is MEGANE, Japanese for “eyeglasses,” a gamma-ray and neutron spectrometer built at the Johns Hopkins Applied Physics Laboratory that reads elements like hydrogen, which cameras cannot see, to determine how much water-bearing material is present. CNES in France built MIRS, a near-infrared spectrometer for mineral identification. JAXA added a LIDAR, a dust counter to look for a hypothesized faint ring of debris around Mars, and a mass spectrometer for the local ion environment. The IDEFIX rover is a joint CNES-DLR build, weighs 25 kilograms on Earth, and will weigh the equivalent of fifteen grams on Phobos (ESA, 13 October 2026).

The path MMX will fly is itself an engineering problem. Phobos is too small for a true orbit — a satellite around the moon would be perturbed away by Mars within days. Instead, MMX will use a quasi-satellite trajectory, a Mars-centered path that lets the spacecraft stay near the moon for a full Martian year. The geometry is governed by the mass ratio between the two, about 1.7 × 10⁻⁷, which is too small to permit a stable bounded orbit around the moon. The same physics that holds objects at the L1 and L2 Lagrange points lets a spacecraft at the right distance and phase angle drift along with the moon indefinitely.

The sampling system is a second engineering story. JAXA is flying two redundant mechanisms. The first is a coring-and-shovel arm of traditional design. The second, called P-sampler, was developed by Honeybee Robotics and is the descendant of a Planetary Society-funded prototype called PlanetVac. Where most regolith samplers depend on a lander’s weight for a percussive motion, P-sampler fires pulses of nitrogen gas to stir the surface into a vortex, then sucks the cloud into a collection chamber, working whether the lander is upright, tilted, or on one footpad. PlanetVac’s path to Phobos is a parable of compounding: a 2013 lab test, a 2018 flight on Masten’s Xodiac rocket in the Mojave, a 2025 demonstration on Firefly’s Blue Ghost lunar lander, and now inclusion on MMX as a primary sample-acquisition method (Planetary Society, 14 October 2026).

The mission timeline runs five years. MMX will arrive at Mars in August 2027, enter a quasi-satellite orbit around Phobos in September, study the moon for roughly eighteen months, release IDEFIX in early 2029, and land in 2030 to collect the sample. The return module will then push off Phobos, swing past Deimos, and head home. The sample capsule is designed to land in the South Australian outback.

What MMX finds is the test. A captured-asteroid Phobos should have the spectral fingerprints of carbonaceous chondrites, with hydrated silicates and organic compounds. An impact-ejecta Phobos should look like a re-melted piece of Martian crust, dominated by olivine and pyroxene in a glassy matrix. Either answer changes planetary science. The capture scenario would re-open the question of how many small moons are interlopers rather than natives. The impact scenario would mean Mars once had a ring system that briefly rivaled Saturn’s. The samples also carry information no remote observation can read: cosmic-ray exposure age, solar-wind noble gases, the isotopic ratios that fingerprint Martian versus asteroidal origin. ESA project scientist Elliot Sefton-Nash put it simply: samples returned to Earth are “the gift that keeps on giving,” because the same ten grams will be analyzed for decades by instruments not yet invented.

That’s why Japan built this spacecraft, and why a rocket that failed its first two flights is about to carry it off the pad. The question of where Phobos came from has been the cleanest unsolved problem in solar-system science for half a century, and MMX is the cleanest possible test of it. Sunday’s launch opens the clock.
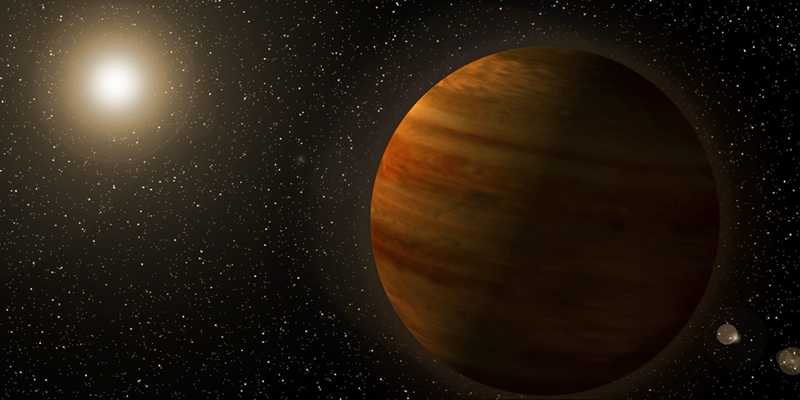


Artist's concept of the super-Jupiter Gaia23bra b, a banded gas giant orbiting its orange dwarf host star at a Jupiter-like distance. Image credit: NASA's Goddard Space Flight Center.

(image source)


A super-Jupiter twelve times farther than TESS can usually see, hiding in eight years of archived photometry, pulled out by a physics trick first described in 1936. Gaia23bra b is the first world the Transiting Exoplanet Survey Satellite has ever confirmed by gravitational microlensing, and the result quietly resets how a mission is used.

The signal was small. A background star out near the galactic plane brightened slightly as a foreground orange dwarf drifted across our line of sight. ESA’s Gaia spacecraft flagged the brightening in 2023 as a routine gravitational lensing event and dropped it in the alert stream. TESS happened to be staring at the same patch of sky, taking 27-day blocks of images for its usual transit hunt, and captured the same brightening with finer time sampling. Three years later, when Mallory Harris at the University of New Mexico pulled TESS’s archive, she noticed a tiny extra wiggle in the light curve, a five-day deviation that Gaia had missed because Gaia was sampling too sparsely. That wiggle was a planet. The paper went on the arXiv on July 1, 2026, and into The Astrophysical Journal Letters the same day (arXiv:2607.01853).

The headline number is just how far away the host system is. TESS was built to chase transits of bright, nearby stars, with its catalog reaching out to about 150 light-years. Gaia23bra b sits at roughly 40,000 light-years, deep in the galactic plane, on the far side of the galaxy’s disk from us. Detecting a planet there was not in the original mission plan, and that is what makes the result interesting.

Microlensing is the only planet-finding method that depends on distance rather than proximity to Earth. Transits need repeated passes in front of the star, so TESS sticks to bright nearby targets. Radial velocity gets harder as the star gets fainter. Direct imaging works for young planets still glowing from formation heat, typically hundreds of light-years away.

Microlensing needs only one alignment between a foreground star and a more distant background source. The foreground star’s gravity bends the background light into a brief magnifying-glass spike, and any planet orbiting the lens star leaves its own tiny extra spike on top. The alignment never happens twice. As Harris put it, microlensing events “happen once and they’re gone.”

Less than 5% of the more than 6,000 known exoplanets were discovered this way, according to NASA’s Goddard release on the result. Almost all came from ground-based surveys designed specifically for microlensing. The new detection is the first time a survey telescope built for something else has caught a microlensing planet in its own data. TESS has been staring at almost the whole sky on a rolling basis since 2018.

The find points forward to NASA’s next flagship astrophysics mission. The Nancy Grace Roman Space Telescope, currently scheduled for an August 30, 2026 launch from Kennedy Space Center, will spend one of its core surveys staring at the galactic bulge, where the stellar density makes microlensing alignments common. Co-author Michael Fausnaugh of Texas Tech, quoted in the NASA release, calls the TESS detection “a bit like a preview of the microlensing NASA’s Nancy Grace Roman Space Telescope will do.” Roman is projected to find roughly a thousand microlensing planets and a hundred thousand transiting planets across its primary mission.

The trigger was not new TESS data but the existing archive, re-read. Harris and her collaborators at the University of New Mexico, NASA Goddard, Texas Tech, and partner institutions were testing whether TESS’s short-cadence light curves contained enough information to recover microlensing signals at all. TESS full-frame images stack into 30-minute cadence products and 200-second cadence for selected targets, dense enough that a small planet-induced anomaly should be visible if you know where to look.

The team went looking in the eight-year archive for events Gaia had flagged as lensing candidates but could not resolve. Gaia23bra was a textbook case: Gaia saw the main brightening, a roughly 30-day event, but the planet’s signature sat on top as a small, sharp deviation that Gaia’s sparse sampling averaged out.

When Harris pulled TESS data for the same coordinates, the planet’s signature was sitting right there. The deviation lasted about five days and produced a measurable second-order change in the light curve that the team modeled as a second lens, in microlensing jargon, a binary-lens event with a planetary-mass companion. The recovered planet, Gaia23bra b, is roughly 1.6 times Jupiter’s mass on a Jupiter-like orbit around an orange dwarf star about 80% of the Sun’s mass. NASA’s release summarizes it as a “super-Jupiter” in a configuration the mission was not designed to find.

Co-author Diana Dragomir, also at the University of New Mexico, told the NASA press operation that “the discovery implies that there are probably other so-called microlensing planets hiding in TESS’s data that we hadn’t previously thought to look for.” Eight years of TESS full-frame images are now a searchable microlensing archive. More detections are likely; the next round of candidates is still being checked.

The Gaia side of the story closes a separate loop. Gaia finished its extended science mission earlier in 2026, ending a roughly 12-year astrometry run that produced the largest three-dimensional map of the Milky Way. Gaia23bra b is one of the last planets Gaia will help find, and shows how Gaia and TESS were complementary: Gaia’s wide-field coarse cadence for the alerts, TESS’s narrow-field fine cadence for the follow-up.

The underlying physics is the lensing effect Einstein described in general relativity. A massive object between a distant light source and an observer bends the source’s light around itself, producing two distorted images that are usually unresolved, so the source just appears brighter. A planet orbiting the lens acts as a smaller secondary mass that produces its own brief spike on top of the main brightening.

The size of that spike depends on the Einstein radius, scaling with the square root of the lens mass times the distances involved. For a stellar-mass lens halfway across the galaxy and a background source further away, the event lasts weeks, and the planet’s spike shows up over a few days, which is why the TESS team’s detection was a five-day feature on a roughly 30-day main event.

Two practical issues make the detection hard. The first is degeneracy: a single-lens fit can soak up most of the brightening, leaving a small residual that could be a planet, a stellar companion, or noise. Resolving it requires dense photometry where the planet’s signature shows up, which is what TESS provides and Gaia did not.

The second issue is the galactic-plane background. Toward the bulge and inner disk, stars are packed so tightly that a TESS pixel, about 21 arcseconds across, often contains multiple stars whose light blends together. The team’s workaround was to lean on Gaia’s catalog to decompose the TESS photometry into individual stars, then run the microlensing model on the cleaned light curve.

The Roman connection closes this loop. Roman’s Wide Field Instrument has roughly 100 times TESS’s collecting area and a pixel scale around 0.11 arcseconds versus TESS’s 21 arcseconds, which kills the blending problem for the bulge region. Where TESS catches a microlensing planet by lucky overlap, Roman runs a continuous survey of the densest lensing regions. The two missions cover different parts of the galaxy, with TESS’s strength being the rest of the galactic plane where stars are sparser.

The discovery does not change what we know about how planets form. The deeper lesson is that eight years of archived TESS photometry is now a real microlensing dataset, and the analysis pipeline used here is reproducible. Expect follow-up papers searching the TESS archive for additional Gaia-flagged lensing events with high-cadence follow-up available.

The next concrete milestone is Roman’s launch on August 30, 2026, which moves microlensing from the realm of niche ground-based surveys into a flagship-class statistics engine. Roman’s projected yield of around a thousand microlensing planets, paired with TESS’s growing archive of opportunistic microlensing detections, will start to give a real census of planets at Jupiter-like orbital distances across the galaxy. Gaia23bra b is the first data point on the TESS side of that census, and it arrived just in time for the Roman team to use as a worked example in their own planning.


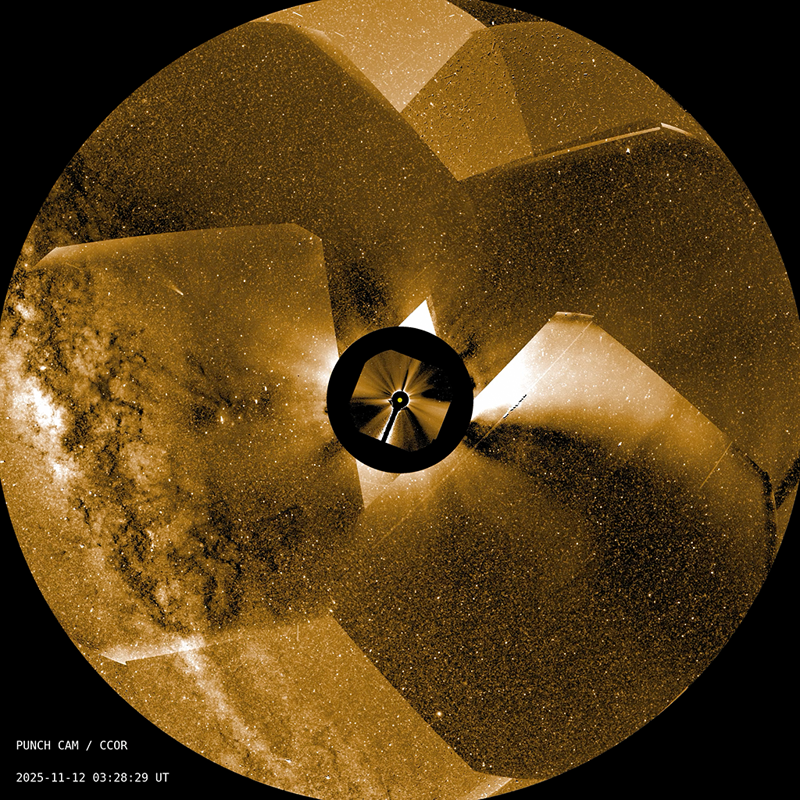
A PUNCH Wide Field Imager mosaic of the inner solar system taken on November 12, 2025, showing the Sun's corona as a glowing golden disk with the central disk blocked by the coronagraph, the Milky Way curving along the left edge, and the outlines of several large coronal mass ejections radiating outward from the occulted Sun. Image: NASA/SwRI, PUNCH mission, NASA SVS 31381.


On the morning of August 4, 2026, a heliophysics team gathered at the Committee on Space Research Scientific Meeting in a windowless conference room and ran a video. The video showed a cloud of charged plasma leaving the Sun on May 31, 2025, and then kept watching it, frame by frame, as it crossed the inner solar system. Twelve hours after the eruption, a basic tracking model settled on an arrival time. Eight hours later, the cloud actually showed up. The forecast was accurate to within thirty minutes, an order of magnitude better than what operational forecasters can currently hand to a satellite operator or a power grid manager. The image stream that made it possible came from a constellation of four small NASA satellites that almost no one was talking about a year ago, called PUNCH, the Polarimeter to Unify the Corona and Heliosphere.

Solar storms are the part of space weather that hits infrastructure. A coronal mass ejection that reaches Earth compresses the magnetosphere, drives geomagnetic currents through long conductors, and can knock out high-voltage transformers, satellite electronics, and GPS-based timing. The 1989 Hydro-Québec blackout, which left six million Canadians without power for nine hours, began with a CME. The 2003 Halloween storms disrupted GPS, aviation, and the Japanese ADEOS-2 spacecraft. Satellites in low Earth orbit experience increased atmospheric drag during geomagnetic storms, and astronauts on the way to the Moon or Mars need to know when to take shelter.

The forecasting problem is that the Sun is 93 million miles away and a CME traveling at a million miles per hour takes about 15 to 18 hours to reach Earth. That is a long enough lead time to act, but only if you know when the cloud will arrive. The current operational model, called WSA-ENLIL, was put into service by NOAA’s Space Weather Prediction Center and uses a 1-to-4-day cone projection that gives a forecast window of about 5 hours. The 30-minute result from PUNCH is roughly ten times tighter, and it came from a deliberately simple model that the team describes as the “steam engine” version of what could be built on top of the same data.

PUNCH launched on March 11, 2025, from Vandenberg Space Force Base in California, sharing a Falcon 9 ride with the SPHEREx sky mapper. All five satellites separated from the same upper stage, and the four PUNCH spacecraft (three carrying Wide Field Imagers and one carrying the Narrow Field Imager) began climbing into a polar, low Earth orbit (Wikipedia: PUNCH; SwRI mission page). First light came on April 14, 2025, with the NFI and one WFI snapping their inaugural images, and the other two WFIs following two days later (NASA SVS PUNCH first-light CME images). By late May the spacecraft were returning daily mosaics wide enough to track a single CME from the corona all the way out to where Earth sits.

The team chose a specific event as their test case: a coronal mass ejection that left the Sun on May 31, 2025. The leading edge of the cloud moved through the inner solar system, and PUNCH’s three WFIs captured it every four minutes throughout the journey. The researchers fed those images into a basic forward model that had no deep learning, no physics-specific tuning, and no prior knowledge of the speed or geometry of the cloud. The model extracted the position and motion of the leading edge from the imagery and converged on an arrival time forecast roughly twelve hours after the eruption. That settled forecast was accurate to within 30 minutes of the actual arrival, a 10× improvement over the 5-hour window from the current operational approach, which uses the WSA-ENLIL cone model (NOAA SWPC WSA-ENLIL; NASA Science release).

“We thought PUNCH would be good at this, but it’s a stunning result,” said Craig DeForest, the principal investigator at Southwest Research Institute’s Solar System Science and Exploration Division in Boulder. “To put it in perspective, this could be the space weather equivalent of going from a steam engine to a modern internal combustion engine.” The model also revealed when its own estimate had stabilized, which is a useful property for forecasters because it tells them when the prediction is safe to act on.

PUNCH is built to do something the previous generation of coronagraphs could not: keep its eyes on a single coronal mass ejection for the entire Sun-to-Earth journey. The big European-NASA SOHO spacecraft, launched in 1995, carries the LASCO coronagraph that has been the workhorse of CME forecasting for three decades, but LASCO’s field of view cuts off at about 32 solar radii (NOAA SWPC CME overview). Beyond that, a CME becomes too faint and too far from the Sun’s bright disk for a coronagraph to track. The gap between LASCO’s edge and Earth is roughly 80% of the journey, and most of the guessing in the current 5-hour forecast window comes from that gap.

PUNCH’s three Wide Field Imagers extend that view out to 180 solar radii, while the Narrow Field Imager, a coronagraph similar in spirit to LASCO C3, covers 6 to 32 solar radii. Where the design is unusual is in the polarimetry: rather than just taking pictures, the WFIs measure the polarization of the sunlight scattered by free electrons in the corona and solar wind, which lets the team separate the K-corona (the part of the corona made of solar plasma) from the background starfield, zodiacal light, and Milky Way. The reduction pipeline aligns images from all four spacecraft to within 0.03 pixels of each other and produces a single 4-minute-cadence polarimetric image covering a 90° field of view centered on the Sun (NASA SVS PUNCH Instruments).

The forecasting work uses that data in a deliberately simple way. The model segments the moving leading edge of the CME, fits kinematics to its position over time, and projects the arrival by extrapolating the speed and direction. It does not currently include physics for how a CME decelerates against the ambient solar wind, rotates as it expands, or interacts with earlier ejections. The fact that a basic kinematic model still beats the operational cone model by a factor of ten is the headline: more physical realism, and more PUNCH data, will only sharpen it. DeForest’s team has also begun using the high-resolution imagery to see that CMEs are clumpier than previously thought and continue to evolve as they travel, which is itself new physics for the forecast models to absorb.

PUNCH’s first forecast result is a proof of concept rather than a finished system. The model that produced the 30-minute window is not yet integrated into NOAA’s operational forecasting pipeline, and the August 4 announcement at the Committee on Space Research Scientific Meeting is paired with a paper currently under review at the journal Space Weather (NASA Science release). The next steps are obvious and on the team’s roadmap: refine the model, run it on a larger sample of CMEs, and hand it to SWPC for testing. If the gain holds across more events, the practical effect is that satellite operators can keep a spacecraft in safe mode for a shorter window, power grid dispatchers can stand down earlier, and crewed deep-space missions can plan around tighter storm arrival predictions. The CMEs that PUNCH is now watching arrive and evolve across the inner solar system will keep teaching the team how the Sun connects to the space weather we feel on Earth.


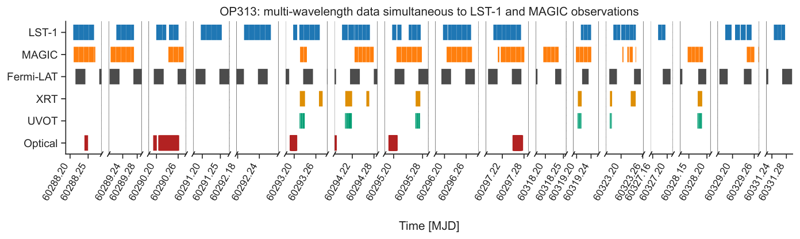
Multi-wavelength coverage timeline for OP 313 between December 2023 and January 2024, adapted from Figure 1 of Abe et al. 2026 (arXiv HTML build). Each row shows the good-time intervals from one instrument: LST-1 (top), MAGIC, Fermi-LAT, Swift-XRT, Swift-UVOT and optical telescopes (bottom). Gaps are when the source was below the horizon or weather shut observations down.


The source flagged on December 10, 2023 looked ordinary at first: a flat-spectrum radio quasar in the constellation Canes Venatici, sitting just shy of a redshift of 1, where most extragalactic work stops being feasible. Within four nights of follow-up, the prototype Large-Sized Telescope (LST-1) on La Palma had pulled it out of the background with a statistical significance of 12 standard deviations, and a few nights later the MAGIC telescopes at the same observatory confirmed the detection at 6 standard deviations. The result, published in August 2026 in Astronomy & Astrophysics by the CTAO LST and MAGIC collaborations, makes OP 313 the most distant active galactic nucleus ever detected at very-high-energy gamma rays (above 100 GeV) and only the tenth flat-spectrum radio quasar (FSRQ) ever caught at those energies (Abe et al. 2026, A&A).

Blazars are what happens when a supermassive black hole happens to be pointing one of its relativistic jets almost directly at Earth. The jet accelerates particles to extreme energies, and the blazar we see is the Doppler-boosted glow of that jet. The lower-energy bump of that glow peaks somewhere in the optical or X-ray range, and a second, much higher-energy bump sits in the gamma-ray range. For BL Lacertae objects, the second bump can be tracked cleanly all the way up to tens of tera-electron-volts with imaging atmospheric Cherenkov telescopes (IACTs). For FSRQs, where the jet is embedded in bright gas clouds and a dusty torus, that same very-high-energy glow is much harder to produce and gets eaten on the way out.

The “eaten on the way out” part is what makes OP 313 a hard target. Every gamma-ray photon at, say, 300 GeV that leaves an FSRQ has to traverse roughly seven billion light-years of space to reach us, and along the way it can pair-produce on infrared and optical background photons left behind by every star that has ever lived. That fog, the extragalactic background light (EBL), gets thicker as you look deeper into the universe, and very-high-energy photons from distant blazars usually arrive at Earth with their high-energy tail statistically removed. OP 313 at z=0.997 sits deep enough in this fog that detecting its very-high-energy emission at all was the main challenge; using it to constrain the fog itself is the secondary prize (phys.org news writeup, 24 August 2026).

The detection was triggered by a high state reported by the Fermi-LAT and optical monitoring networks in late November 2023. Once the daily Fermi analysis (the FLaapLUC pipeline) flagged the rising flux, two follow-up alerts went out on December 10, and both LST-1 and MAGIC began observing that same night. Between December 10 and December 19, LST-1 accumulated 14.6 hours of good-weather data and detected the source at 12.0 standard deviations above ~10 GeV, the highest single-instrument significance the campaign produced. The MAGIC stereo system collected 10.4 hours during the same flare window and confirmed the detection at 6.0 standard deviations. Follow-up in January 2024, when the source had dropped back into a low state, returned only upper limits, consistent with a flaring source that had settled back down (Abe et al. 2026, A&A).

The paper’s value goes beyond confirming one more extragalactic source. OP 313 had been observed before in the very-high-energy range by MAGIC alone and produced only upper limits, so the new detection, which doubled as a first-light demonstration for the LST-1 prototype that will seed the Cherenkov Telescope Array Observatory (CTAO) in the Northern Hemisphere, slots the source into the small club of VHE-detected FSRQs (TeVCat catalogue for OP 313). The previous record-holder at this kind of energy was a different FSRQ called PKS 0346-27, at redshift 0.991. Pushing that mark to 0.997 by no more than a sliver of z amounts to several extra billion years of lookback time at this distance, where each tick of z adds roughly a billion light-years of optical depth through the EBL.

The detection also slots into a wider multimessenger story. In May 2012, the IceCube Neutrino Observatory at the South Pole recorded a high-energy track-like event whose reconstructed direction was consistent with the position of OP 313. The neutrino was not temporally coincident with the gamma-ray flare, so this paper cannot claim a coincident detection; but the fact that the same source is now visible at the highest gamma-ray energies, in the same sky region IceCube flagged, raises the long-term odds of catching a genuine neutrino-blazar coincidence during a future high state (LAPP press release, 2024).

LST-1 is the first of four Large-Sized Telescopes planned for the northern Cherenkov Telescope Array Observatory (CTAO) array, situated next to MAGIC at the Roque de los Muchachos Observatory on La Palma in the Canary Islands. Its 23-metre segmented mirror dish and its 1,855-pixel camera of high-quantum-efficiency photomultiplier tubes give it a low energy threshold of roughly 20 GeV, low enough that any VHE source that drifts overhead is within reach. MAGIC, the older neighbour, is a stereo pair of 17-metre dishes; together they cross-check each other’s energies and directions, which is why the LST-1 paper and its Table 1 quote both sets of numbers.

Detecting OP 313 was a threshold problem on both instruments. LST-1 reached 12.0 sigma in the December window but with an analysis threshold of about 60 GeV, where the gamma/hadron separation is intrinsically harder for a single dish; the per-cent signal-to-background level reflects that the measurement is background-limited near threshold. MAGIC, with stereoscopic reconstruction, ran warmer at a threshold of about 70 GeV and reached 6.0 sigma, but its higher absolute flux above 100 GeV put it above background-systematic-limit. The two spectra agree, within their stated uncertainties, on a simple power law with no strong sign of intrinsic curvature (Abe et al. 2026, A&A HTML).

A common background light hides in those measurements. The cumulative infrared-to-ultraviolet glow of every star that has ever existed, the EBL, attenuates very-high-energy photons in a way that grows with redshift. To turn the OP 313 detection into an EBL measurement, the team fit the joint Fermi-LAT and LST-1 spectrum with a spectral model multiplied by exp(-α τ), where τ is the optical depth predicted by a reference EBL model (Saldana-Lopez et al. 2021) and α is a free scaling factor. They then constrained α by likelihood ratio testing. The result: α(95%) < 1.14 from the LAT plus LST-1 dataset, and tighter upper limits in the optical band, with the most stringent constraint coming between about 0.325 and 1.069 micrometres, the so-called Cosmic Optical Background. At 0.6 micrometres, the upper limit lands at 6.72 nanowatts per square metre per steradian (statistical, 95%), or 8.74 with energy-scale systematics included (Abe et al. 2026, A&A).

OP 313 has a separate history worth noting. Originally catalogued as a variable star in 1959 (the OP 313 designation is a positional reference), it was later identified with a flat-spectrum radio source (B2 1308+326) and reclassified as a quasar at z ≈ 0.997. The early literature sometimes labelled it a BL Lacertae object; current multi-wavelength studies favour the FSRQ classification because its emission lines and broad-line-region signatures are visible when the source is in a high optical state (Wikipedia – B2 1308+326, companion A&A study, March 2026).

OP 313 is now the highest-redshift AGN detected at very-high-energy gamma rays, the tenth FSRQ caught at those energies, and a useful lever on the optical part of the extragalactic background light. LST-1’s first confirmed contribution to extragalactic astronomy came with the same paper that moved the VHE distance record. The CTAO Consortium plans to complete the northern array over the next several years; with four LSTs at low threshold and several mid-sized telescopes at higher energies, the arrival-time window for catching the next record-breaker will keep getting shorter.


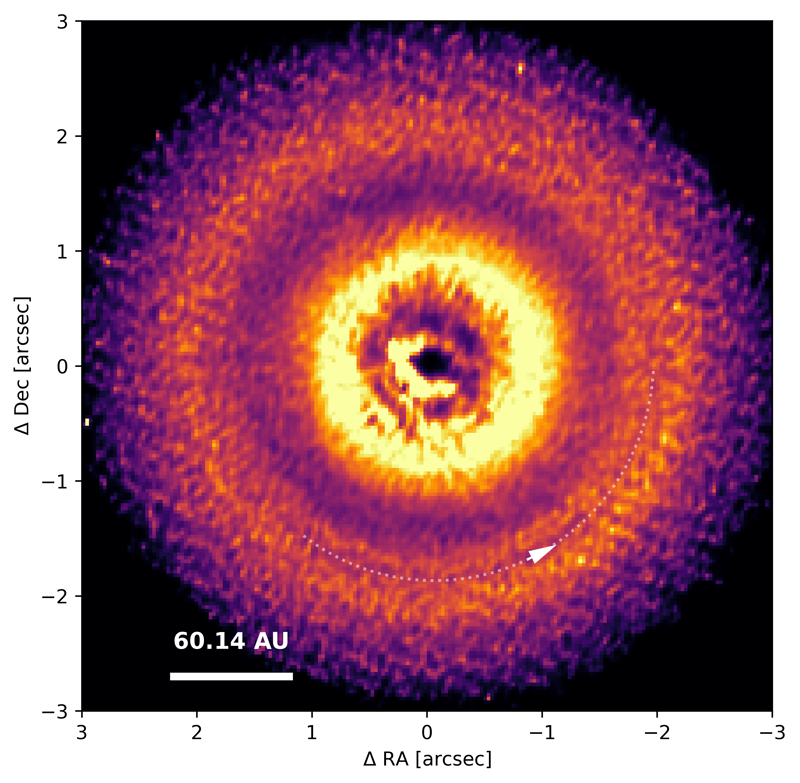
JWST/NIRCam r-squared-scaled F200W view of the TW Hya protoplanetary disk, with the spiral-bifurcation feature at 120 AU traced by a dotted arc and arrow.


At 60.14 parsecs from Earth, a red dwarf no bigger than Jupiter hosts the most-photographed protoplanetary disk in the night sky. TW Hydrae, or TW Hya, has been a fixture of circumstellar astronomy since the 1980s, because its nearly face-on geometry makes its rings, gaps, and shadows easier to see than almost any other system. On July 27, 2026, a team led by Yu-Chia Lin of the University of Arizona submitted the deepest look yet at this benchmark disk: a four-filter JWST/NIRCam coronagraphic campaign spanning 1.87 to 4.44 microns. The result, published in arXiv:2607.23992 and accepted for The Astronomical Journal, does not yet reveal a hidden planet. What it does is reshape the geometric picture of the disk itself, with tentative but consistent evidence that the outer disk of TW Hya bends out of the plane traced by the inner disk.

Protoplanetary disks are the construction sites of planetary systems. Their rings, spirals, and shadows are the indirect signatures of forming worlds, and reading them correctly requires a precise model of how the disk sits on the sky. A warped geometry implies either an unseen inclined companion tugging the inner disk, a misalignment between the host star’s rotation axis and the disk’s angular momentum, or a past gravitational encounter that left the outer disk bent. For TW Hya specifically, where observers have spent decades trying to identify the planet or planets responsible for the system’s famous moving shadows, a confirmed warp would shift the conversation away from “is the disk flat” and toward “what is bending it.”

The JWST result is also a methodological milestone. Coronagraphic imaging of a face-on disk near the diffraction limit of a 6.5-meter mirror is technically punishing, because the coronagraphic mask hides the inner disk and point-spread-function residuals can masquerade as faint disk structures. Lin and colleagues addressed both problems with a custom PSF-subtraction routine (HPFRDI), a deconvolution algorithm tuned to the NIRCam PSFs, and an MCMC geometric fit with a non-trivial noise model. The same pipeline, applied to other nearby disks in the JWST cycle, is now an off-the-shelf tool.

The TW Hya system has been studied in enough wavelengths to fill a textbook chapter. The first clear evidence for an inner cleared region came from Hubble in the 2000s, when a near-infrared image revealed a dark gap at roughly the orbital distance of a Saturn-mass planet. Subsequent ALMA observations resolved the dust continuum and showed the gap was real, not an artifact of scattered-light modeling. The system also exhibits a moving shadow pattern, first characterized by Debes et al. and refined over multiple epochs since then, with the shadow’s apparent drift suggesting a precessing inner disk that casts a rotating silhouette onto the outer regions.

Against this backdrop, the JWST team designed a four-coronagraph campaign in NIRCam filters F187N, F200W, F356W, and F444W. F187N is a narrow-band Pa-alpha filter designed to catch hydrogen recombination emission; it produced a non-detection of the disk. F200W, F356W, and F444W caught the disk in scattered light. The team stacked two epochs in F200W and two in F444W, then ran the result through HPFRDI to subtract the stellar PSF and the coronagraphic mask transmission, then through a deconvolution code called winnie (200 Richardson-Lucy iterations for the F200W stack, 129 for F444W, with a forward-modeled synthetic disk as the stopping criterion).

The resulting images show what previous instruments could only hint at. The disk’s nearly face-on geometry means that even small inclination differences between inner and outer regions are detectable when the data are deep enough. An MCMC fit to the deconvolved F200W image, splitting the disk into inner (0.675 to 1.44 arcsec) and outer (1.44 to 2.98 arcsec) annuli, yields inclination values that overlap but tend to differ at the 1-sigma level, with the outer annulus showing a broader, asymmetric posterior. Position angle drifts slightly between inner and outer fits. The team’s cautious language is “tentative evidence consistent with a disk warp,” but the trend is the same direction across both parameters.

The companion search sets the deepest mass limits yet on potential planets in the gap region: no new point sources detected in the F444W data, reaching approximately 0.4 Jupiter masses at 1 arcsec (60 AU) under clear-atmosphere assumptions, and sub-Jupiter masses beyond 2 arcsec when local extinction is accounted for. The dust gaps in TW Hya are either being carved by planets smaller than Jupiter, or by a process that does not require a planet at all.

The disk’s near-face-on orientation makes it both a gift and a problem. With the disk inclined at only ~8.74 degrees from our line of sight, scattered-light rings and gaps are not foreshortened, so the structure stays visible across the entire field. The cost is that any inclination variation produces a small but detectable effect on the projected geometry. The team formalized this by computing brightness variance as a function of trial inclination and position angle, weighted by an empirical variance model derived from the data itself. The relationship between log-mean intensity and log-variance was fit with a second-order polynomial with R-squared of 0.98, giving the MCMC walker a well-behaved likelihood surface.

The deconvolution step matters more than is obvious. A Richardson-Lucy algorithm with too few iterations leaves the disk blurry; with too many, it amplifies noise and produces a fake central peak. The team’s solution was synthetic injection and recovery: they simulated a face-on disk with the same noise properties, ran the same pipeline, and used the residual statistics to choose iteration counts that recovered radial profiles without over-fitting the core. This kind of forward-modeled stopping criterion is becoming standard practice in high-contrast imaging, but it is unusual to see it documented so carefully in a peer-reviewed publication.

The detection of the bifurcation at 120 AU is a structural find rather than a kinematic one. The team did not measure orbital velocities, so they cannot say whether the bifurcation is a single spiral arm unwinding from a planet, dust streams from a recent collision, or a shadow projected by the inner disk onto a slightly tilted outer disk. They explicitly list all three in their discussion. The 2-degree logarithmic spiral pitch is most easily explained by gravitational interaction with a planet, but a planet of the mass implied by the spiral pitch (around 1 Neptune mass, depending on disk viscosity assumptions) would, if present at 120 AU, sit at the very edge of what JWST can detect in this dataset. The detection limits at F444W do not quite reach there, which the team acknowledges.

JWST’s coronagraphic modes, combined with careful reference-star differential imaging and iterative deconvolution, are now routinely producing sub-arcsecond views of nearby disks that were not feasible with HST or ground-based adaptive-optics instruments. The team’s PSF library (built with STPSF, the successor to WebbPSF) and their MCMC geometric fit are reusable for the next round of JWST disk-imaging programs.

TW Hya, after 40 years of study, has revealed another layer of structure to a team willing to push JWST’s coronagraphic modes to their limits. The headline result is geometric: a tentative radial warp between inner and outer disk, captured across three near-infrared filters and quantified with an MCMC fit that distinguishes real inclination drift from noise. The structural result, a confirmed bifurcation at 120 AU along a 2-degree logarithmic spiral, adds a specific observational target for any future search for the disk’s hidden planets. The companion search, which sets 0.4 Jupiter-mass limits at 60 AU, rules out a gas-giant explanation for the gap-clearing but leaves room for smaller worlds.

The paper is Lin et al. 2026, accepted for The Astronomical Journal, arXiv:2607.23992, with figures in the HTML build at arxiv.org/html/2607.23992v1. For the moving shadow history that frames the warp hypothesis, see Debes et al. 2023 in The Astrophysical Journal. The next step is a coordinated multi-epoch program: re-imaging TW Hya at F200W and F444W every six to twelve months would test whether the inferred warp precesses on a timescale consistent with a misaligned inner disk, and a single deep ALMA cycle at matched resolution would pin down whether the gas disk shares the same geometric tilt as the dust. The disk is closer than any other, so any future detection will be the cheapest JWST cycle to write and the most consequential for planet-formation theory.


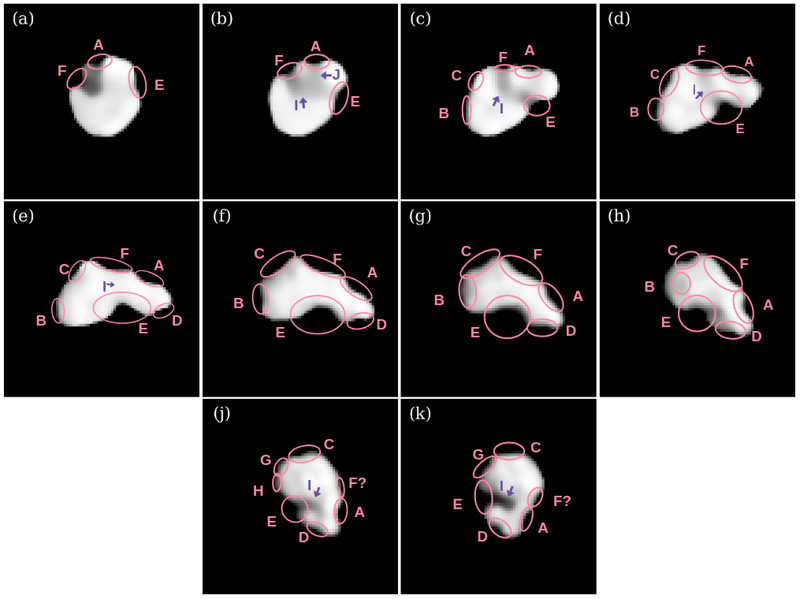
Ten SHARK-VIS views show asteroid 44 Nysa rotating, with pink ovals and purple arrows marking edge indentations and shadowed valleys labeled A through J.


For most of its 6.42-hour rotation, asteroid 44 Nysa is just a bright point in a telescope image. On the best nights, though, that point opens into something much stranger: a broad primary body with deep, wraparound valleys and a faint speck moving nearby. The new observations do not show a tidy, single rock. They suggest that Nysa may be a contact trinary, three pieces that came together slowly enough to remain joined, with a small moon circling the outside.

That conclusion is still provisional. The paper is a preprint, and the authors leave room for a different answer: Nysa could be one unusually strong, heavily fractured body whose surface only looks divided into lobes. Either way, the result is a reminder that many asteroids are known from their changing brightness long before their actual shapes can be resolved. In Nysa’s case, a century of indirect clues has finally been paired with images sharp enough to test them.

Figure adapted from Minker et al., “Unmasking (44) Nysa: Evidence for a trilobate structure”, used under the arXiv-hosted CC BY-NC-ND 4.0 license; labels and layout are unchanged.

Asteroids are fragments, but “fragment” does not mean simple. Their shapes retain evidence of collisions, gravitational settling, rotation, and the weak forces that bind rubble together. A contact binary, such as the two-lobed objects visited by spacecraft, can form when separate bodies collide at low speed and stay together. A three-lobed contact object would add another step to that history. It would give researchers a particularly clear test of whether several pieces can remain attached through later impacts and through the long-term stresses of rotation.

Nysa is also useful because its composition is unusual. It is one of the larger E-type asteroids, a rare group associated with enstatite-rich meteorites. Those meteorites resemble material thought to have formed in the hot inner part of the young solar system. The link is not a direct sample return, and the authors are careful about what can be inferred from a spectrum, but the object offers a chance to connect surface chemistry with internal structure. If its three lobes came from one parent body, their similar appearance may preserve a record of how that parent was broken and reassembled.

The moon matters for a more practical reason: its orbit can eventually provide Nysa’s mass. Shape and brightness alone leave density uncertain. A measured mass combined with the paper’s size estimate would help distinguish a coherent, dense object from a looser aggregate of fragments. That number could turn an intriguing silhouette into a physical model.

Nysa has been observed for more than a century. Earlier work used light curves, stellar occultations, radar, and the Hubble Space Telescope’s Fine Guidance Sensor to look for clues about its form. Those methods pointed toward an elongated body, perhaps with a large companion or a pronounced concavity, but they could not settle the question. A spinning asteroid changes brightness as different faces rotate into view; converting that change into a three-dimensional shape is useful, but several shapes can produce similar light curves.

The new campaign attacked the problem directly. The team led by Kate Minker of Lowell Observatory observed Nysa with SHARK-VIS on the Large Binocular Telescope on February 15 and March 21, 2026. They also used SPHERE/ZIMPOL on the European Southern Observatory’s Very Large Telescope during ten observing epochs between March 9 and April 5. The instruments work at visible wavelengths, where the asteroid is bright, and combine high-speed imaging with adaptive optics to correct for turbulence in Earth’s atmosphere. The Lowell Observatory release and the study describe these as the highest-resolution images yet obtained of Nysa. (Lowell Observatory research release)

The images show two shadowed valleys that appear to run around the asteroid’s narrowest directions. The researchers call these structures colli, using a geological term for neck-like connections. In their preferred reading, one neck joins two larger lobes and a second divides the smaller lobe, producing a three-lobed primary. The paper’s shape model has a volume-equivalent diameter of about 75 kilometers and reproduces the disk-resolved images, light curves, and several stellar occultation silhouettes. (Nysa preprint)

The same processing uncovered a satellite. It appears in residual images left after the bright halo around Nysa was modeled and removed, and it was recovered independently in data from both LBT observing nights. The point source moved across the sky while remaining fixed relative to Nysa for more than three hours on each night, which argues against a background star. The authors estimate a diameter of about 1 +/- 0.5 kilometers and projected separations of about 180 and 170 kilometers in February and March. The provisional designation is S/2026 (44) 1.

Those measurements support the binary-system conclusion, but not yet a final origin story. The authors discuss a battered single body, a contact trinary, and a hit-and-run collision followed by slow reaccumulation. They also note that an impact capable of making several large pieces in Nysa’s present orbital neighborhood should leave more enstatite-rich debris than has been observed. Further orbital work is therefore not a footnote. It is the part that may decide which history survives.

The central engineering problem is angular resolution. A telescope does not see an asteroid’s surface directly; it sees a blurred pattern set by diffraction and by the atmosphere. The angular scale of diffraction is roughly 1.22 lambda/D, where lambda is the observing wavelength and D is the telescope aperture. Larger apertures help, shorter wavelengths help, and a turbulent atmosphere can erase both advantages unless its distortion is measured and corrected.

Adaptive optics uses a wavefront sensor to estimate that distortion and a deformable mirror to compensate for it many times per second. SHARK-VIS works with the LBT’s adaptive-optics system for high-contrast visible imaging. SPHERE is an extreme adaptive-optics and coronagraphic facility; its ZIMPOL camera is designed for sharp visible-light images and polarimetry. (LBTO instrument overview) (ESO SPHERE description)

Even corrected images contain a problem that is especially severe for a small moon: Nysa is much brighter than its satellite. The team used short exposures, image stacking, lucky-imaging selection, blind deconvolution, and a version of principal-component angular-differential imaging adapted from exoplanet searches. Blind deconvolution estimates both the object and the point-spread function, allowing the bright adaptive-optics halo to be subtracted. PCA-ADI builds a model of quasi-static background structure from images taken as the sky rotates, then looks for a source that moves with the target rather than with the detector.

The shape model adds a separate constraint. The ADAM algorithm combines the resolved images with photometric light curves, adjusting a three-dimensional surface until its projected silhouettes and changing brightness agree with the observations. The final model used 1,600 vertices and 3,200 facets. That does not mean every facet is a mapped piece of ground. It means the model is detailed enough to reproduce the data without adding unsupported internal information. In particular, the authors note that their regularization fixes the model’s center of mass, so the reconstruction cannot reveal how mass is distributed inside Nysa.

The useful result is not that Nysa has been definitively declared a three-headed asteroid. It is that two independent kinds of evidence now meet in the same object: resolved images show two possible necks, while light curves and occultations agree with a lopsided, rapidly rotating shape. A faint satellite adds a future mass measurement.

The next step is patient work rather than a dramatic flyby. Repeated observations can refine the moon’s orbit, turn separation into mass, and test whether the apparent lobes remain dynamically stable. If the contact-trinary interpretation holds, Nysa will offer a rare ground-based laboratory for studying how large asteroid fragments join and survive. If a coherent body fits better, that would be just as interesting. Either answer would replace a century of suggestive shadows with a more constrained physical history.