OrbitalHub

Where curiosity reaches escape velocity.

Domain is for sale. $50,000,000.00 USD. Direct any inquiries to contact@orbitalhub.com.

Archive for the Astronomy category


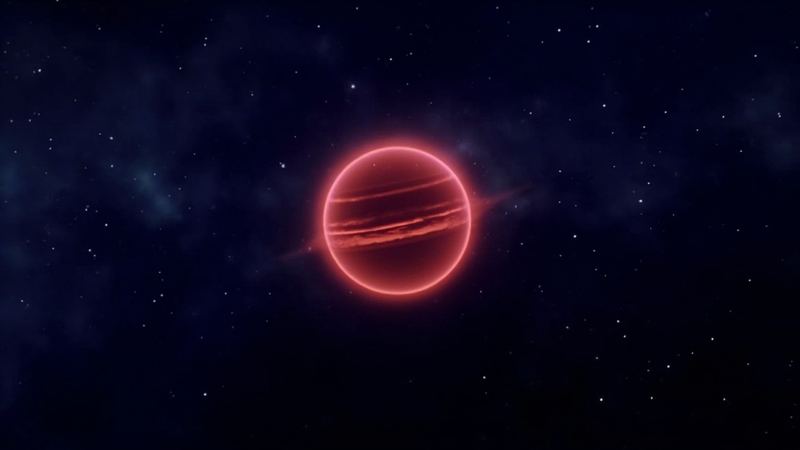
A faint, dark, isolated Y-dwarf brown dwarf glowing dim red-brown against a sparse starfield, with translucent water-ice cloud bands swirling over its banded atmosphere, representing WISE 0855-0714 drifting alone 7.4 light-years from the Sun.


Somewhere in the constellation Hydra, about 7.43 light-years from the Sun, an object slightly larger than Jupiter and roughly twice Jupiter’s mass sits at 265 kelvins and slowly rotates, surrounded by water-ice clouds. It is the coldest known brown dwarf, a failed star with no fusion at its core, and on a single clear orbit of the James Webb Space Telescope, a team led by Brittany Miles of the University of Arizona’s Steward Observatory pointed the Near-Infrared Spectrograph at it for eleven straight hours. The result, announced on 8 October 2026 and accepted for publication in The Astrophysical Journal, is the first direct evidence that water clouds thicken and thin on a body outside the solar system. The air is moving. The weather is real. We can now watch it.

Brown dwarfs have always been a category problem. Too massive to be planets — at least thirteen Jupiter masses is the conventional lower bound — and too small to clear their neighborhoods, they are also too small to ignite steady hydrogen fusion. They glow with the residual heat of their formation, dimming visibly year over year as they radiate it away. A young T-type brown dwarf can sit at 1,500 K and look vaguely like a hot Jupiter. A middle-aged one in the L-T-Y sequence cools through a thousand kelvins and changes chemistry, with silicate and iron clouds raining out of its atmosphere at successive temperature plateaus. By the time an object reaches the Y class, somewhere below 500 K, water has frozen into clouds at the level of the photosphere, and the chemistry has become alien enough that it overlaps with what a cold, isolated gas-giant planet would look like. WISE J085510.83-071442.5, the object that Kevin Luhman first identified in the WISE survey in 2013, sits so far down the cooling track that its own temperature is below the freezing point of water. That is why astronomers care about it. It is the closest analog to a free-floating giant planet that we can see in detail (Luhman 2014, ApJ 786, L18).

The new work leans on that proximity. With a parallax of 439.0 ± 2.4 milliarcseconds measured against background quasars (Luhman & Esplin 2014), WISE 0855 is the fourth-closest stellar system to the Sun, after Alpha Centauri, Barnard’s Star, and Luhman 16. At 2.278 parsecs it is close enough that JWST can collect a medium-resolution spectrum, R ≈ 1,000, with high signal-to-noise in fifteen-minute slices across an entire rotation. The team obtained 32 such spectra, one every fifteen minutes for eleven hours, watching the same atmospheric column long enough to track features as they came in and out of view. The result is not a static spectrum. It is a movie with chemical resolution.

What they saw falls into two distinct layers. In the upper atmosphere, between roughly 1 and 4 bar of pressure, the water-ice cloud opacity oscillates. Some rotation phases show deeper, thicker clouds; others show clearer air, with the underlying gas-phase water absorption features rising into view. Below that, near 70 bar, the abundances of carbon monoxide and, in particular, phosphine (PH₃) vary in a way that does not match a quiet atmosphere. The team interprets the deeper signal as convective dredging: parcels of gas from well below the photosphere are rising, cooling, and being mixed into the visible layers, carrying with them the products of high-pressure chemistry. Phosphine, in particular, is hard to make in a cold, hydrogen-rich atmosphere at equilibrium; seeing it vary is a fingerprint of disequilibrium mixing, the same vertical transport that drives Earth’s weather but in a gas made mostly of molecular hydrogen and helium.

Why this matters is partly a question of what the older instruments could not do. Pre-JWST photometry of WISE 0855 measured the total brightness changes as the object rotated, but photometry collapses everything — clouds, chemistry, temperature — into a single flux number. NIRSpec at R ≈ 1,000 resolves individual molecular lines, so a cloud’s signature can be told apart from a chemistry change by the wavelength dependence. A water-ice cloud dims more in the continuum than in a line core; phosphine varies in a sharp, narrow band near 4.3 μm. That wavelength-resolved time series is what turns “the brightness is changing” into “the air is moving,” and only JWST has the combination of light grasp, wavelength coverage, and stability to make the measurement.

The broader payoff is the bridge the result builds between solar-system science and exoplanet science. Jupiter, the only other place where we can stare at water-ice clouds for a full rotation, has its own meteorology, and the cloud structures are different in kind — banded, with sharp shear zones and lightning-driven convection. The brown-dwarf version is slower, colder, and chemically simpler, but the physics overlaps. Carbon monoxide and phosphine chemistry in hydrogen-rich air follows the same quench kinetics, the same vertical-mixing timescales, the same temperature-dependent pathways. Modeling tools built for Jupiter’s atmosphere can be ported across. As the team puts it, the cloud-thickness modulation they see in WISE 0855 sits at pressures close to the photosphere, while the CO and PH₃ modulation sits much deeper; the two signals decouple, which they would not if a single effect were driving both. The weather is layered, the way weather here is layered.

There is a second, quieter implication. Brown dwarfs are not the only objects at this effective temperature. The directly imaged giant planets around HR 8799, β Pictoris, and a handful of other young A-stars sit at L-to-T spectral types, with brightness temperatures around 1,000 to 1,500 K. The colder, free-floating Y-dwarfs like WISE 0855 are the only objects old enough and cool enough to make the photospheric chemistry fully settled, and that makes them the closest natural laboratory for what an isolated Jupiter-mass planet would look like after it stops glowing from formation heat. The same NIRSpec time-series technique, applied to a young, hot Jupiter, will not work — the contrast against the host star is too steep — but applied to a Y-dwarf, it works because the dwarf is its own light source. If the team can repeat the measurement on a slightly warmer or slightly cooler Y-dwarf, they can map how the cloud layer’s vertical position and the convective mixing depth depend on effective temperature. That is a phase diagram of substellar weather waiting to be filled in.

For the moment, the headline is small and concrete: on one eleven-hour night, JWST watched water clouds form and dissipate on an object only 7.43 light-years away. The first exoplanet weather report, in the strict sense, is in. The next step is repetition across the Y class, where a small population of cold brown dwarfs within 20 parsecs is already known and the JWST time-allocation committee is more than willing to spend hours on them. The fields that should move fastest are the cloud microphysics of water ice in hydrogen-rich gas and the rate at which disequilibrium chemistry can reshuffle carbon and phosphorus through an atmosphere with no stellar irradiation to drive it. Both questions have been waiting, in a sense, for a Webb that could simply sit on one cold dot for half a night and watch. That wait is over.
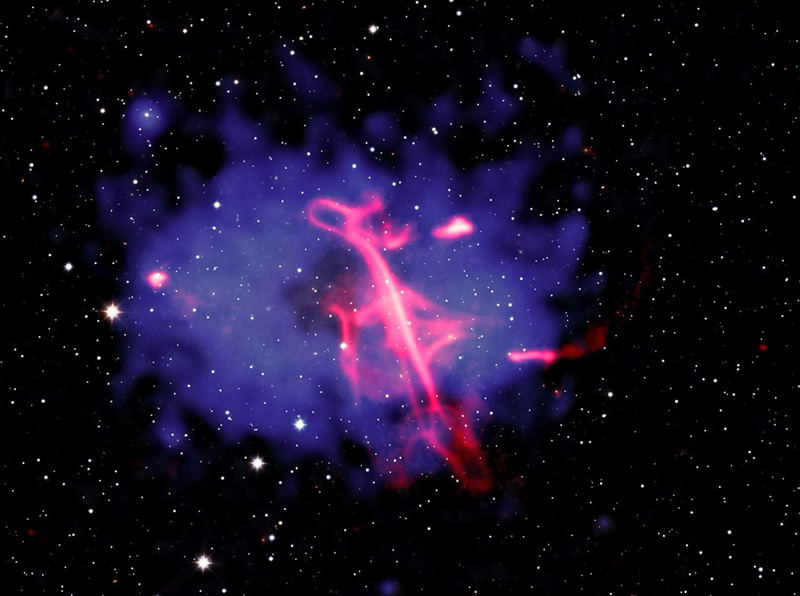


Chandra hears a treble clef in a galaxy cluster. Image: 2026 10 17 chandra treble clef radio phoenix.


When a radio source was first catalogued three decades ago as VLSS J0318.9+5755, it looked ordinary enough: a faint filament at low galactic latitude, originally mistaken for a pulsar and shelved. Then a team led by Andrea Botteon at Italy’s National Institute for Astrophysics (INAF) took a closer look with the LOFAR Two-metre Sky Survey, and the source turned out to be doing something the radio sky almost never shows. Curling from top to bottom in a single continuous line, it traces out a shape that looks, unmistakably, like a treble clef. In a paper published Wednesday in Astronomy & Astrophysics, the team combined new radio observations with NASA’s Chandra X-ray Observatory and the German-built SRG/eROSITA X-ray telescope to trace the formation to two events that happened hundreds of millions of years apart: an old outburst from a supermassive black hole, then a galaxy cluster collision that re-energised the fossil plasma. The NASA press release that landed on 14 October 2026 calls the shape a case of pareidolia – the human habit of seeing familiar patterns in random data – which is fair, since the resemblance is the most striking thing about it but says nothing about the physics that built it.

The reason the Treble Clef took so long to pin down is geography, not distance. The source sits at galactic latitude b ≈ 0.5°, almost directly behind the plane of the Milky Way. Stars, dust, and gas in our own galaxy block the optical light from anything that lies in that band, and the same obscuration makes it hard to identify the host. Optical surveys simply cannot reach that patch of sky, which is why this strip of celestial real estate has its own name among extragalactic astronomers: the Zone of Avoidance. Surveys that look through other parts of the electromagnetic spectrum have no such problem. X-rays punch through the galactic gas easily, and radio waves ignore it almost entirely, so a combination of LOFAR for the radio skeleton and Chandra and eROSITA for the hot intracluster medium turns out to be exactly the right pair of tools for the Treble Clef. Once that combination was applied, the source fell into place.

What the data shows is a textbook example of a radio phoenix. A radio phoenix is fossil plasma – relativistic electrons and magnetic fields that were puffed out by a previous activity, lost most of their energy through synchrotron and inverse-Compton cooling, and went dark at radio wavelengths. They sit in clusters for tens to hundreds of millions of years as invisible reservoirs of stored energy, and then something comes along to re-energise them. In the Treble Clef, that something is the merger of two galaxy clusters. The collision drove through the intracluster gas and generated shock waves, the same kind of weak shocks that are responsible for sonic booms from supersonic aircraft. When those shock fronts swept over the fossil plasma cloud, they re-accelerated the electrons and the cloud lit back up at radio wavelengths. The Treble Clef is the fossil turned visible again, and the merger shock is the trigger.

The host cluster, named after its coordinates in the VLSS catalogue, sits in the Zone of Avoidance but is otherwise a perfectly ordinary massive merging cluster. The Chandra and eROSITA X-ray observations show a roughly oval cloud of multimillion-degree gas, hundreds of galaxies, and a complex dynamical state. To pull the merger signature out of the X-ray image, the team used a residual technique: they subtracted the symmetric, oval-shaped hot gas that any relaxed cluster would have, and looked at what was left. The leftover emission was brightest at the left and right edges of the cluster and faintest in the middle, exactly what you would expect if the collision had been along the left-right axis. That residual image is what the new Chandra composite is built around. The radio image, taken from LOFAR’s LoTSS and LoLSS surveys plus new uGMRT follow-up, was then laid on top in red. The X-rays go in blue and purple, the infrared background from the United Kingdom Infrared Telescope goes in white, and the result is the magenta-on-blue image released on 14 October.

The shape itself is not a symbol that the universe was trying to draw. The vertical stroke of the clef is a long filament of old radio plasma that points roughly along the merger axis, and the loops at the bottom are short curls drawn into the plasma by gas motions in the merging intracluster medium. As the two clusters passed through each other, their gravitational potentials dragged the intracluster gas into a turbulent, asymmetric state, and the turbulence carved the curled loops out of what would otherwise have been a fairly straight filament. The resemblance to a treble clef is incidental. What is not incidental is that the structure is a remarkably clean laboratory for a specific question in plasma astrophysics: how do fossil relativistic plasmas respond to weak shocks, and what does the answer tell us about the energy budget of merging clusters.

The spectrum of the radio source tells its own story. Between 400 and 650 MHz, the radio spectrum is extremely steep, with a spectral index steeper than α = 4 in places, which means the source is unusually dim at high frequencies and bright at low frequencies. That is exactly the signature of an old, revived plasma cloud rather than a fresh injection from an active galactic nucleus. A new outburst from a supermassive black hole would have a flatter spectrum and would not be confined to a single, coherent filament. The steepness, combined with the morphology, is what convinced the team that this is a phoenix and not something else.

For the broader study of cluster mergers, the Treble Clef is interesting for two reasons. The first is that it sits in the Zone of Avoidance, where systematic surveys of radio halos and phoenixes have been patchy because optical and near-infrared work is hard. Adding a clean, well-characterised example to the catalogue is a reminder that the radio sky keeps surprises waiting behind the Milky Way. The second is that the paper reports a tentative radio halo near the cluster centre, the diffuse radio glow that is the canonical signature of a recent merger, which would make this cluster a textbook laboratory for studying the link between mergers, turbulence, and particle re-acceleration. The Botteon team plans to follow up with high-resolution, very-low-frequency observations using LOFAR 2.0, the upgraded array now being commissioned in Europe, which will resolve the curled loops at sub-arcsecond scales and constrain how the plasma is being re-accelerated.

The short version is that a source first catalogued in the 1990s as a faint low-frequency radio blip, almost written off as a pulsar, turned out to be a clean case study of how a galaxy cluster merger can light up the fossil plasma from an old black hole outburst. Chandra and eROSITA saw the cluster, LOFAR and uGMRT drew the clef, and the team from INAF put the story together. The clef shape is the eye-catcher, but the physics it illustrates is the real story, and the cluster is now on the short list for the next generation of low-frequency radio follow-up.


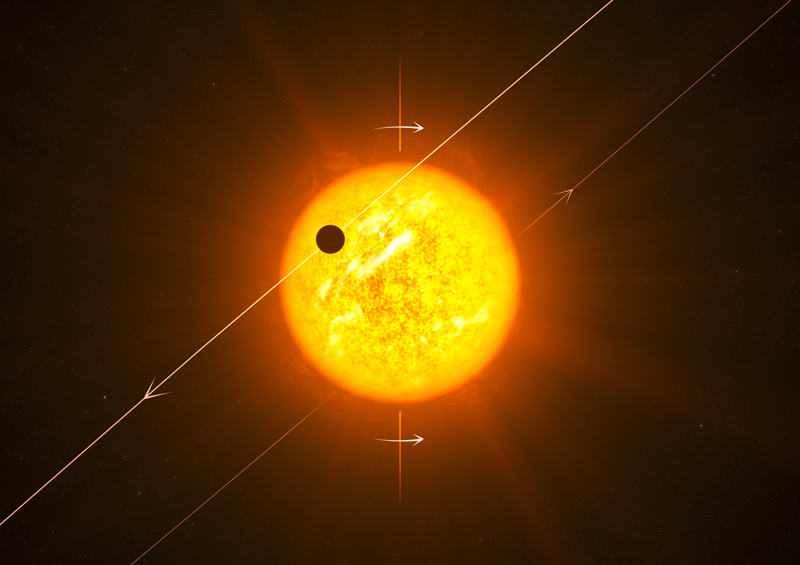
Artist's impression of an exoplanet on a retrograde orbit, with a planet transiting the disk of its host star along a tilted orbital plane. Image credit: ESO/L. Calçada.


For most of the history of exoplanet science, planets that orbit their host stars in the wrong direction were curiosities reserved for the rare hot-Jupiter systems where gravitational chaos had clearly been at work. A team led by doctoral student Yann Carteret at the University of Geneva has now reported the first retrograde planet ever found around a small, cool red dwarf star, and the result has no obvious explanation. The planet, GJ 3090 b, is a sub-Neptune 73 light-years away in the southern constellation Phoenix, and it traces an orbit that runs opposite to the rotation of its host. For an M-dwarf system, that is new ground.

Why this matters comes down to a single number. The angle between a planet’s orbital plane and the equator of its star, called Psi by the people who measure these things, sits at roughly 136 degrees for GJ 3090 b. Anything over 90 degrees counts as retrograde. In our own Solar System, that angle is between three and seven degrees for every planet, and Mercury nudges a little higher but stays comfortably prograde. The handful of other misaligned systems spotted over the last fifteen years each had a massive companion on hand, another giant planet or a stellar partner whose gravity could tilt or flip a smaller neighbor’s orbit after the fact. GJ 3090 does not. The second planet in the system is too small to do that kind of work, and there is no sign of a stellar companion. Whatever put this world on its current path had to do so without the usual accomplices, which means the textbook explanations of misaligned hot Jupiters do not apply. The find, published in Astronomy & Astrophysics, forces the field to consider mechanisms that would otherwise be filed under unlikely.

The story begins with TESS, NASA’s Transiting Exoplanet Survey Satellite, which flagged GJ 3090 b’s shadow back in one of its southern-sector campaigns. A transit is the easy part. The hard part is figuring out which way the planet is moving when it crosses the star, because that is what tells you whether the orbit is prograde or retrograde. The team watched five separate transits with the NIRPS infrared spectrograph, an instrument built in Geneva and installed on ESO’s 3.6-metre telescope at La Silla Observatory in Chile. NIRPS is tuned to the near-infrared, which is exactly the part of the spectrum where a cool, dim red dwarf like GJ 3090 puts out most of its light, and where telluric absorption from Earth’s own atmosphere is least annoying.

What the team was after is a phenomenon called the Rossiter-McLaughlin effect. As a star rotates, the hemisphere spinning toward Earth is slightly blueshifted, and the hemisphere spinning away is slightly redshifted, from the regular Doppler motion of the stellar surface. When a planet transits, it blocks a small patch of that rotating surface. If the planet moves across the star in the same direction as the star’s spin, the planet first covers a blue patch and the star appears briefly redder, then it covers a red patch and the star appears bluer, leaving a characteristic bump-dip pattern in the radial-velocity curve during the transit. For GJ 3090 b, the team saw the order reversed on every one of the five transits, with the red patch covered first. The orbital obliquity they derived is 136 degrees, in line with the inverted transit shape, and consistent across nights. There is no ambiguity left in the geometry, and that is what makes the result clean.

The science and engineering of the result sit at the same intersection that has made red dwarfs the most-studied stellar hosts over the past decade. M dwarfs are smaller and cooler than the Sun, so a sub-Neptune-sized planet produces a deeper transit signal and a larger radial-velocity wobble per unit mass than the same planet would around a Sun-like star, but the wobble from a 2.2-Earth-radius, 4.5-Earth-mass world with a 2.9-day period is still small and the transit still short. NIRPS’s design wavelength range of roughly 0.95 to 1.8 micrometres lines up with the infrared peak of a cool red dwarf, and its stability across a single transit, and across five transits taken on different nights, is what allowed the team to distinguish a genuine 136-degree obliquity from a smaller angle buried in noise. Carteret and his co-authors, including Léna Parc and Vincent Bourrier at UNIGE, point out that GJ 3090 b is now the smallest exoplanet to have its orbital obliquity mapped around any M dwarf. The technical milestone is as important as the discovery itself, because it means the technique works on the kinds of planets that are most common in the galaxy.

What remains genuinely puzzling is the missing companion. In every previously known misaligned multiplanet system, the configuration can be traced to gravitational interactions with a much larger body, either a second giant planet in the same system or a binary star whose orbital plane pulled things off course over hundreds of millions of years. GJ 3090 has a second planet, but it is not massive enough to do that kind of work, and there is no sign of a stellar companion. The team’s favoured hypothesis is a primordial disk flip, the idea that after the original protoplanetary disk dissipated, a second, misaligned disk of gas and dust fell onto the star from the surrounding interstellar medium. If that second disk arrived at the right angle, the planets that formed inside it would inherit its orientation rather than the star’s. There is precedent in so-called Peter Pan disks, which survive far longer than standard disk-evolution models predict, around other young stars. GJ 3090 b might be a snapshot of what happens when one of those long-lived disks finally does form planets, and the planets turn out to be running around the wrong way, in the wrong direction.

The takeaway is that this is the kind of measurement that quietly resets how a discovery category gets built. Until now, retrograde exoplanets were a hot-Jupiter phenomenon with a tidy dynamical explanation. Now there is a sub-Neptune on a 2.9-day orbit around a small red dwarf, and the dynamical explanation has fallen away. NIRPS will keep taking data, and the same technique can be applied to any of the dozens of transiting M-dwarf planets already on the books. Carteret’s team plans to extend the survey, and at least one follow-up is already in the queue. Whether GJ 3090 b turns out to be a one-off oddity or the first example of a new population of backwards travelers around small stars is the question that the next year or two of observations will answer.


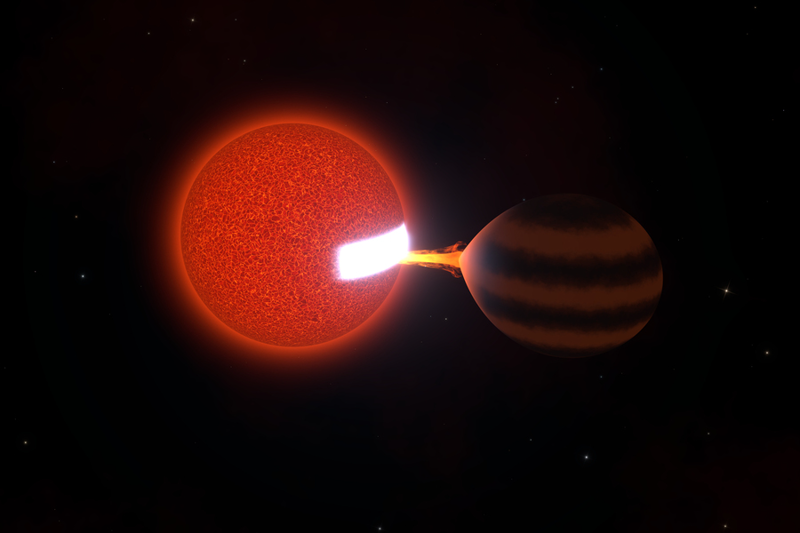
Artist's impression of ZTF J0440+2325, with a brown dwarf (right) orbiting a red dwarf (left) every 86 minutes and 39 seconds; material overflowing the brown dwarf's Roche lobe streams across the inner Lagrange point and strikes the red dwarf's surface, heating a white hot spot that produces the triangular light curve seen in the Zwicky Transient Facility data. Image: Aaron Householder (MIT); full-resolution asset at MIT News, via the article on the discovery at news.mit.edu/2026/astronomers-catch-star-slowly-snacking-on-brown-dwarf-1005.


Roughly 300 light-years from Earth, in a part of the Milky Way that no catalogue has bothered to name, two objects circle each other every 86 minutes and 39 seconds. One is a small star, a red dwarf about 85 times the mass of Jupiter. The other is a brown dwarf about 25 times Jupiter’s mass, an object too heavy to be a planet yet too light to fuse hydrogen the way stars do. They orbit so close together that the entire configuration would fit inside the diameter of the Sun. And the smaller one has been quietly leaking material onto the larger one, at a rate slow enough that the larger object will be feeding on its neighbour for billions of years. The system, named ZTF J0440+2325, is described in a paper appearing today in Nature Astronomy by Aaron Householder, Kevin Burdge, and collaborators at MIT and partner institutions, and reported in a parallel MIT News feature by Jennifer Chu. It is the first confirmed case of stable, long-lived mass transfer from a substellar object onto a main-sequence star, and it pulls a tidy assumption about what happens to planets and brown dwarfs that end up too close to a star.

The tidy assumption is the swallow-engulfment model. When a planet, a brown dwarf, or any other substellar object drifts close enough to its host star, the standard picture is that the host tidally strips or disrupts it on a short timescale. The engulfed material gets swallowed and incorporated into the star, the companion disappears, and the binary turns into a single object with a slightly higher mass. This is the fate that astronomers have routinely inferred from observations of close white-dwarf and neutron-star binaries, and it is the fate that theory predicts for the Earth when the Sun leaves the main sequence in five billion years and expands into a red giant. The brown dwarf in ZTF J0440+2325 was supposed to be on the same conveyor belt, dragged inward by tidal friction and consumed on a timescale of thousands to millions of years. Instead, it is doing something much slower and stranger. It is leaking material onto its companion at a rate of about one hundred-thousandth of an Earth mass per year, a number the team works out in the Nature Astronomy paper using the photometric wobble of the binary and the assumption that the donor is overflowing its Roche lobe along the L1 Lagrange point. That is about 40 million dump trucks of material per year by the team’s own analogy, a quantity that sounds large but is a tiny fraction of the brown dwarf itself. The star will not run out of food before the Galaxy ages out from under it.

What the team saw first was the triangular waveform. The Zwicky Transient Facility, a wide-field optical time-domain survey that uses a camera on the 48-inch Samuel Oschin Telescope at Palomar Observatory in California, had been picking up a strange light curve from a star in Taurus for several years. Supernova light curves are bell-shaped: gradual rise, peak, gradual fade. Buried in the ZTF archive was a signal that did not look like a bell at all. It looked like a triangle, repeating on a period of about 87 minutes, with no counterpart at other wavelengths and no obvious explanation. Burdge, an assistant professor of physics at MIT who had been searching the ZTF data for periodic variables, noticed it during a search for a different kind of system. He originally suspected a “black widow binary,” the colloquial name for a millisecond pulsar that is slowly eroding a low-mass stellar companion with its particle wind and radiation. In a black widow, the optical light curve wobbles because the companion is being whipped around the much heavier neutron star, and the orbit usually shows a clean Doppler signature of that motion. The ZTF light curve did not wobble in the same way, which is what tipped the team off that the two objects were not a David-and-Goliath pair but a more balanced system in which neither dominates. Householder, a graduate student in MIT’s Department of Earth, Atmospheric and Planetary Sciences, reanalysed the ZTF photometry and combined it with follow-up time-series spectroscopy. The wobble was small, the spectrum showed hydrogen and helium emission lines characteristic of an M dwarf, and the orbital fit locked the masses at roughly 85 and 25 Jupiter masses. The orbit fit inside the Sun.

The simulation work clinched the picture. Once the team had a mass, a radius, and an orbital geometry, the next question was whether the brown dwarf was overflowing its Roche lobe, the teardrop-shaped region of space around a body in a binary inside which material is bound to that body. If the brown dwarf were inside its Roche lobe, no mass transfer would be possible; the two objects would simply orbit forever without exchanging material. If the brown dwarf were overfilling the lobe, material would spill through the L1 point and rain down on the companion’s surface. The team ran a set of smoothed-particle hydrodynamics simulations with the measured masses, the measured orbital separation, and a brown-dwarf radius tuned to match the photometric brightness. The simulated test particles do not orbit the brown dwarf indefinitely; they stream across the L1 point and pummel the surface of the red dwarf at high speed. The team describes the geometry as more like an asteroid hitting the Moon than the usual accretion disk around a black hole or a neutron star, where material spirals inward through a flattened disk before settling onto the central object. In ZTF J0440+2325, the brown dwarf is too small for its own gravity to capture the inflowing material into a disk, so the stream lands directly on the surface and heats a roughly circular hot spot at the impact point. That hot spot is what produces the triangular waveform. As the brown dwarf orbits, the hot spot rotates in and out of view, and the system brightens when the hot spot faces Earth and dims when it faces away. The peak of the triangle is the moment of direct face-on view, when the impact fireball is brightest.

The mass-transfer rate is low enough that the system is genuinely stable on astrophysical timescales. Most binary mass transfer is unstable on some level: the donor shrinks as it loses mass, the orbit responds by widening or shrinking in ways that either accelerate or choke off the transfer, and the system either spirals toward a common-envelope merger or settles onto a longer-period detached configuration. What the simulations show for ZTF J0440+2325 is the rarer case in which the mass-loss timescale of the brown dwarf and the angular-momentum loss timescale of the orbit are tuned just right that the rate stays roughly constant for hundreds of thousands of years and may hold for the entire remaining lifetime of the brown dwarf, on the order of billions of years. The brown dwarf, as a substellar object, cannot fuse hydrogen and so does not have a main-sequence lifetime in the usual stellar sense, but it has a thermal-cooling timescale, and the team argues that the binary will outlive that timescale many times over. The brown dwarf will not be eaten quickly. It will be eaten slowly, continuously, and quietly, and the Galaxy will be a different place by the time the meal is finished.

What the team plans to look for next is more of the same. The triangle-shaped light curve is a distinctive signature, and the ZTF archive contains years of survey photometry that have not been systematically searched for it. The paper names a second candidate, ZTF J1444+4820, with an even shorter 67-minute period and a similar wobble signature. If that system confirms, the slow-eating configuration stops being a one-off and becomes a routine endpoint of binary evolution when the masses and separation land in roughly the right place. The triangular waveform, the small wobble, and the absence of a Doppler signature that would betray a heavy compact object are the three ingredients of the search. The same configuration, in principle, applies to small stars and giant planets, and the team plans to look for those as well. The conventional picture of close planetary companions has to share the page with a quieter alternative: a slow, steady meal that outlasts planets.


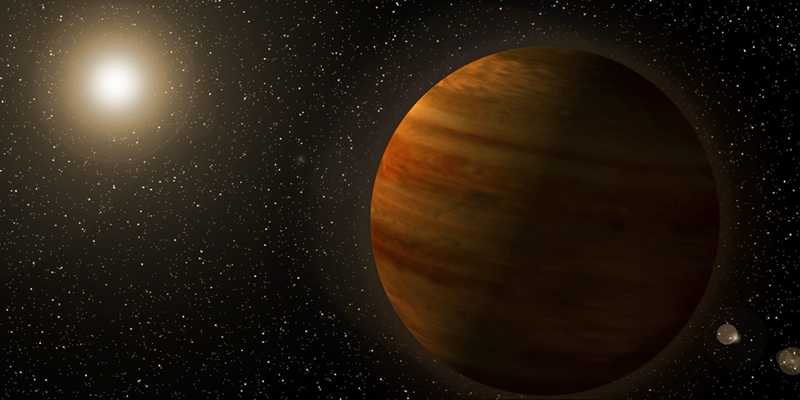
Artist's concept of the super-Jupiter Gaia23bra b, a banded gas giant orbiting its orange dwarf host star at a Jupiter-like distance. Image credit: NASA's Goddard Space Flight Center.

(image source)


A super-Jupiter twelve times farther than TESS can usually see, hiding in eight years of archived photometry, pulled out by a physics trick first described in 1936. Gaia23bra b is the first world the Transiting Exoplanet Survey Satellite has ever confirmed by gravitational microlensing, and the result quietly resets how a mission is used.

The signal was small. A background star out near the galactic plane brightened slightly as a foreground orange dwarf drifted across our line of sight. ESA’s Gaia spacecraft flagged the brightening in 2023 as a routine gravitational lensing event and dropped it in the alert stream. TESS happened to be staring at the same patch of sky, taking 27-day blocks of images for its usual transit hunt, and captured the same brightening with finer time sampling. Three years later, when Mallory Harris at the University of New Mexico pulled TESS’s archive, she noticed a tiny extra wiggle in the light curve, a five-day deviation that Gaia had missed because Gaia was sampling too sparsely. That wiggle was a planet. The paper went on the arXiv on July 1, 2026, and into The Astrophysical Journal Letters the same day (arXiv:2607.01853).

The headline number is just how far away the host system is. TESS was built to chase transits of bright, nearby stars, with its catalog reaching out to about 150 light-years. Gaia23bra b sits at roughly 40,000 light-years, deep in the galactic plane, on the far side of the galaxy’s disk from us. Detecting a planet there was not in the original mission plan, and that is what makes the result interesting.

Microlensing is the only planet-finding method that depends on distance rather than proximity to Earth. Transits need repeated passes in front of the star, so TESS sticks to bright nearby targets. Radial velocity gets harder as the star gets fainter. Direct imaging works for young planets still glowing from formation heat, typically hundreds of light-years away.

Microlensing needs only one alignment between a foreground star and a more distant background source. The foreground star’s gravity bends the background light into a brief magnifying-glass spike, and any planet orbiting the lens star leaves its own tiny extra spike on top. The alignment never happens twice. As Harris put it, microlensing events “happen once and they’re gone.”

Less than 5% of the more than 6,000 known exoplanets were discovered this way, according to NASA’s Goddard release on the result. Almost all came from ground-based surveys designed specifically for microlensing. The new detection is the first time a survey telescope built for something else has caught a microlensing planet in its own data. TESS has been staring at almost the whole sky on a rolling basis since 2018.

The find points forward to NASA’s next flagship astrophysics mission. The Nancy Grace Roman Space Telescope, currently scheduled for an August 30, 2026 launch from Kennedy Space Center, will spend one of its core surveys staring at the galactic bulge, where the stellar density makes microlensing alignments common. Co-author Michael Fausnaugh of Texas Tech, quoted in the NASA release, calls the TESS detection “a bit like a preview of the microlensing NASA’s Nancy Grace Roman Space Telescope will do.” Roman is projected to find roughly a thousand microlensing planets and a hundred thousand transiting planets across its primary mission.

The trigger was not new TESS data but the existing archive, re-read. Harris and her collaborators at the University of New Mexico, NASA Goddard, Texas Tech, and partner institutions were testing whether TESS’s short-cadence light curves contained enough information to recover microlensing signals at all. TESS full-frame images stack into 30-minute cadence products and 200-second cadence for selected targets, dense enough that a small planet-induced anomaly should be visible if you know where to look.

The team went looking in the eight-year archive for events Gaia had flagged as lensing candidates but could not resolve. Gaia23bra was a textbook case: Gaia saw the main brightening, a roughly 30-day event, but the planet’s signature sat on top as a small, sharp deviation that Gaia’s sparse sampling averaged out.

When Harris pulled TESS data for the same coordinates, the planet’s signature was sitting right there. The deviation lasted about five days and produced a measurable second-order change in the light curve that the team modeled as a second lens, in microlensing jargon, a binary-lens event with a planetary-mass companion. The recovered planet, Gaia23bra b, is roughly 1.6 times Jupiter’s mass on a Jupiter-like orbit around an orange dwarf star about 80% of the Sun’s mass. NASA’s release summarizes it as a “super-Jupiter” in a configuration the mission was not designed to find.

Co-author Diana Dragomir, also at the University of New Mexico, told the NASA press operation that “the discovery implies that there are probably other so-called microlensing planets hiding in TESS’s data that we hadn’t previously thought to look for.” Eight years of TESS full-frame images are now a searchable microlensing archive. More detections are likely; the next round of candidates is still being checked.

The Gaia side of the story closes a separate loop. Gaia finished its extended science mission earlier in 2026, ending a roughly 12-year astrometry run that produced the largest three-dimensional map of the Milky Way. Gaia23bra b is one of the last planets Gaia will help find, and shows how Gaia and TESS were complementary: Gaia’s wide-field coarse cadence for the alerts, TESS’s narrow-field fine cadence for the follow-up.

The underlying physics is the lensing effect Einstein described in general relativity. A massive object between a distant light source and an observer bends the source’s light around itself, producing two distorted images that are usually unresolved, so the source just appears brighter. A planet orbiting the lens acts as a smaller secondary mass that produces its own brief spike on top of the main brightening.

The size of that spike depends on the Einstein radius, scaling with the square root of the lens mass times the distances involved. For a stellar-mass lens halfway across the galaxy and a background source further away, the event lasts weeks, and the planet’s spike shows up over a few days, which is why the TESS team’s detection was a five-day feature on a roughly 30-day main event.

Two practical issues make the detection hard. The first is degeneracy: a single-lens fit can soak up most of the brightening, leaving a small residual that could be a planet, a stellar companion, or noise. Resolving it requires dense photometry where the planet’s signature shows up, which is what TESS provides and Gaia did not.

The second issue is the galactic-plane background. Toward the bulge and inner disk, stars are packed so tightly that a TESS pixel, about 21 arcseconds across, often contains multiple stars whose light blends together. The team’s workaround was to lean on Gaia’s catalog to decompose the TESS photometry into individual stars, then run the microlensing model on the cleaned light curve.

The Roman connection closes this loop. Roman’s Wide Field Instrument has roughly 100 times TESS’s collecting area and a pixel scale around 0.11 arcseconds versus TESS’s 21 arcseconds, which kills the blending problem for the bulge region. Where TESS catches a microlensing planet by lucky overlap, Roman runs a continuous survey of the densest lensing regions. The two missions cover different parts of the galaxy, with TESS’s strength being the rest of the galactic plane where stars are sparser.

The discovery does not change what we know about how planets form. The deeper lesson is that eight years of archived TESS photometry is now a real microlensing dataset, and the analysis pipeline used here is reproducible. Expect follow-up papers searching the TESS archive for additional Gaia-flagged lensing events with high-cadence follow-up available.

The next concrete milestone is Roman’s launch on August 30, 2026, which moves microlensing from the realm of niche ground-based surveys into a flagship-class statistics engine. Roman’s projected yield of around a thousand microlensing planets, paired with TESS’s growing archive of opportunistic microlensing detections, will start to give a real census of planets at Jupiter-like orbital distances across the galaxy. Gaia23bra b is the first data point on the TESS side of that census, and it arrived just in time for the Roman team to use as a worked example in their own planning.


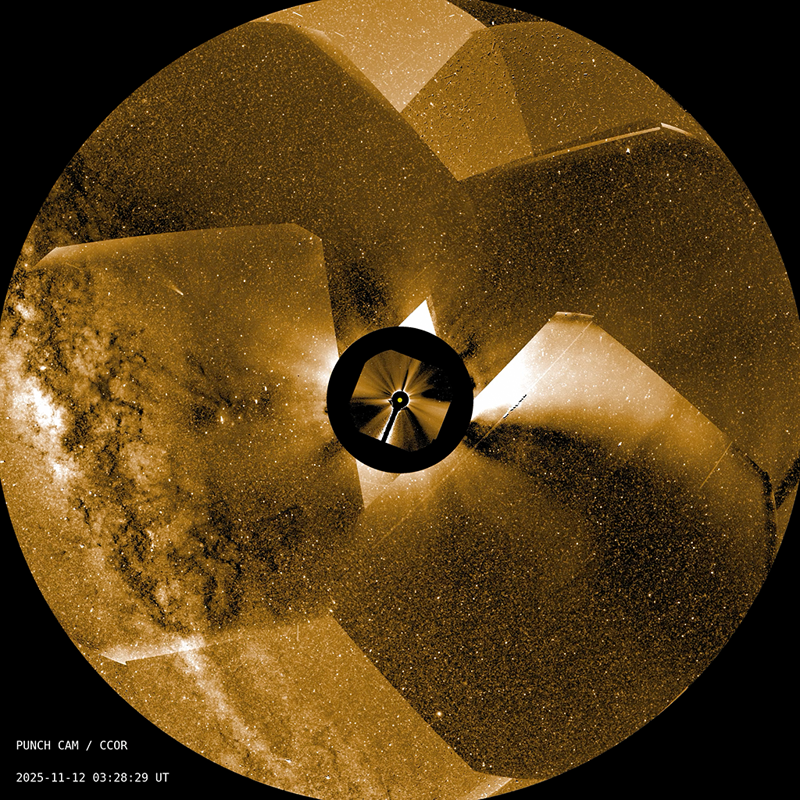
A PUNCH Wide Field Imager mosaic of the inner solar system taken on November 12, 2025, showing the Sun's corona as a glowing golden disk with the central disk blocked by the coronagraph, the Milky Way curving along the left edge, and the outlines of several large coronal mass ejections radiating outward from the occulted Sun. Image: NASA/SwRI, PUNCH mission, NASA SVS 31381.


On the morning of August 4, 2026, a heliophysics team gathered at the Committee on Space Research Scientific Meeting in a windowless conference room and ran a video. The video showed a cloud of charged plasma leaving the Sun on May 31, 2025, and then kept watching it, frame by frame, as it crossed the inner solar system. Twelve hours after the eruption, a basic tracking model settled on an arrival time. Eight hours later, the cloud actually showed up. The forecast was accurate to within thirty minutes, an order of magnitude better than what operational forecasters can currently hand to a satellite operator or a power grid manager. The image stream that made it possible came from a constellation of four small NASA satellites that almost no one was talking about a year ago, called PUNCH, the Polarimeter to Unify the Corona and Heliosphere.

Solar storms are the part of space weather that hits infrastructure. A coronal mass ejection that reaches Earth compresses the magnetosphere, drives geomagnetic currents through long conductors, and can knock out high-voltage transformers, satellite electronics, and GPS-based timing. The 1989 Hydro-Québec blackout, which left six million Canadians without power for nine hours, began with a CME. The 2003 Halloween storms disrupted GPS, aviation, and the Japanese ADEOS-2 spacecraft. Satellites in low Earth orbit experience increased atmospheric drag during geomagnetic storms, and astronauts on the way to the Moon or Mars need to know when to take shelter.

The forecasting problem is that the Sun is 93 million miles away and a CME traveling at a million miles per hour takes about 15 to 18 hours to reach Earth. That is a long enough lead time to act, but only if you know when the cloud will arrive. The current operational model, called WSA-ENLIL, was put into service by NOAA’s Space Weather Prediction Center and uses a 1-to-4-day cone projection that gives a forecast window of about 5 hours. The 30-minute result from PUNCH is roughly ten times tighter, and it came from a deliberately simple model that the team describes as the “steam engine” version of what could be built on top of the same data.

PUNCH launched on March 11, 2025, from Vandenberg Space Force Base in California, sharing a Falcon 9 ride with the SPHEREx sky mapper. All five satellites separated from the same upper stage, and the four PUNCH spacecraft (three carrying Wide Field Imagers and one carrying the Narrow Field Imager) began climbing into a polar, low Earth orbit (Wikipedia: PUNCH; SwRI mission page). First light came on April 14, 2025, with the NFI and one WFI snapping their inaugural images, and the other two WFIs following two days later (NASA SVS PUNCH first-light CME images). By late May the spacecraft were returning daily mosaics wide enough to track a single CME from the corona all the way out to where Earth sits.

The team chose a specific event as their test case: a coronal mass ejection that left the Sun on May 31, 2025. The leading edge of the cloud moved through the inner solar system, and PUNCH’s three WFIs captured it every four minutes throughout the journey. The researchers fed those images into a basic forward model that had no deep learning, no physics-specific tuning, and no prior knowledge of the speed or geometry of the cloud. The model extracted the position and motion of the leading edge from the imagery and converged on an arrival time forecast roughly twelve hours after the eruption. That settled forecast was accurate to within 30 minutes of the actual arrival, a 10× improvement over the 5-hour window from the current operational approach, which uses the WSA-ENLIL cone model (NOAA SWPC WSA-ENLIL; NASA Science release).

“We thought PUNCH would be good at this, but it’s a stunning result,” said Craig DeForest, the principal investigator at Southwest Research Institute’s Solar System Science and Exploration Division in Boulder. “To put it in perspective, this could be the space weather equivalent of going from a steam engine to a modern internal combustion engine.” The model also revealed when its own estimate had stabilized, which is a useful property for forecasters because it tells them when the prediction is safe to act on.

PUNCH is built to do something the previous generation of coronagraphs could not: keep its eyes on a single coronal mass ejection for the entire Sun-to-Earth journey. The big European-NASA SOHO spacecraft, launched in 1995, carries the LASCO coronagraph that has been the workhorse of CME forecasting for three decades, but LASCO’s field of view cuts off at about 32 solar radii (NOAA SWPC CME overview). Beyond that, a CME becomes too faint and too far from the Sun’s bright disk for a coronagraph to track. The gap between LASCO’s edge and Earth is roughly 80% of the journey, and most of the guessing in the current 5-hour forecast window comes from that gap.

PUNCH’s three Wide Field Imagers extend that view out to 180 solar radii, while the Narrow Field Imager, a coronagraph similar in spirit to LASCO C3, covers 6 to 32 solar radii. Where the design is unusual is in the polarimetry: rather than just taking pictures, the WFIs measure the polarization of the sunlight scattered by free electrons in the corona and solar wind, which lets the team separate the K-corona (the part of the corona made of solar plasma) from the background starfield, zodiacal light, and Milky Way. The reduction pipeline aligns images from all four spacecraft to within 0.03 pixels of each other and produces a single 4-minute-cadence polarimetric image covering a 90° field of view centered on the Sun (NASA SVS PUNCH Instruments).

The forecasting work uses that data in a deliberately simple way. The model segments the moving leading edge of the CME, fits kinematics to its position over time, and projects the arrival by extrapolating the speed and direction. It does not currently include physics for how a CME decelerates against the ambient solar wind, rotates as it expands, or interacts with earlier ejections. The fact that a basic kinematic model still beats the operational cone model by a factor of ten is the headline: more physical realism, and more PUNCH data, will only sharpen it. DeForest’s team has also begun using the high-resolution imagery to see that CMEs are clumpier than previously thought and continue to evolve as they travel, which is itself new physics for the forecast models to absorb.

PUNCH’s first forecast result is a proof of concept rather than a finished system. The model that produced the 30-minute window is not yet integrated into NOAA’s operational forecasting pipeline, and the August 4 announcement at the Committee on Space Research Scientific Meeting is paired with a paper currently under review at the journal Space Weather (NASA Science release). The next steps are obvious and on the team’s roadmap: refine the model, run it on a larger sample of CMEs, and hand it to SWPC for testing. If the gain holds across more events, the practical effect is that satellite operators can keep a spacecraft in safe mode for a shorter window, power grid dispatchers can stand down earlier, and crewed deep-space missions can plan around tighter storm arrival predictions. The CMEs that PUNCH is now watching arrive and evolve across the inner solar system will keep teaching the team how the Sun connects to the space weather we feel on Earth.