OrbitalHub

Where curiosity reaches escape velocity.

Domain is for sale. $50,000,000.00 USD. Direct any inquiries to contact@orbitalhub.com.

Archive for the Astronomy category

October 24, 2026

Mega-Earths may be stellar noise

Posted by


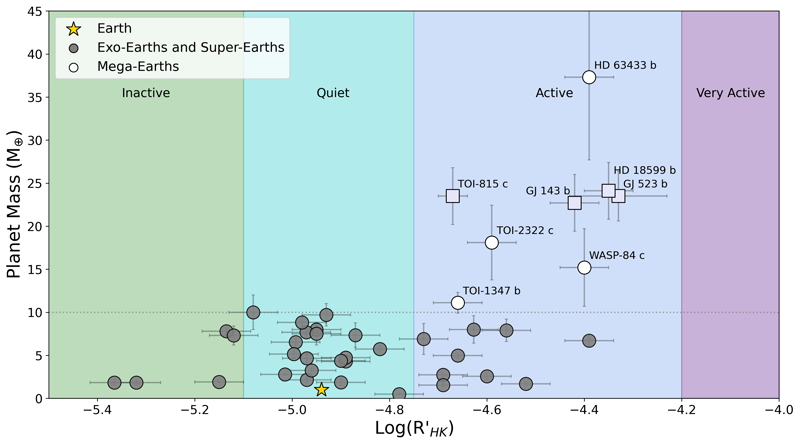
Planet mass plotted against host stellar activity for 333 small exoplanets, with Mega-Earth candidates as open white circles clustered on the Active and Very Active side and ordinary rocky planets as gray circles spanning the inactive through active range


A planet heavier than Neptune but the size of Earth should not, by the rules of how planets form, be a rock. Anything above roughly ten Earth masses is supposed to grab gas from the protoplanetary disk and become a sub-Neptune or larger. Yet a small catalog of worlds has long carried the label “Mega-Earth,” rocky objects sitting above that ten-Earth-mass line, and that label itself colors what people assume about planet formation at the upper end of rocky worlds. A paper published today by Casey Brinkman and Nicolas Cowan at McGill’s Trottier Space Institute argues that the entire category may be a measurement artifact (Brinkman & Cowan 2026, arXiv:2610.12600, reported on by Astrobiology.com the same day). Every candidate Mega-Earth in the literature, the authors show, orbits a magnetically active star. Active starspots and plages mimic and inflate the radial-velocity signal of an orbiting planet, and the chance that all of these outliers would land on active hosts by coincidence is below one percent. The implication is uncomfortable but specific. The Mega-Earths were never there. The detection technique was just seeing starlight flicker, and the label stuck because the underlying objects were just hard enough to disprove.

The category was supposed to mark the upper edge of rocky planet formation. When Xavier Dumusque and colleagues at the Harvard-Smithsonian Center for Astrophysics used the HARPS-N spectrograph on La Palma in 2014 to weigh Kepler-10c, the result landed at seventeen Earth masses packed into a radius only 2.35 times Earth’s (Harvard Gazette, June 2014). That density, on the order of seven grams per cubic centimeter, was consistent with a compressed rocky interior under extreme pressure. The team coined the term “Mega-Earth” (Wikipedia: Mega-Earth) on stage at the Boston meeting of the American Astronomical Society, and Dimitar Sasselov called Kepler-10c the “Godzilla of Earths.” The discovery paper was published in The Astrophysical Journal in June 2014. Subsequent surveys added more candidates with apparent masses between ten and forty Earth masses and radii sitting inside the rocky planet regime, and at various points the literature has listed six to eight such worlds, depending on which mass-radius cuts are applied. Each one pressed against a theoretical limit set by collisional mantle stripping and post-formation erosion that no primordial rocky planet should be able to cross.

What jumps out of the resulting scatter plot is that every white-circle Mega-Earth candidate lies on the active side, while the gray-circle population of ordinary rocky and sub-Neptune-mass planets spans inactive through quiet. The four Mega-Earths the authors identify, WASP-84 c, TOI-1347 b, TOI-2322 c, and HD 63433 b, all orbit stars with log R prime HK above negative four point seven five. Three additional planets sit close to the Mega-Earth density regime: GJ 523 b, TOI-815 c, and HD 18599 b. All seven orbit active stars. The probability of that alignment by chance, given how many inactive and quiet-host rocky systems exist in the same sample, comes out below one percent. The authors also note that a previously Mega-Earth-classified world, HD 119130 b, was already re-measured by another group and found to have an inflated mass caused by constructive interference between the planet’s orbital signal and the star’s rotational modulation.

The mechanism behind the contamination is well known but tricky to remove. Starspots and the brighter magnetic regions called plages move across the disk of a rotating star and produce Doppler shifts in the integrated starlight that are indistinguishable, in many pipelines, from the reflex motion of a planet. Starspots suppress local convection and produce false radial-velocity signals at the star’s rotation period. Plages do the same at somewhat different amplitudes. When a planet’s orbital period happens to land near an integer or half-integer multiple of the star’s rotation period, the two signals can constructively interfere and inflate the inferred planet mass by a factor of two or more. That is the situation for several of the candidate Mega-Earth hosts, whose TESS light curves show clean rotational modulation at periods from roughly four to fourteen days. The full radial-velocity datasets that yielded the published masses came from public archives including the NASA Exoplanet Archive, which compiled discovery spectra from HARPS, PFS, and TESS follow-up campaigns. Gaussian-process regression, the tool most often used to handle stellar activity in radial-velocity fits, is only as good as its kernel choices and its priors. When the kernel is too smooth, the process absorbs genuine planetary motion as activity noise. When it is too wiggly, activity noise leaks into the planetary model and inflates the mass.

What the paper does not do is rule out rocky planets above ten Earth masses on theoretical grounds. The runaway gas accretion argument sets ten Earth masses as the threshold above which a core cannot avoid grabbing gas during formation, but it is a threshold, not a wall. Collisional mantle stripping after disk dispersal or photoevaporation of a once-larger planet’s envelope can, in principle, leave a bare rocky remnant. The authors are explicit that those pathways remain possible, just unproven. The Mega-Earth label, in their framing, has been applied to planets whose mass measurements cannot yet distinguish between a real ultra-dense rocky world and a noisy radial-velocity fit around an active star. Re-observing these systems with ESPRESSO on the Very Large Telescope, with HARPS on the TESS-Keck Survey infrastructure, or with NIRPS at La Silla, all of which have the spectral resolution to see activity-induced line-profile variations directly, would settle the question. Several of the candidate Mega-Earths have already been on those queues. The paper, which appeared on the arXiv preprint server on 8 October 2026 and is now in the resubmission cycle for The Astrophysical Journal Letters, lands in a catalog of corrections that have repeatedly eaten specific claimed populations of extreme exoplanets. Stellar contamination has eaten mini-Neptunes hiding inside hot-Jupiter mass measurements, cold Jupiters past ice lines that were artifacts of magnetic cycles, and small-radius planets that turned out to be diluted binaries. Each time, the underlying detection method is sound for inactive host stars and quietly wrong for active ones. Adding Mega-Earths to that list is, in a way, an expected move. The catalog of rocky worlds stays grounded. The Ultra-Massive Rocky Planet threshold, if it exists at all, moves somewhere more difficult to measure from the ground, perhaps requiring JWST transmission spectroscopy of these same systems to constrain atmospheric mass, or years of radial-velocity monitoring as activity cycles rotate through minimum phases. For now the simple chart is enough: a horizontal line at ten Earth masses, with seven suspected outliers sitting on the active side and zero on the quiet side. Pattern recognition cut the question in half.
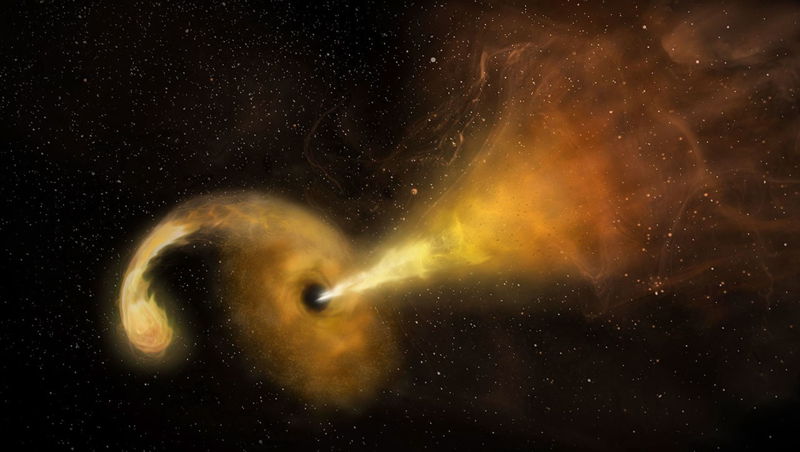


Artist's concept of a black hole pulling apart a star, with glowing debris curling into a disk and a bright jet streaming to the right


A flare appeared in November 2025 near the outer edge of a galaxy in Cetus. It shone in ultraviolet light with roughly the output of 10 billion Suns and, for a few months, outshone the galaxy itself. That sounds like the sort of event astronomers would notice immediately. The awkward part was its address.

The flare sat more than 30,000 light-years from the galaxy’s center, nowhere near the central supermassive black hole that should have been capable of producing it. Follow-up observations nevertheless showed the signature of a star pulled apart by a massive black hole. The event, named TDE 2025abcr, had exposed an otherwise dark object wandering through the galactic outskirts.

The NASA account of the discovery describes it as the most distant-from-center example of its kind. More important than the record is how it was found: a search deliberately stopped assuming that a galaxy’s biggest black holes must stay in the middle.

Artist’s concept of a tidal disruption event. Credit: NRAO/AUI/NSF/NASA. NASA JPL image page.

Supermassive black holes are usually found through their effects rather than by seeing the objects themselves. At a galaxy’s center, the surrounding stars and gas provide several ways to measure an unseen mass. Far from the nucleus, a quiet black hole can disappear against the sky. It may reveal itself only when matter falls in.

Tidal disruption events offer that brief illumination. NASA estimates that one occurs in a given galaxy about once every 100,000 years, while surveys find roughly 30 across the sky each year. Until recently, optical searches concentrated on galactic nuclei. That was a reasonable filter because known supermassive black holes lived there, but it also built the expected answer into the search.

TDE 2025abcr shows what happens when that positional filter is relaxed. The accepted paper and open preprint calls it the first optical tidal disruption event discovered in the outskirts of a host galaxy. Its inferred black hole mass is about 10^6.09 solar masses, far below the roughly 10^8.82-solar-mass black hole estimated at the host’s center. One galaxy may therefore contain two massive black holes with very different histories and locations.

Finding more such objects would put numbers on a poorly measured population. Wandering black holes preserve evidence of galaxy mergers, stripped dwarf galaxies, and gravitational encounters among black holes. They also test whether catalogs built around bright galactic centers have missed a class of massive objects hiding in plain sight.

The Zwicky Transient Facility, or ZTF, first flagged the brightening in November 2025. ZTF surveys the northern sky from Palomar Observatory and produces an enormous stream of changing points. According to NASA, about half a million flashes are detected each night. A custom version of the machine-learning classifier tdescore examined that stream without requiring candidates to coincide with a galaxy nucleus. It recognized the light curve of TDE 2025abcr even though the source was well off-center.

That initial match was only a prompt for more observing. The galaxy WISEA J014656.04-152214.7 lies about 750 million light-years away. The transient was separated from its nucleus by 9.5 arcseconds, corresponding to a projected distance of 9.3 kiloparsecs. Spectra from ground-based telescopes, including the SOAR telescope in Chile, showed hydrogen and helium emission associated with a tidal disruption event. NASA’s Neil Gehrels Swift Observatory then supplied ultraviolet and X-ray measurements unavailable from the ground. Swift’s ultraviolet telescope measured a temperature near 30,000 degrees Celsius.

Together, the light curve, spectrum, temperature, and location ruled out more ordinary explanations. The researchers classified the source as a hydrogen-and-helium tidal disruption event. Scaling relations between peak luminosity and black hole mass gave an estimate of 10^6.09 solar masses, with an uncertainty of 0.53 dex. That uncertainty is broad, but the result still separates the wandering object from the much heavier black hole expected in the main galaxy’s nucleus.

How did it get there? The team offers two possibilities. In one, several galaxies merged and the interaction among their central black holes ejected the lightest one toward the outskirts. In the other, the black hole remains at the center of a faint dwarf galaxy now being stripped during a minor merger. The dwarf’s stars may be too dim or too dispersed to stand out in current images.

Those explanations can be tested. Deep late-time imaging, after the flare fades, could expose a faint stellar system around the black hole. More off-nuclear events would reveal whether large offsets favor one merger history over another. The paper places the rate of events more than 3 kiloparsecs from a nucleus below 10 percent of the nuclear TDE rate, while predicting that the Vera C. Rubin Observatory could find dozens with resolvable offsets each year.

The timing has an engineering wrinkle. Swift’s pointed observations are temporarily suspended while the mission awaits an orbit boost. Its primary mission ran from 2004 to 2006, yet it has continued watching the changing sky for more than two decades. Rubin can supply a much larger optical sample, and NASA’s Roman telescope can extend the search to greater distances. Swift, once normal operations resume, remains useful for the ultraviolet and X-ray follow-up that turns an unusual point of light into a physical diagnosis.

A tidal disruption begins with a gradient. Gravity is stronger on the side of a star facing a black hole than on the far side. If the star passes close enough, that difference overwhelms the star’s self-gravity. The star stretches, breaks apart, and becomes a stream of gas. As the NASA tidal disruption explainer shows, some debris escapes while some returns, collides, heats up, and gathers around the black hole.

The rough boundary is the tidal radius, often written as r_t approximately equal to R_star times (M_BH/M_star)^(1/3). A larger star is disrupted farther out. A more massive black hole also raises the tidal radius, but only with the cube root of its mass. The event horizon, by contrast, grows directly with black hole mass. This difference explains why a million-solar-mass black hole can tear a Sun-like star apart outside its horizon, where the hot debris remains visible.

The flare is not a photograph of the black hole. It is radiation from gas responding to extreme gravity. Ultraviolet temperature constrains the hot emitting region. Spectral lines identify elements and track changing velocities. X-rays probe hotter material closer to the compact object. None of these measurements alone settles the case; their agreement does.

The classifier solves a different problem. A survey camera records real transients alongside variable stars, supernovae, moving objects, and instrumental artifacts. A model trained on known tidal disruption light curves can rank candidates, but a model trained only on nuclear examples may learn location as a shortcut. The off-nuclear version of tdescore removed that shortcut. Its success is a clean lesson in survey design: changing a selection rule can reveal objects the telescope had already become capable of seeing.

TDE 2025abcr did not make a wandering black hole appear. It made one observable for a few months. A star supplied the fuel, ZTF caught the changing light, and Swift helped establish what produced it. The result is a black hole of roughly a million solar masses projected 9.3 kiloparsecs from the center of a massive galaxy.

The remaining question is whether this object was kicked out of a galactic nucleus or still occupies the fading core of a stripped dwarf. Late-time imaging may answer that for this system. Rubin’s larger alert stream can answer the population question by finding enough examples to compare.

The useful change was modest: researchers searched outside the place where theory and habit told them to look. If Rubin finds the predicted dozens of resolvable off-center events each year, TDE 2025abcr will become less of an oddity and more of a map marker for a hidden population moving through galactic outskirts.


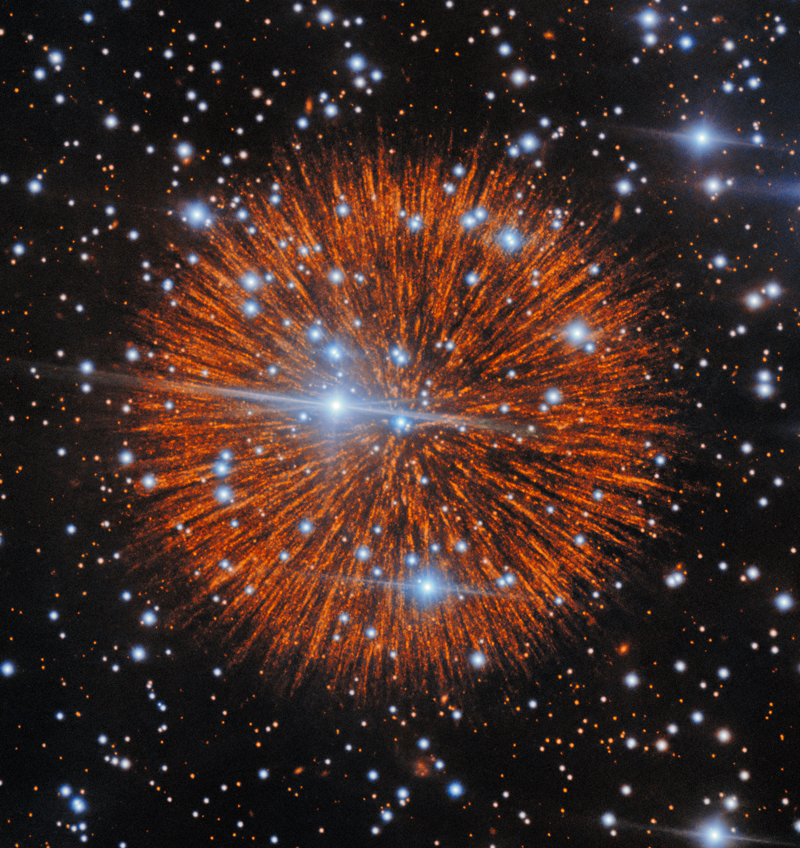
Gemini North narrowband image of the supernova remnant Pa 30, captured with GMOS in [S II] and [O III] filters showing the orange radial filaments resolved into cascades of small knots around the bright blue central star, IRAS 00500+6713.


In the constellation Cassiopeia there is a small, oddly symmetrical puff of gas that, on the best nights, looks like a firework frozen at the instant it bursts. Astronomers call it Pa 30, and it is the leading candidate for the remains of a supernova that flared over China, Japan, and the medieval Middle East in the summer of 1181. New narrowband imaging from the Gemini North telescope on Maunakea, published on 6 October 2026 in The Astrophysical Journal, shows that Pa 30’s famous radial filaments are not smooth streamers at all. They are chains of small, evenly spaced knots of gas, lined up like beads on a string along every spoke of the nebula, and the new observations resolve about ten times more of them than any previous study had seen (Cunningham et al. 2026 ApJ; NOIRLab press release). That changes what astronomers thought they were looking at, and it gives the field a way to measure how the ejecta of an 850-year-old failed thermonuclear supernova actually broke up as it ran outward.

Pa 30 was nothing more than an entry in a star catalogue until 2013, when an American amateur astronomer named Dana Patchick, sorting through Wide-field Infrared Survey Explorer data for a citizen-science hunt for planetary nebulae, picked out a previously unrecognized infrared source he labelled “Pa 30” (Sci.News). Follow-up imaging on the 2.1-metre telescope at Kitt Peak and then the 2.4-metre Hiltner telescope revealed a faint nebula threaded by remarkably straight radial filaments, almost perfectly circular in outline, with a hot blue star at the centre (Cunningham et al. 2026 arXiv:2610.06424). The reason that matters is that a normal Type Ia supernova is the catastrophic disruption of a white dwarf that has been pushed over the Chandrasekhar mass limit by accretion from a companion. The white dwarf is destroyed completely; no central star survives; the expanding debris forms a roughly spherical shell with no heartbeat. Pa 30 has a star at its centre that is still very much alive and very hot. Spectra put its surface temperature at roughly 200,000 kelvin and its stellar wind at about 16,000 kilometres per second (Cunningham et al. 2026 ApJ). That is the calling card of the much rarer Type Iax class, a family of faint thermonuclear explosions in which the white dwarf survives the blast, sometimes barely. Only a handful of Type Iax events have been catalogued, and Pa 30 is the only confirmed one whose remnant we can resolve in detail.

The 1181 identification is what turns Pa 30 from a curiosity into a calibration point. Eight separate texts record that a “guest star” appeared in Cassiopeia between 4 and 6 August 1181 and remained visible to the naked eye for 185 days. For decades the historical remnant was confused with the radio pulsar wind nebula 3C 58, but 3C 58 turned out to be too old to match. In 2021, Andreas Ritter and a team at Queen’s University Belfast identified Pa 30, with its associated central star (which they dubbed Parker’s Star after the Hong Kong astronomer Quentin Parker), as the much more plausible remnant of the 1181 event (Sci.News). The geometry fit: an age of roughly 850 years, a position consistent with the historical records, and an ejecta velocity near 1,000 kilometres per second. The 2026 Gemini North campaign, led by Tim Cunningham, then at the Center for Astrophysics at Harvard and Smithsonian and now at the University of Warwick, with Ilaria Caiazzo at the Institute of Science and Technology Austria, John Raymond, and Scott Kenyon, set out to see what was hidden in the filaments at the highest resolution available from the ground. They used the Gemini Multi-Object Spectrograph (GMOS) in narrowband filters tuned to the [S II] and [O III] emission lines of low-ionization gas, and took very long exposures to pull faint substructure out of the background. Each radial spoke resolved into a string of small bright knots separated by fainter gaps, marching outward from near the central object, and the [O III] imaging produced the first confirmation that the diffuse oxygen emission in the nebula is co-spatial with the sulphur filaments rather than being a separate, smoother component (Cunningham et al. 2026 ApJ).

The other headline from the same campaign is a quiet one: the centre of the nebula sits almost exactly where the central star sits. Surviving supernova remnants are expected to recoil, and models of double-white-dwarf mergers predict a kick of anywhere from a few to several hundred kilometres per second for whatever survives the blast. Cunningham and colleagues used their imaging to pin the geometric centre of Pa 30 with a Monte Carlo Markov chain and compared it to the position of the central star, concluding that any transverse kick must be under about 100 kilometres per second at the 3-sigma level (Cunningham et al. 2026 arXiv:2610.06424). That is unusually small for a merger survivor. It tightens the constraint on how energetic and asymmetric the explosion could have been, and it adds another piece of evidence that the 1181 event really was a Type Iax: a comparatively gentle thermonuclear runaway in which much of the white dwarf’s mass was ejected but a substantial core remained intact, sitting nearly where it began. What the knots themselves are made of is the open question the new data sets up. If the filaments were once smooth, their beaded structure implies either that the ejecta itself was clumpy on small scales when it was launched, or that the interstellar or circumstellar material the ejecta ran into was inhomogeneous enough to break the flow up into discrete radiative-cooling zones. The characteristic spacing Cunningham’s team measures, around 10^16 centimetres per knot, is roughly the size scale that Rayleigh-Taylor fingers in supernova remnants are expected to produce, and strings of similar knot cascades can be seen in the core-collapse remnant Cassiopeia A, although without Pa 30’s strict radial geometry (Cunningham et al. 2026 ApJ).

Follow-up is already in the queue. STScI program 18082, accepted in June 2026, will pair the Gemini narrowband imaging with a 16-orbit Hubble WFC3 campaign in [S II] to map Pa 30’s filaments across their full length, and JWST program 9111, in parallel, is using MIRI’s integral-field unit to obtain mid-infrared spectra of six bright filaments to measure their dust content and cooling balance. The combination should let the team tie the optical knots to specific ejecta species (oxygen, neon, sulphur) and to the dust that survived the explosion, and to test whether the beading is consistent with a clumpy progenitor or a clumpy medium. There is also a separate, very recent coda to the Pa 30 story: a separate team announced in early October 2026 that the central star, IRAS 00500+6713, has a measurable green tint in its visible-light spectrum, the first white dwarf to show one, painting it with the same mechanism that gives oxygen-rich Wolf-Rayet stars their colour (NASA APOD 2026 October 7). The 1181 supernova is the only historical Milky Way Type Ia-class event whose remnant we can resolve and the only Type Iax remnant at all, and with knots now measurable one by one, a quiet central star that did not fly away, and a Hubble and JWST follow-up in flight, it is the closest thing the field has to a benchmark for what a failed-but-not-quite thermonuclear supernova looks like 850 years after it happened.


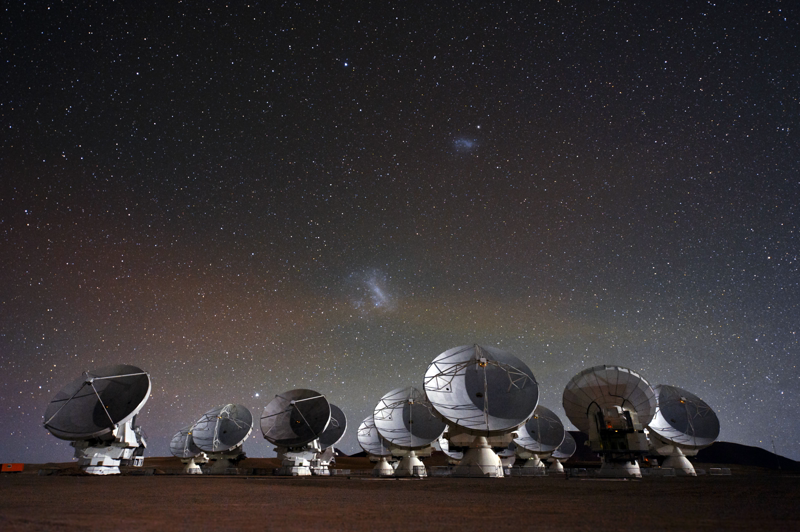
ALMA antennas on the Chajnantor plateau under the Magellanic Clouds


SETI has spent decades listening for narrowband radio signals, mostly below a few gigahertz. Most of that listening has been concentrated in a small slice of the radio dial. A new analysis from the University of Manchester points at a different slice and asks what has been there the whole time.

Louisa Mason, a PhD researcher at Manchester, used four archived observations from the Atacama Large Millimeter/submillimeter Array (ALMA) in Chile to run the telescope’s first SETI survey. The work, published in the Monthly Notices of the Royal Astronomical Society, focuses on ALMA’s Band 3 receivers and two narrow frequency windows near 90.642 GHz and 93.151 GHz. Those frequencies sit well above the traditional SETI bands and have barely been searched for narrowband technosignatures.

No candidate signals exceeded the survey’s detection thresholds. That is the expected result for a first pass, and the researchers describe the result as an opening of parameter space rather than a discovery.

SETI is shaped as much by instrumentation as by theory. Most narrowband technosignature work has relied on telescopes such as the Green Bank Telescope, the Parkes Murriyang telescope, and the Allen Telescope Array. Those instruments are excellent in their ranges but were not built for the millimeter and submillimeter bands. ALMA is sensitive above 35 GHz in a way few other facilities can match, and it has been producing archived data since 2011.

The implication is straightforward. A signal at 90 GHz could be present in ALMA data right now without anyone having looked. The new analysis is the first structured attempt to check.

There is a secondary finding, also presented at the Royal Astronomical Society’s National Astronomy Meeting in 2026. The same team used Gaia stellar catalogues to revisit the number of stars that earlier SETI surveys actually covered. ScienceDaily’s summary notes that the Manchester group found prior published counts may have understated the real coverage by more than an order of magnitude, with one estimate moving from roughly 288,000 stars to over 6 million once Gaia cross-matching was done properly.

The headline numbers are different from the search itself, but they are linked. Both findings argue that SETI has been sampling the sky less carefully than the literature suggests.

Mason did not request new ALMA time. The survey pulled four archived calibrator scans from the ALMA archive. Calibration observations are short, pointed at bright reference sources, and usually discarded after the data are reduced. Mason treated each scan as a science observation in its own right, looked at the stars that happened to fall in each antenna’s field of view, and searched for narrowband signals inside two narrow windows in Band 3.

The search covered 28 stars in total. They are a mix of main-sequence stars and white dwarfs, drawn from Gaia cross-matches. For each star, the analysis looked for narrowband emissions that would not be consistent with known natural processes in the band. Carbon monoxide, hydrogen cyanide, and diazenylium all produce molecular lines in this frequency range, so a SETI search needs to avoid flagging those as candidates.

The paper’s conclusion is that no candidate technosignatures passed the threshold. The survey’s sensitivity, the bandwidth of the search windows, and the relatively small star sample all limit how much can be inferred from a null result. The University of Manchester’s research record makes the same point in a more compact form.

Universe Today’s coverage walks through Mason’s quote that the millimeter and submillimeter bands “remain almost completely unexplored for SETI,” which is why the team framed the work as opening parameter space rather than confirming or refuting a particular hypothesis.

The Manchester team also pulled out a comparison with existing facilities. The figure in the MNRAS paper shows the frequency coverage each instrument could probe for narrowband SETI work. ALMA’s coverage sits in a region where other radio observatories are not conducting technosignature searches. That is both a justification for the work and an invitation to others to design complementary searches.

SETI looks for narrowband radio signals. The reasoning has not changed much since the early 1970s. Natural astrophysical sources tend to emit across broad frequency ranges, often with characteristic molecular or thermal signatures. A transmitter that uses a stable oscillator and a high-gain antenna concentrates its power into a narrow slice of spectrum. The narrower the signal, the harder it is to explain without technology.

A typical SETI pipeline breaks the recorded spectrum into fine channels, looks for narrow features, and checks that the candidate signal is consistent with the receiver’s beam shape and the motion of the telescope and the target. Drift rates, polarization, and the on-off pattern that comes from tracking a star are all used to separate terrestrial interference from real signals.

ALMA complicates this picture. ALMA is an interferometer, meaning it combines signals from many individual antennas. Each antenna has a defined field of view, and the dishes can resolve sources on the sky. At 90 GHz, that field of view is small. The good news is that any signal coming from a real source on the sky will appear in the antennas that were pointed at it, with a pattern that reflects the interferometer’s geometry. The bad news is that the same geometry creates challenges for confirming a narrowband signal across multiple baselines.

The Mason paper is explicit about these complications. Drift rates at high frequencies are larger because a transmitter of fixed velocity produces a larger Doppler shift per unit time when the carrier frequency is higher. The interferometer’s “undistorted field of view” sets a hard limit on how far off-axis a source can be and still be observed cleanly. The paper treats these as engineering constraints to design around rather than showstoppers.

The four archived scans used in the analysis were calibrator observations pointed at bright sources, not deep integrations. Each scan covers a few minutes of data. A real SETI survey would want longer integrations and a wider range of calibrator fields, but the short data are enough to demonstrate the analysis pipeline and to put a first constraint on narrowband signals at 90 GHz from a small star sample.

The Gaia cross-match that drives the higher star count is a separate but related piece of work. Previous published counts tended to use a single pointing on the sky and the simple catalog of stars within that beam. Cross-matching against Gaia, which has astrometry and stellar parameters for nearly two billion sources, lets researchers classify the targets and identify white dwarfs separately. White dwarfs are interesting for SETI because they are compact, old, and bright at optical wavelengths, and they often have stable proper motions.

The combined message is methodological. SETI can be expanded by re-examining existing archives, and existing surveys can be more ambitious about how they characterize their coverage. ALMA’s archive, described by the National Radio Astronomy Observatory as containing public data from 66 high-precision antennas in Chile, is the obvious next place to look. The European Southern Observatory’s ALMA instrument page adds the same picture from the operator side: a fifty-antenna main array plus a compact array of 12-meter and 7-meter dishes, all working as a single interferometer.

SETI’s search volume has been bounded more by receiver design than by theory. The Manchester group made that bound visible by stepping outside the usual bands and re-examining published star counts. Neither move produced a signal, but together they reset the baseline.

The next test is whether the technique scales. A follow-up that runs the same pipeline across the full ALMA calibrator archive, including longer integrations and additional Band 3 frequencies, would not require new telescope time. It would need a researcher willing to spend the weeks of compute and the careful bookkeeping the analysis demands.

Until that happens, the cleanest summary is also the most honest: SETI has more sky to listen to than it has listened to, and the millimeter bands are still open.


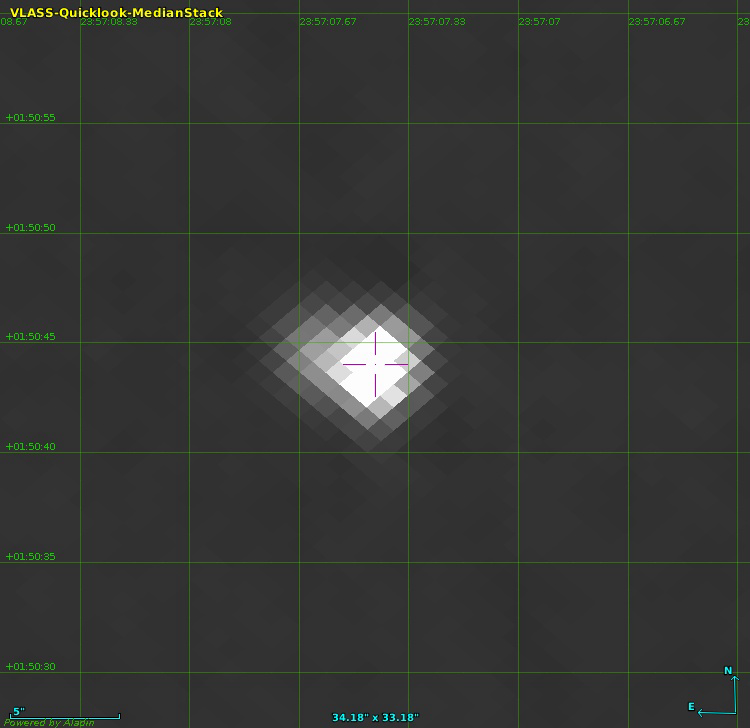
VLASS 3 GHz radio image of TXS 2354+015, with a magenta cross marking the precise optical position of the host galaxy at right ascension 23:57:07 and declination plus 01:50:45; the field of view is roughly 34 by 33 arcseconds and the bright central source is the target's compact radio core. Image: Balmaverde et al. 2026, Figure 4 right panel, retrieved from the arXiv HTML build at arxiv.org/html/2609.28632v1/VLASS.jpg.


On 18 September 2025, the European Southern Observatory’s Very Large Telescope turned its FORS2 spectrograph toward a point of sky in Pisces that no telescope had ever measured at high resolution. The target, catalogued as TXS 2354+015, had been flagged two years earlier as a candidate high-redshift radio galaxy because the optical light from its host galaxy dropped sharply between the green and red filter bands of the Subaru telescope’s Hyper Suprime-Cam. The September observations, reported by Barbara Balmaverde of the INAF Astrophysical Observatory of Turin and four colleagues in a paper uploaded to the arXiv preprint server on 23 September 2026, produced a single bright asymmetric emission line at 7220 Angstroms with an equivalent width of 900 Angstroms and a flux of just under one ten-thousandth of a billionth of an erg per square centimeter per second. That signature, confirmed by a second emission line at the wavelength expected for NV at the same redshift, fixed the source’s redshift at 4.946, a value that places the galaxy as it looked when the universe was 1.1 billion years old and the cosmic microwave background was still warm.

The result makes TXS 2354+015 the most powerful radio galaxy currently known. The team measured its intrinsic radio luminosity at a rest-frame frequency of 500 megahertz, a value long used as the standard reference for comparing radio galaxies because the emission is uncontaminated by synchrotron self-absorption at the source’s redshift. They found 6.2 times ten to the twenty-ninth watts per hertz, almost twice the previous record, held since 2008 by TN J0924-2201 at 3.22 times ten to the twenty-ninth. The new source edges past a threshold that had stood for nearly two decades, and the gain comes not from a marginal improvement but from a clean factor of two.

High-redshift radio galaxies matter because they are the most extreme manifestations of accretion onto a supermassive black hole that the early universe produces, and because the energy the jets pump into the surrounding gas regulates star formation in the host galaxy and balances the cooling of the intracluster medium in its neighbourhood. Numerical simulations of how massive galaxies grow require this feedback to match the observed galaxy luminosity function, so finding the brightest examples at the highest redshifts is a way to test how aggressive that feedback could have been at the time galaxies were assembling their first bulges. The candidate selection is also where the new paper departs from tradition: earlier searches for radio galaxies beyond redshift three relied on the ultra-steep-spectrum technique, which is biased toward one subpopulation, and the team argues that selecting candidates by their optical dropout in the red filter of the Hyper Suprime-Cam Subaru Strategic Program, the Lyman-break method, catches high-redshift radio galaxies whose flat radio spectra would slip past the steepness cut. TXS 2354+015 itself has a radio spectral slope of 0.94, well short of the steepness criterion of 1.3 that traditional searches enforce, and the authors present it as the prototype of an entire missed population.

The follow-up spectroscopy was conducted at the VLT under programme 116.28LA.001 on 18 September 2025, and the radio data were assembled from two large surveys rather than a single observation. The team used the FORS2 spectrograph with the GRIS600RI grism and GG435 blocking filter, a setup that delivers wavelength coverage from 5120 to 8450 Angstroms at a resolution of about 300 kilometres per second; they placed the slit so that it included both the target and a brighter pivot star four arcseconds to the northwest, then took two 1218-second exposures. The extracted spectrum showed a continuum below the detection threshold on the red side of the line and a sharply asymmetric emission line whose blue edge drops within a single resolution element, the canonical signature of the Lyman-alpha line from a galaxy whose neutral hydrogen is being eaten away by the intergalactic medium at that epoch, and a second emission feature at the wavelength expected for doubly ionised nitrogen at the same redshift sealed the identification. The 150 megahertz TIFR GMRT Sky Survey, produced with India’s Giant Metrewave Radio Telescope, gave the low-frequency anchor at 25 arcsecond resolution and 17.5 millijansky sensitivity, while the Karl G. Jansky Very Large Array Sky Survey gave the high-frequency anchor at 3 gigahertz, 2.5 arcsecond resolution, and 70 microjansky noise. The team cross-matched the two catalogs, looked for HSC-SSP optical counterparts within 1.5 arcseconds of the VLA positions, and selected candidates with the Lyman-break dropout signature in the red filter. The candidate that survived was TXS 2354+015, with a radio flux density bright enough to ensure a robust identification and a clean offset of just 0.2 arcseconds between the VLA and optical positions. The 3 GHz image itself, retrieved from the HTML build of the paper, shows a single compact source on a flat background, the canonical appearance of an unresolved high-redshift radio core.

The combined picture is more striking than any single measurement. The host galaxy, as seen by Subaru in the i-band, has a half-light diameter of about 5 kiloparsecs, several times larger than the typical 1.5 kiloparsec radius of a z equals five galaxy in deep-field samples, and the Lyman-alpha emission line is spatially extended over a full width at half maximum of roughly 6 kiloparsecs, consistent with the giant Lyman-alpha nebulae that are known to surround powerful high-redshift radio galaxies and that are aligned with the radio jet axis. The radio position angle, measured from a marginal Gaussian fit to the VLASS image, is 71 degrees, while the slit was oriented at minus 30 degrees, almost perpendicular to the jet, so the team’s measurement likely underestimates the true extent of the nebula. The stellar mass the team infers from the host’s mid-infrared luminosity carries an unusually long list of caveats: the WISE W1 band at 3.4 micrometres captures several emission lines at this redshift, with the brightest being the doubly ionised oxygen line at 5007 Angstroms rest frame, and extrapolating the well-known correlation between radio power and that line’s luminosity from low-redshift samples suggests a host stellar mass near 2 times ten to the twelfth solar masses, a value that would place the galaxy at the very top of the local luminosity function, but a younger stellar population would reduce the estimate by a factor of ten and better spectral energy distribution coverage is required before the number can be trusted.

The discovery will not stay unique for long. The combination of the Lyman-break dropout selection with the cross-matched radio catalogs is now a template that can be reapplied to the rest of the HSC-SSP wide field, a 1400-square-degree footprint that the team estimates contains hundreds of similar candidates. Each one will need VLT or Keck spectroscopy to confirm its redshift, but the path from candidate to confirmed high-redshift radio galaxy is now routine rather than rare, and outside coverage has already framed TXS 2354+015 as the prototype of a population that the older ultra-steep-spectrum searches missed. The implication is that the radio-loud active galactic nuclei population at z greater than four is larger, flatter-spectrum, and more energetic than the existing sample suggested, and that the brightest examples may have been hiding in plain sight in the same wide-area optical surveys that astronomers have been using to find high-redshift galaxies for the past decade. Whether TXS 2354+015 is itself unique or merely the first of a new class is the question the next round of spectroscopy will answer.


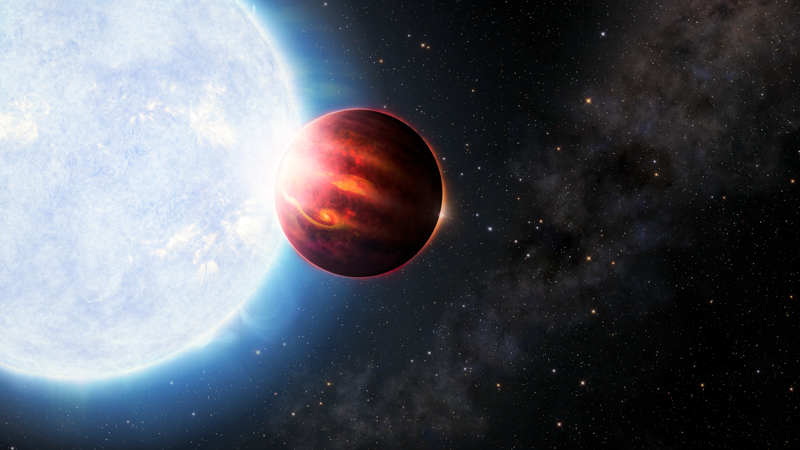
WASP-189b echoes the chemistry of its host star. Image: 2026 10 16 wasp 189b magnesium silicon.


Almost 320 light-years away, in the direction of the constellation Libra, a giant planet swings around its star in just under three days, glowing red and orange because the side that faces the star is hot enough to vaporize rock. WASP-189b is the textbook example of a class that astronomers call ultra-hot Jupiters, planets that look like Jupiter in size and bulk composition but orbit so close to their stars that their dayside temperatures climb above 2,500 kelvin, well past the vaporization point of minerals such as magnesium, silicon, and iron. New observations of WASP-189b with the Immersion Grating Infrared Spectrograph (IGRINS), mounted on the Gemini South telescope in Chile, have produced the first simultaneous measurement of gaseous magnesium and silicon in any exoplanet atmosphere, and the ratio between the two elements in the planet turns out to match the ratio in its host star. The result, published by Jorge Antonio Sanchez of Arizona State University and an international team in Nature Communications on 18 February 2026 and highlighted in a NOIRLab press release on 13 October 2026, is the first direct evidence for a long-standing assumption that astronomers have used since exoplanet science began (Sanchez et al. 2026, Nature Communications; NOIRLab press release noirlab2609).

The assumption in question is simple to state and powerful in practice. Planets form from the same protoplanetary disk of gas and dust as their host star, and the chemistry of that disk is set by the chemistry of the parent molecular cloud. The expectation, therefore, is that the relative proportions of the major rock-forming elements in a planet should match the relative proportions of those same elements in the star. In the Solar System this expectation has been borne out within a factor of about two for the rocky planets, and the small departures from a perfect match are useful constraints on the violent early history of the inner Solar System. For every other planetary system astronomers can detect, the question had to be inferred. Stellar spectra are easy to come by, because stars are bright, but exoplanet spectra are not, because exoplanets are faint, sit right next to a much brighter source of light, and are usually moving quickly through the background. Until the new WASP-189b measurement, no team had ever detected two rocky-element species in a single exoplanet at the same time, so the assumption that exoplanet chemistry tracks stellar chemistry was reasonable but unverified (SciTechDaily; ScienceDaily).

Why the magnesium-to-silicon ratio, in particular? The two elements sit at the heart of rock-forming mineralogy. Magnesium and silicon together build the silicates that make up most of Earth’s mantle, the olivine and pyroxene minerals that dominate the rocky bodies of the inner Solar System, and the iron-magnesium-silicate matrix that is the default material from which any rocky planet is expected to condense. The Mg/Si ratio of a planet, more than its absolute abundance of either element, sets the dominant mineral phases it can carry, which in turn control how easy it is for a planet to retain plate tectonics, generate a magnetic dynamo, and outgas volatiles that contribute to oceans and atmosphere. The same ratio in a star, measurable from high-resolution stellar spectra, has therefore been used for two decades as a proxy for the mineralogy of any rocky planets in that system, even ones whose spectra are beyond current reach. The WASP-189b result is the first observational check on that proxy, and it passes (NOIRLab Nuggets: Decoding Planet Origins with Gemini).

WASP-189b is a useful target for this measurement for a reason that has nothing to do with its bulk composition and everything to do with its orbit. The host star, catalogued as HD 133112, is a hot blue-white A-type star about 2.7 times the mass of the Sun. The planet is tidally locked, with the same hemisphere permanently facing the star, and its 2.7-day orbit takes it through a particularly favorable alignment called secondary eclipse, when the planet passes behind the star as seen from Earth. During secondary eclipse the planet’s own emission drops out of the combined spectrum and the star’s emission drops in, and a careful subtraction of one from the other yields the planet’s dayside spectrum in isolation. The IGRINS spectrograph, built by a consortium led by the University of Texas at Austin, Korea Astronomy and Space Science Institute, and the Korea Institute of Science and Technology, was a visiting instrument on Gemini South from 2022 to 2023 and was chosen because its near-infrared coverage and spectral resolving power are high enough to separate the planet’s individual atomic and molecular lines from the much brighter signal of the host star. The team collected a series of transit and eclipse observations of WASP-189b with IGRINS at Gemini South, then used high-resolution cross-correlation techniques to extract the magnesium and silicon lines from the planet’s contribution. The matched Mg/Si ratio was the central result (Sanchez et al. 2026, Nature Communications).

The instrumentation choice was a constraint as much as a convenience. Ground-based telescopes can deliver the spectral resolution that this kind of work requires only in narrow wavelength windows where Earth’s atmosphere happens to be transparent, and the near-infrared windows around 1.5 and 2.3 micrometers are the most productive because they sit in absorption bands of gaseous magnesium and silicon at the temperatures found in ultra-hot Jupiter atmospheres. The IGRINS spectrograph covers both windows simultaneously, which is what made the simultaneous detection possible. A more common approach in the field is to use a space telescope such as Hubble or JWST, but the trade-off is that those instruments do not have the same spectral resolving power and cannot easily separate the planet’s line from the star’s line for atomic species at high temperature. The success of the IGRINS run on Gemini South, and the fact that the instrument’s successor IGRINS-2 has now been commissioned as a facility-class instrument on Gemini North in Hawaiʻi, is a sign that high-resolution ground-based spectroscopy is on its way to becoming a standard tool for this kind of measurement, with more targets and more elements in the coming years.

A practical consequence of the result is that the long list of rocky exoplanet host stars whose Mg/Si ratios have already been measured, mostly by ground-based stellar surveys, can now be used with more confidence to predict the mineralogy of any rocky worlds in those systems. The assumption is no longer just a reasonable extrapolation from Solar System chemistry. It is a tested prediction, validated for one of the hottest and most alien gas giants in the catalogues, and almost certainly applicable, to a close approximation, to cooler and more temperate planets that no instrument yet exists to measure directly. For astrobiologists in particular the result closes a methodological gap: the standard practice of using a star’s elemental makeup to estimate the geochemistry of its planets, and through that the suitability of those planets for plate tectonics, magnetic fields, and long-term habitability, is now backed by direct observation rather than by an unverified assumption.

The IGRINS-2 commissioning on Gemini North, and the parallel development of other high-resolution spectrographs for the upcoming extremely large telescopes, suggest that the WASP-189b measurement is the first of a series rather than a one-off. The next steps are likely to involve measuring additional ultra-hot Jupiters with comparable precision, extending the technique to cooler gas giants and Neptune-class planets where the chemistry is more complex, and eventually applying the same kind of cross-correlation analysis to rocky planets around small stars, where the same Mg/Si assumption will need to be tested under different conditions. None of that happens quickly, and the WASP-189b result will remain the cleanest single demonstration of the principle for some time, but the door it opens is the same one that exoplanet science has been pushing on for the past two decades: turning stellar spectra, which are easy to obtain, into statements about planetary interiors, which are not.