OrbitalHub

Where curiosity reaches escape velocity.

Domain is for sale. $50,000,000.00 USD. Direct any inquiries to contact@orbitalhub.com.


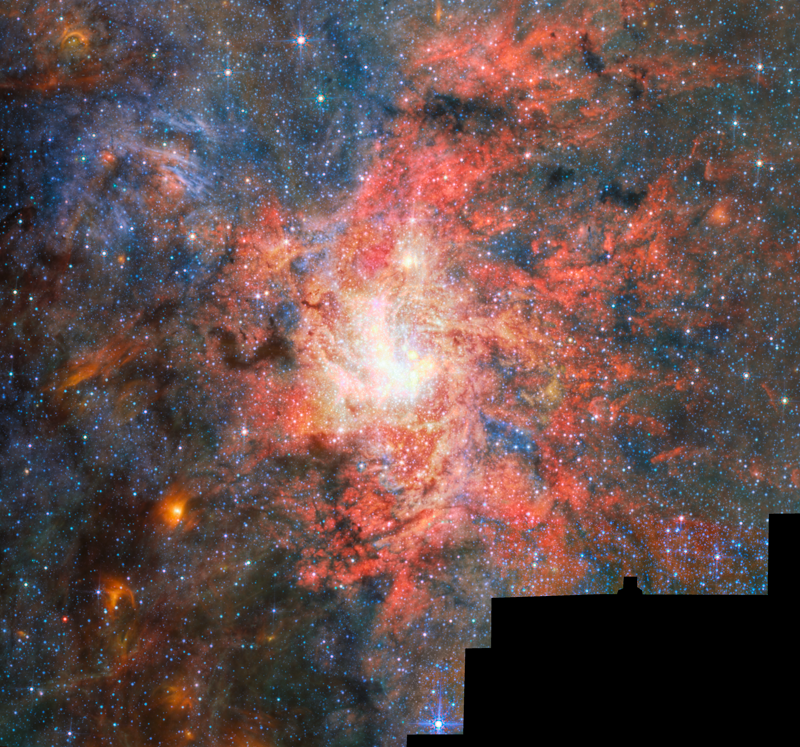
Mid-infrared view of the IRS 3 field taken with Webb's MIRI. The bright central object is IRS 3 itself, with its extended silicate-and-water envelope visible as the diffuse glow around it, set against the dense stellar background of the Milky Way's central parsec.


A star only 0.55 light-years from Sagittarius A* is still making water.

Astronomers working on the Mid-Infrared Characterisation of Nearby Iconic galaxy Centres programme (MICONIC) used Webb’s Mid-Infrared Instrument (MIRI) to take the first continuous mid-infrared spectrum of IRS 3, an oxygen-rich asymptotic giant branch star that sits inside the most punishing radiation environment in the Milky Way. The spectra carry clear silicate dust features and, for the first time in this object, a water signature inside the star’s outflowing envelope. The result, published on 11 August 2026 in Astronomy and Astrophysics, shifts a long-standing assumption about galactic centres: stars there can keep producing the kind of molecular and dusty material that future planetary systems are built from, even when they are essentially inside the black hole’s sphere of influence.

Why this matters comes down to where the chemistry of galaxies gets done. A normal disk galaxy gets most of its interstellar dust and much of its recycled gas from evolved, mass-losing stars like IRS 3. These stars puff off their outer layers as they age, and the ejecta cool into grains that seed the next generation of star and planet formation. Galactic centres are different in kind, not just degree. The supermassive black hole at the centre of every large galaxy pumps out enough ultraviolet and X-ray radiation to break water apart in seconds in unprotected gas, and its gravity roars past anything orbiting closer than a few parsecs. If stars near galactic centres cannot produce dust and molecules, the inner few hundred light-years of a galaxy should be remarkably dust-poor, with a different chemistry than the disk. That in turn changes how astronomers read the spectra of distant galactic cores taken by mid-infrared space observatories, since the same chemistry that runs in our own galactic centre runs in every other large galaxy’s centre. The MICONIC programme was created to test exactly that question, and IRS 3 is its flagship target.

The Webb observation tells the IRS 3 story in detail. Lead author Florian Peissker of the University of Cologne and his team, including Macarena Garcia Marin of ESA (the MICONIC principal investigator), pointed MIRI at IRS 3 during the 2025 Guaranteed Time Observations campaign (programme ID 1266) and collected a continuous spectrum across the mid-infrared. The MIRI medium-resolution spectroscopy mode spans wavelengths where cold dust and molecular gas both radiate, so a single exposure covers the silicate bands, the water rotational-vibrational lines, and the broader dust continuum that anchors the dust mass estimate. Two strong silicate features in the data reclassify the star: earlier studies had flagged it as a candidate carbon-rich AGB star, but the new spectrum is unambiguously oxygen-rich, with the silicon-oxygen grain signature that is the standard fingerprint for a dusty red giant shedding mass in an oxygen-dominated envelope. Layered on top of the silicate features is a water signature inside the envelope, which is the first clear molecular detection for this object and the headline result. The reclassification is important on its own terms: carbon-rich AGB chemistry would have implied a different set of grain types, and confirming that IRS 3 follows the oxygen-rich path is the precondition for the water finding being meaningful.

The numbers behind that headline make it sharper. IRS 3 lies about 0.55 light-years from Sgr A*, roughly 3,300 astronomical units, which puts it well inside the sphere where the black hole’s tidal forces are a factor in the star’s mass-loss budget. The dust envelope itself extends some 10,000 AU from the photosphere, with temperatures falling from roughly 1,200 Kelvin close to the star to around 100 Kelvin in the outer regions; the spectrum is consistent with a shell-like, layered distribution rather than a smooth outflow, which is useful because layered shells are exactly the structures models expect when an AGB star loses mass in pulses. Stellar modelling puts IRS 3 at about six solar masses and roughly 72 million years old, near the end of its AGB phase. Both the geometry of the envelope and the chemistry of its grains point to a star that is still very much in the business of enriching its surroundings, as the ESA/Webb release weic2617 lays out.

The deep dive into why the water survives is where the physics gets interesting. Water in space is fragile because ultraviolet photons break the molecule into hydrogen and oxygen on timescales of days in an unprotected environment, and the same harsh UV field also drives chemistry off the silicate grain surfaces that protect newly formed water in cooler clouds. Around Sgr A*, that radiation field is unusually intense because hot stars in the central parsec and the black hole’s own outflows pile ultraviolet photons on top of one another. The MICONIC result shows two things at once: the silicate dust itself has survived, which it would not have done if the radiation had sputtered the grains apart, and water has formed and persisted inside that dust. The standard interpretation is that the water molecules are locked onto grain surfaces in the cooler outer regions of the envelope, the same way water ice is locked onto silicate grains in dense molecular clouds in the solar neighbourhood. The fact that those ices survive this close to a supermassive black hole is the result that makes the paper more than a detection.

The takeaway for galactic evolution is the part that will move through the field. If IRS 3 is doing this, other AGB stars in the same neighbourhood almost certainly are, and the central parsec of the Milky Way likely contains a steady drizzle of newly formed silicate and icy grain material rather than the chemically barren zone some models had assumed. That material feeds the mini-spiral of gas and dust that orbits Sgr A*, the reservoir that has been indirectly imaged by the Event Horizon Telescope in 2022 and by GRAVITY at the Very Large Telescope in subsequent years. Over millions of years, even a small per-star dust contribution adds up, and the chemistry of the inner galaxy starts to look more like the chemistry of the disk than the chemistry of a void. The MICONIC programme is extending the same MIRI observations to other evolved stars in the inner parsec; the answer to how many more IRS 3s are out there is the next observational push, and the TechTimes coverage traces the working assumption that the survey will turn up several similar cases.

What we have learned is that proximity to a supermassive black hole is not, by itself, a death sentence for water or for silicate dust in evolved-star envelopes, and the next step is observing the same kind of spectroscopy on the next dozen AGB candidates inside the central parsec to see whether IRS 3 is representative or unusually resilient. The next MICONIC data release, plus parallel JWST spectroscopy of the dusty objects orbiting within a few arcseconds of Sgr A*, will pin that down.
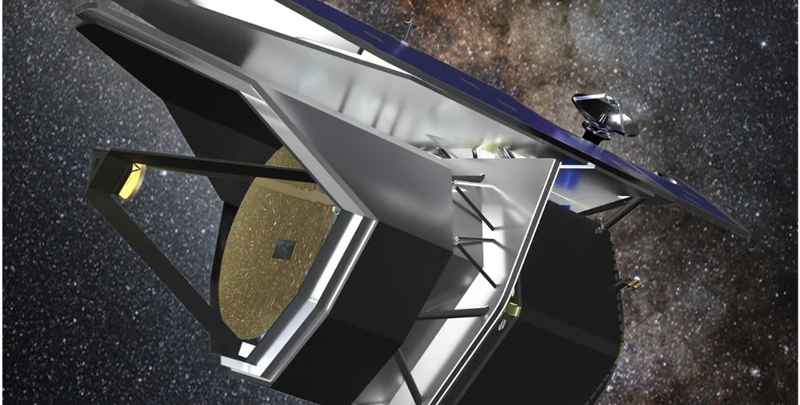


NASA/JPL-Caltech concept rendering of the PRIMA observatory, showing the gold-coated 1.8-meter primary mirror, dark sunshields, and the supporting truss against a starfield.


NASA announced on Wednesday, September 23, 2026 that its next great space observatory will be PRIMA, the PRobe far-Infrared Mission for Astrophysics, and that the $1.2 billion project has been advanced into Phase B development on a path toward a 2033 launch (NASA news release). PRIMA is the first in a new mission line NASA is calling Probe Explorers, a billion-dollar class that sits between the agency’s smaller Explorer-class satellites (such as SPHEREx and NICER) and its flagship observatories like the newly launched Nancy Grace Roman Space Telescope (SpaceNews). The observatory’s job is to do something neither Roman nor the James Webb Space Telescope was designed to do well: stare through the cold, dusty universe at wavelengths from 24 to 235 micrometers, the far-infrared window where most of the radiant energy from planet birth, black hole accretion, and interstellar dust actually emerges (Caltech announcement).

The reason far-infrared astronomy needs its own flagship is straightforward and a little humbling. Roughly half the energy released since the Big Bang has been absorbed by interstellar dust and re-radiated in the far-infrared, a band that is essentially opaque from the ground and that earlier infrared telescopes have only been able to nibble at. ESA’s Herschel Space Observatory, the last major far-infrared mission, ended in 2013. NASA’s Spitzer, the predecessor JPL ran for Caltech, ran from 2003 to 2020. SPHEREx, launched in March 2025, maps the whole sky in near-infrared colors but is not optimized for the deep, narrow surveys a 1.8-meter cryogenic far-infrared telescope can deliver (IPAC project page). JWST, for its part, runs from 0.6 to 28 micrometers and is fundamentally a near-and-mid-infrared observatory, leaving the long-wavelength half of the infrared spectrum to PRIMA (Live Science). The Astro 2020 Decadal Survey, led by Caltech physicist Fiona Harrison, asked NASA to fill that gap, and the question of how Earth’s water arrived is one of the targets the survey explicitly named as ripe for a far-infrared answer (NASA news release).

PRIMA is being designed to be, in Caltech President Ray Jayawardhana’s words, “orders of magnitude more sensitive than previous far-infrared space missions” (Caltech announcement). The trick is the same one Herschel and Spitzer used, but pushed harder: a 1.8-meter primary mirror and a detector array cooled to about 4.5 kelvin, so that thermal noise from the telescope itself stops drowning out the faint signals from distant galaxies and cold dust. At the back of the optics sit two science instruments. FIRESS, the Far-Infrared Enhanced Survey Spectrometer, is a four-band grating spectrometer covering the full 24 to 235 micrometer range, with a Fourier Transform Module that can be inserted to push spectral resolution as high as 20,000 (PRIMA instrument page). PRIMAger, the imager, splits into two sub-instruments: the Hyperspectral Imager (PHI), which scans 24 to 84 micrometers at a spectral resolution of about 8, and the Polarimetric Imager (PPI), which uses four filters from 92 to 235 micrometers to measure the I, Q, and U Stokes parameters of incoming light, the first dedicated far-infrared polarimeter ever flown on a NASA mission. Both instruments read out through superconducting kinetic inductance detectors (KIDs), a technology Jonas Zmuidzinas at Caltech and Rick LeDuc at JPL first sketched out in 1999 over coffee near campus and that has spent the intervening decades maturing in ground-based and balloon-borne instruments (Caltech announcement).

What those instruments let PRIMA actually do falls into three themes the 2020 Decadal Survey highlighted. First, the chemistry of planet formation. Far-infrared spectroscopy captures the cold molecular fingerprints (HD rotational lines, water vapor bands, OH, neutral carbon, nitrogen, oxygen, neon) that trace the disk midplanes where gas giants and ice giants are still accreting, the wavelengths JWST’s mid-infrared instruments struggle to reach from inside dust cocoons (NTRS PRIMA concept paper). Second, the co-evolution of galaxies and their central supermassive black holes. Far-infrared dust continuum tracks the obscured side of accretion that X-ray and optical surveys miss, and the new PRIMA Hyperspectral Imager is built to map dust temperature and star-formation rate across cosmic time in single pointed observations. Third, the build-up of dust and heavy elements from the first galaxies to today, the link between stellar nucleosynthesis and the cold universe that JWST and ALMA have been hinting at but cannot survey with the same speed (NASA news release). Twenty-five percent of the five-year prime mission goes to the PI-led science program; the remaining seventy-five percent is open to the broader community through a General Observer call, modeled on the same time-allocation structure Hubble and JWST use today (IPAC project page). The engineering challenges are also unusual for a Probe-class mission: holding a 1.8-meter telescope and two large instruments near 4.5 K for five years, in a Sun-Earth L2 halo orbit similar to Roman’s and JWST’s, requires a multi-stage mechanical cooler chain with no flight-qualified NASA heritage at that scale. The mission also leans on international partners more heavily than most Probe-class concepts typically do: CNES (France) is co-leading PRIMAger with the Laboratoire d’Astrophysique de Marseille and CEA, SRON (Netherlands) is co-developing both instruments, the Max-Planck Institute in Heidelberg built the beam-steering mirrors, and the Canadian Space Agency, DLR, ASI, KASI and KASA, JAXA, and the UK Space Agency all contributed to the Phase A studies (NASA news release). NASA has not yet chosen a launch vehicle, and the $1.2 billion cost cap explicitly excludes launch and other non-project costs, which is why the total mission price tag will be higher than the headline number.

PRIMA’s two-year Phase B is now the gating step. The team has to lock the optical design, demonstrate the cryocooler chain to NASA review board standards, and pass the confirmation review that lets the project enter Phase C implementation, with the same kind of cost-and-schedule scrutiny that pushed the Roman mission through development (SpaceNews). If everything lines up, a 2033 launch puts PRIMA into operation in the mid-2030s, after Roman’s prime five-year survey ends and as JWST enters its second decade of fuel-limited life. The selection also marks the formal opening of the Probe Explorer line, with the next call for proposals expected within the next two NASA budget cycles (NASA news release). In the words of Astrophysics Division director Shawn Domagal-Goldman, the goal is “a pipeline that will consistently have missions of this caliber ready to go,” one Probe Explorer per decade, each opening a wavelength band the current fleet cannot reach. The choice to start that pipeline with the far-infrared is not accidental. Roughly half the photons the universe has ever produced live in that band, and PRIMA is the first NASA mission in more than a decade built specifically to count them.


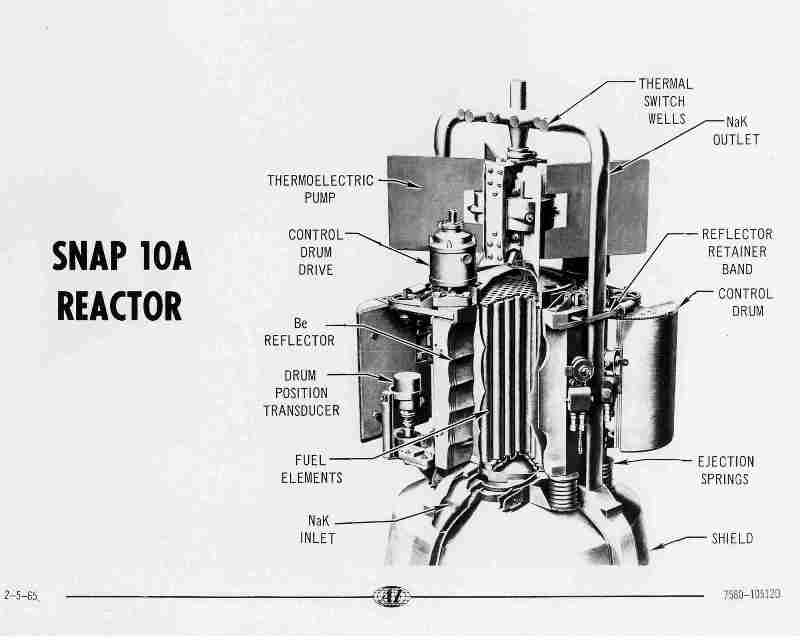
Labeled cutaway diagram of the SNAP-10A reactor, showing the Be reflector, fuel elements, control drum drive, thermoelectric pump, NaK inlet and outlet, and ejection springs, dated 2-5-65


Antares Nuclear, a three-year-old startup in Torrance, California, walked away from a September 14, 2026 award ceremony with what it calls the largest U.S. Department of War contract ever signed specifically for nuclear power in space: $161 million to design, ground-test, and eventually fly a fission reactor on a spacecraft. The Office of the Assistant Secretary of the Air Force for Space Acquisition and Integration structured the Strategic Breakthrough award around two related efforts, a ground demonstration of a reactor called R1-S followed by integration work on an electricity-producing variant called Mark-1 that Antares plans to begin testing in 2027. The company has not yet named a target launch date for R1-S or which mission it would eventually support, but the contract is the clearest signal yet that the U.S. government intends to put a fission reactor in orbit in this decade rather than the next (Defence Blog, September 14, 2026).

The strategic logic is straightforward, and it has very little to do with sending astronauts to Mars. Most satellites today run on solar panels paired with batteries sized for eclipse periods, which sets a hard ceiling on how much power is available onboard and how aggressively a spacecraft can maneuver without draining its reserves. A compact fission reactor gives a satellite continuous high-output power instead of the day-night cycle that solar arrays impose, supporting heavier onboard computers, sustained orbital maneuvers, and payloads such as directed-energy systems or electronic-warfare gear that today’s power budget cannot accommodate at all. Jordan Bramble, Antares’ chief executive and co-founder, framed the award the same way his investors do: “Fission will unlock strategic capabilities that are impossible today.” The Department of War’s appetite for those capabilities is not new, but the budget to actually build toward them has historically been small, scattered across NASA and Defense programs, and constrained by a decades-long absence of any American nuclear reactor actually running in space (Defence Blog, September 14, 2026).

The Antares award is the latest milestone in a sequence that began quietly six years before the contract was signed. On June 4, 2026, the company’s Mark-0 demonstrator reactor completed what is technically known as a zero-power fueled criticality at Idaho National Laboratory’s Reactor and Critical Experiment (RACE) facility, the moment at which a nuclear fission chain reaction becomes self-sustaining. The test, conducted under Department of Energy authorization and with nuclear fuel maker BWX Technologies fabricating the fuel, made Antares the first private company to bring an advanced reactor to criticality under the DOE’s Reactor Pilot Program. It was also the first novel reactor design to achieve criticality at the Idaho site in more than fifty years, according to INL Laboratory Director John Wagner, who emphasized that the Mark-0 test produced essentially no measurable thermal output: proof that the physics worked, not proof that the system could yet generate electricity (Power Magazine, June 2026; U.S. Department of Energy, June 4, 2026).

That single June milestone unlocked everything that followed. Data from the Mark-0 test is being shared with the Department of War’s Project Pele, a long-running program to build a transportable microreactor for forward military bases, and Antares is also a supplier under the U.S. Army’s separate Janus Program, which is installing microreactors at installations including Fort Benning, Georgia. The Space Force award is the third major customer the company has signed, after the Army and the Air Force itself, and Antares says it now holds agreements with NASA and the Defense Innovation Unit as well. Private capital has followed the same trajectory: the company closed a $96 million Series B round in December 2025, raising its total private funding above $600 million by mid-2026 (Defence Blog, September 14, 2026; Power Magazine, June 2026).

The policy backdrop is two documents rather than one. Executive Order 14369, signed in late 2025 and titled “Ensuring American Space Superiority,” directed the federal government to “deploy nuclear reactors on the Moon and in orbit, including a lunar surface reactor ready for launch by 2030” (Executive Order 14369, The American Presidency Project). The implementation memo, National Security and Technology Memorandum-3 (NSTM-3), issued on April 14, 2026, gave NASA and the Department of War thirty days to start parallel reactor competitions: a mid-power fission surface power (FSP) system targeted for the Moon by 2030, and a separate space-based reactor to support nuclear electric propulsion. The Antares award sits inside the second of those two tracks, where the schedule is even tighter: NSTM-3 calls for an American reactor in orbit as early as 2028 (SpaceNews, April 2026).

The hardware Antares is building toward looks much more like a 1965 satellite than a 2026 data center. The R1 microreactor, the commercial product the company’s ground-test reactors are iterating toward, uses tri-structural isotropic (TRISO) fuel, particles of high-assay low-enriched uranium (HALEU) coated in layers of carbon and ceramic, embedded in a prismatic graphite core. Passive sodium heat pipes carry heat from the core to a fin-and-tube primary heat exchanger, and a recuperated nitrogen-closed Brayton cycle converts that heat into electricity at outputs between 100 kilowatts and 1 megawatt depending on configuration. The R1 is rated to operate for six or more years between refueling and is designed to run without a connection to the commercial grid, exactly the operating envelope a spacecraft needs (Power Magazine, June 2026). The conceptual lineage runs straight back to SNAP-10A, the only fission reactor the United States has ever placed in orbit, which launched on April 3, 1965 aboard an Atlas-Agena D from Vandenberg and ran for forty-three days before a non-nuclear voltage regulator failed in its thermoelectric pump. The SNAP-10A core used a similar arrangement of uranium fuel elements, a beryllium reflector, sodium-potassium (NaK) coolant loops, and control drums rotated by an electric drive to manage reactivity (Wikipedia, SNAP-10A).

The diagram above, a 1965 U.S. Department of Energy drawing of the SNAP-10A core, illustrates the conceptual continuity. The beryllium reflector wraps the fuel elements and bounces neutrons back into the chain reaction; the control drums rotate to absorb neutrons and throttle reactor power; the NaK loops carry heat from the core to a thermoelectric pump that converts it directly into electricity without moving parts. Antares has replaced the thermoelectric pump with a closed Brayton cycle and swapped the SNAP-era fuel for HALEU TRISO, but the operating principle, a compact, passively cooled, six-year core with no moving coolant pumps, has not changed (Wikimedia Commons, File:SNAP-10A Reactor.jpg).

What has changed is the supply chain. The 1965 program drew on a single nuclear vendor (Atomics International, a division of North American Aviation) and a single satellite integrator; the 2026 program has at least three parallel microreactor vendors (Antares, plus the BWXT-led Project Pele team and at least one other Army Janus participant), HALEU production being stood up at multiple Department of Energy sites, and TRISO fuel fabrication running commercially at BWX Technologies since October 2025. If Antares meets its schedule, the United States will close a sixty-year gap between SNAP-10A and the next American fission reactor in orbit, and the Mark-1 testing campaign starting in 2027 will tell the industry whether the next one after that flies on a lunar lander or a Space Force satellite.


September 23, 2026

Saturn grew a decagon at its south pole

Posted by


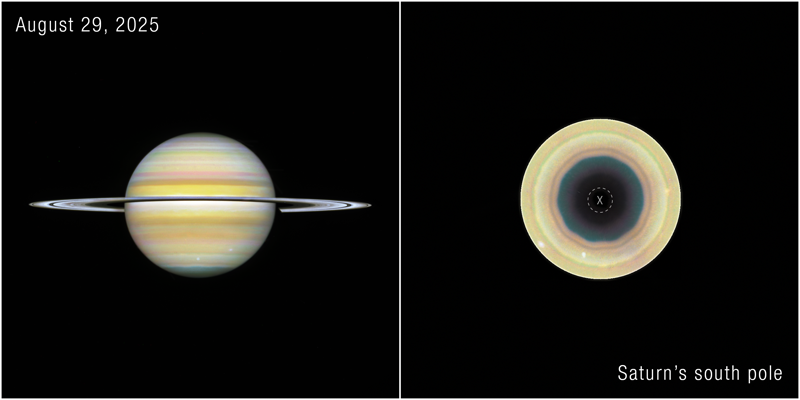
Side-by-side Hubble view of Saturn from August 29, 2025: a full-globe image at left showing the rings and banded atmosphere, and a south-polar projection at right with a dark 10-sided outline marking the decagon wave. Credit: NASA, ESA, STScI image released via NASA Science.


For forty-plus years, the hexagonal jet stream at Saturn’s north pole has been the canonical oddity in the outer solar system: a perfectly geometric, six-sided wave that has outlasted every spacecraft and every telescope pointed at it. As of early September 2026, Saturn has decided to compete with itself. The south pole, which never produced a long-lived polygonal feature in the four decades of Cassini and Voyager imaging, has now grown a 10-sided wave in one of its powerful jet streams. A team led by planetary scientist Agustín Sánchez-Lavega of the University of the Basque Country reports the find in a paper in Science Advances, with co-authors from NASA’s Goddard Space Flight Center and the University of California, Berkeley’s Space Sciences Laboratory (NASA Science). The data come from the Hubble Space Telescope’s Outer Planet Atmospheres Legacy (OPAL) program, and the wave is the first decagonal standing wave ever confirmed at Saturn’s southern hemisphere.

The decagon matters beyond the visual symmetry, because it changes how planetary scientists read Saturn’s atmosphere. Until this observation, the northern hexagon was treated as singular: an exceptional accident in a single jet stream. The southern decagon shows that polygonal standing waves are not unique to one latitude on Saturn. They can form in either hemisphere, in different jet streams, with different numbers of sides. That shifts the framing from “why does Saturn have one hexagon” to “why does Saturn’s jet stream physics tend toward polygonal standing waves when the conditions are right,” a framing that the OPAL team has already begun to push at scientific meetings (UC Berkeley SSL).

The path to the discovery started in 2024. Sánchez-Lavega runs the Planetary Virtual Observatory Laboratory (PVOL) at the University of the Basque Country, a site where amateur observers worldwide submit ground-based images of the planets. In 2024, two contributors, Trevor Barry and Jean-Paul Oger, sent in imagery that contained a subtle undulating band at Saturn’s southern pole. The wave looked similar to a transient perturbation NASA’s Cassini spacecraft had imaged briefly in 2004. Additional ground observations in 2025 strengthened the signal. Sánchez-Lavega then turned to the higher-resolution Hubble archive. He had been searching for a southern counterpart to the northern hexagon in Hubble images since 1990. The OPAL program’s annual Saturn portraits, taken since 2018, provided the resolution and the consistency to settle the question (Sci.News).

When the Hubble images from 2023 onward were projected onto a south-polar view, the decagon was clearly visible at roughly 63°S latitude, embedded inside the eastward-to-westward jet stream that flows along the 60.5°S parallel and winds at high speed around the pole. Cassini’s 13-year survey had found no long-lived polygonal feature there, only a fleeting wave that lasted a few days and was never seen again before Cassini’s deliberate plunge into Saturn’s atmosphere in September 2017. The decagon must have emerged between Cassini’s end and Hubble’s 2023 OPAL frame, a window of roughly five to six years. The Space Telescope Science Institute released the result alongside a press release dated 2 September 2026, and the NASA Astronomy Picture of the Day feature for 8 September 2026 carried the side-by-side globe-and-polar projection to a much wider audience than the team expected.

The structure is genuinely three-dimensional. The decagon shows up in OPAL images taken at multiple wavelengths, and each wavelength probes a different altitude in Saturn’s atmosphere. The visible wave is in the upper troposphere, where the wind speed at that latitude reaches about 400 kilometers per hour. The feature extends vertically through several atmospheric layers, which is what rules out the simpler explanation that this is just a cloud-top illusion: the wave has roots that go deeper than a single altitude. The aerosol that gives the decagon its blue color has not been identified. Its wavelength-dependent visibility is part of what made the feature easy to miss in ground-based data and easy to confirm in Hubble’s sharper, space-based imagery.

The team has a working hypothesis for why the decagon formed when it did. Just to its north, at about 55°S, an anticyclone vortex first appeared in 2023. By 2025 that vortex had darkened sharply, and shortly afterward the decagon emerged. The suspicion, in the words of co-author Michael Wong of UC Berkeley’s Space Sciences Laboratory, is that “perhaps the vortex caused the initial perturbation, and then the balance of forces caused the persistent decagon.” Sánchez-Lavega built a shallow-water equation model to test whether the geometry could arise from the right combination of zonal wind shear and forcing. The model produced a 10-sided wave under conditions consistent with what Saturn shows, which is encouraging but not yet a full explanation. Whether the decagon settles into the decades-long stability of the northern hexagon, or fades back into the background as Cassini’s transient did, is the open question the OPAL team will be tracking with each annual observation.

Saturn’s jet streams are forced by the same basic physics as Earth’s atmospheric circulation, but at a different scale: faster winds, deeper atmospheres, no solid surface to break up the flow. Standing polygonal waves are an unusual solution to that physics. They arise when the vertical shear of the jet stream and the rotation rate of the planet conspire to lock a wave into a stable shape. Saturn’s northern hexagon is the textbook example: a wave that has sat at the same latitude, with the same number of sides, for at least 40 years, surviving seasonal swings of sunlight that should have perturbed it (Wikipedia). The southern decagon gives planetary scientists a second data point under different conditions, which is exactly the kind of comparison needed to test models of why polygons form at all. It also raises a possibility that several groups have begun to explore: that the northern hexagon, the southern decagon, and the polygonal transients Cassini caught in 2004 are all manifestations of the same underlying physics, with the number of sides, the longevity, and the exact latitude set by the local jet stream conditions. Saturn’s atmospheric dynamics, it turns out, may have a stronger tendency toward polygonal standing waves than a single feature ever suggested.

The OPAL program, which began formally in 2018 to fill the post-Cassini observation gap, now has a fresh round of Saturn portraits scheduled through at least the rest of the decade. Whether the decagon survives into Hubble’s eventual successor era, or fades the way the 2004 perturbation did, is something readers will be able to check on a year-by-year basis. The headline result, for now, is the quiet reset: Saturn’s south pole is no longer the unmarked half of the planet. It has its own geometric weather, and the pattern is still changing.


September 21, 2026

A fresh Type Ia supernova in NGC 7331

Posted by


A fresh Type Ia supernova in NGC 7331. Image: 2026 09 13 sn 2026aaiv ngc 7331 supernova.


On the evening of 1 September 2026, a 0.5-meter telescope on Maui logged a new dot of light next to the core of a spiral galaxy in Pegasus. The Transient Name Server now calls it SN 2026aaiv, and the galaxy it landed in is NGC 7331, the same one that has been used for two centuries as a stand-in for the Milky Way. The supernova is a Type Ia, the kind that turns a stellar cinder the size of Earth into something brighter than the hundreds of billions of stars around it.

What makes this one different is timing. The same survey that found it is built to catch asteroids days before they hit Earth, and the supernova classification certificate arrived in the TNS inbox before most of the world knew NGC 7331 had a transient in it. The event is also still rising. By 11 September it sat at magnitude 15.7, dim to the eye but bright enough for a backyard telescope with a small CCD, and amateur observers were already reporting spectra that show the telltale silicon absorption line at 6355 angstroms moving at roughly 10,500 kilometers per second. If the light curve behaves the way most Type Ia light curves do, the supernova should peak somewhere between magnitude 11 and 12 in the next two weeks, visible through modest amateur instruments under a dark sky.

The host galaxy does most of the work in this story. NGC 7331 sits about 43.8 million light-years away in the constellation Pegasus and is one of the brighter galaxies Charles Messier left out of his 18th-century catalog. The galaxy is unbarred, which separates it from the barred spiral we now think the Milky Way is, and its central bulge rotates in the opposite direction to its disk, an arrangement that has kept astronomers arguing about it since the 1990s. It hosts a similar number of stars, a comparable central supermassive black hole, and a similar star-formation rate to our own galaxy. When the Hubble Caldwell catalog entry for Caldwell 30 calls it an analog to the Milky Way, that is the comparison it means.

A Type Ia supernova is a different animal from the core-collapse explosions that mark the deaths of massive stars. The progenitor is a white dwarf, the dense leftover of a sun-like star that has shed its outer layers and is now sitting at roughly the radius of Earth with about 1.4 times the mass of the Sun. Alone, a white dwarf just cools. Add a companion star in a tight orbit and the dwarf’s gravity becomes a siphon, pulling gas off the neighbor until the white dwarf crosses a mass threshold that ignites its carbon core in a runaway thermonuclear burn. The whole star detonates in roughly a second, and the explosion reaches a peak brightness that is remarkably uniform from event to event. That uniformity is the property that turned Type Ia supernovae into standard candles and powered the 1998 discovery of the accelerating expansion of the universe.

The uniformity has a price. Because every Type Ia reaches roughly the same peak luminosity, the Phillips relationship lets astronomers correct small differences in peak brightness back to a common value and use them to measure distances to around seven percent accuracy. The underlying physics still has open questions, including whether every Type Ia reaches the canonical 1.4-solar-mass Chandrasekhar limit before detonating, but the practical distance ladder has held up across three decades of cosmology.

The survey that found SN 2026aaiv is the Asteroid Terrestrial-impact Last Alert System, a NASA-funded robotic network run by the University of Hawaii’s Institute for Astronomy. ATLAS began observations in 2015 with one telescope at Haleakala; it now operates five 0.5-meter units across Hawaii, Chile, South Africa, and, as of February 2025, Spain. Each telescope surveys one quarter of the observable sky four times per clear night, and the addition of the southern and Spanish stations pushed ATLAS from every-other-night coverage to nightly coverage of the entire dark sky. Its primary job is to give one day’s warning for a 30-kiloton town-killer asteroid and several weeks’ warning for smaller regional impactors, but the same wide-field optical survey turns up a steady stream of supernovae, variable stars, and other transients. SN 2026aaiv is one of those byproducts.

The TNS classification certificate was filed by Claudio Balcon of the Belluno Astronomical Observatory on 2 September at 22:54:58 UTC, using a spectrum taken with the BL41 telescope’s FOSC-E spectrograph at low resolution. The classification software (GELATO and SNID-SAGE) matched the spectrum against a library of Type Ia templates and concluded that the new transient looks like a normal thermonuclear explosion. The redshift came out at 0.003, almost identical to NGC 7331’s recessional velocity, which is how the survey knew within hours that the candidate sat inside the galaxy rather than far behind it.

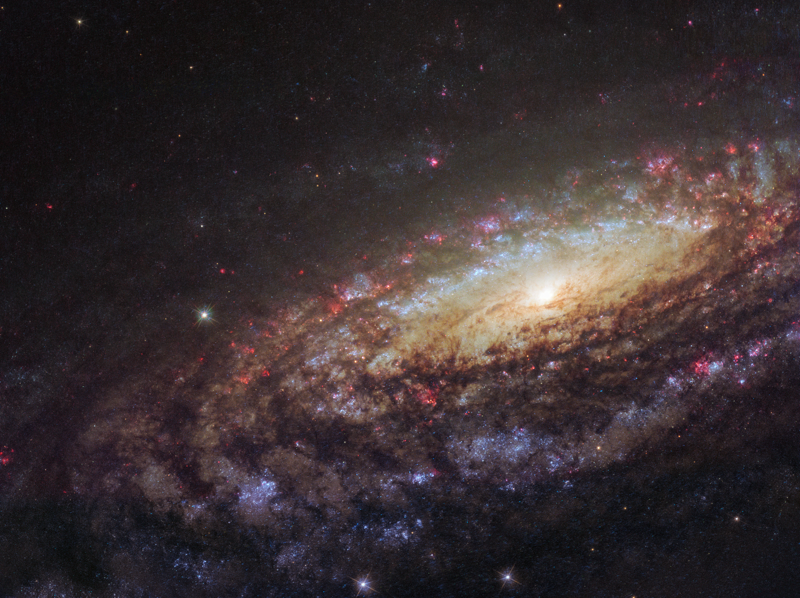
The image above is the 2018 ESA/Hubble view of NGC 7331, taken with the Wide Field Camera 3 during follow-up of a different supernova, SN 2014C, which still appears as a small red dot near the galaxy’s central yellow core in the original frame. The galaxy’s disk is inclined to our line of sight, so the spiral arms wrap around the core in a way that gives the long-exposure view a strong sense of depth. SN 2026aaiv is a new transient on top of the same spiral-arm structure; the position listed on the WISeREP page puts it within NGC 7331’s bright central regions, at right ascension 22:37:05.618 and declination +34:24:35.37.

For anyone with a small telescope in the northern hemisphere, the next two weeks are the window. NGC 7331 transits the local meridian late in the evening at this time of year, climbs to a usable altitude from mid-northern latitudes, and is bright enough at magnitude 10.4 to find with a finderscope. Independent observers have already posted imaging runs with smart telescopes that show the supernova as a new dot superimposed on the galaxy’s bulge. The follow-up spectroscopy that will pin down whether SN 2026aaiv is a normal Type Ia or one of the over-luminous peculiar variants depends on amateur spectroscopists mailing in their calibration files as the light curve climbs.

The most likely outcome is the boring one. SN 2026aaiv will brighten, peak somewhere between magnitude 11 and 12, and then fade over the following months. The value of catching it in real time is not the supernova itself but the cross-check it provides against the standard-candle distance scale. A well-observed Type Ia in a galaxy whose distance is already pinned down by Cepheid variables and the Tully-Fisher relation lets cosmologists test whether the peak-luminosity corrections that go into every Hubble constant measurement still hold for the next generation of telescopes. NGC 7331 has been used as a Milky Way analog for two and a half centuries. For the next few weeks, it is also a working physics laboratory, and the lights are on.


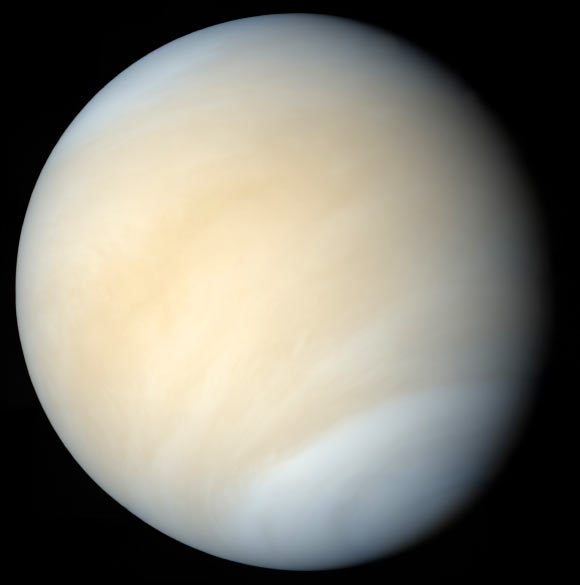
Venus in real colors, processed from Mariner 10 images, showing the pale yellow cloud deck with subtle banding. Source: NASA / Mattias Malmer / Mariner 10 imagery, via sci.news rehost


Venus looks like a smooth yellow disc through any backyard telescope. Point an ultraviolet camera at it, and the same clouds darken into a patchwork of bright and dim regions that has been tracked, named, and puzzled over since the 1920s. The dark patches are not shadows. They are absorbers, real material mixed into the sulfuric acid droplets of Venus’s upper cloud deck, and they soak up enough short-wavelength sunlight to change the planet’s appearance at wavelengths the human eye cannot see.

A new analysis from the Foundation for Applied Molecular Evolution puts a sharp quantitative number on how strong that absorption has to be. The team, led by Jan Spacek with collaborators Yeon Joo Lee of South Korea’s Institute for Basic Science, Janusz Petkowski of the Wroclaw University of Science and Technology, and Paul Rimmer of Cambridge, ran Venus’s observed UV reflectance through a radiative-transfer model that removes the contribution of cloud-droplet scattering and leaves behind a pure absorption coefficient for the liquid inside the droplets. The reported value at 375 nanometers is about 1,278 per centimeter in decadic units, Sci.News writeup of Spacek et al. 2026. That is roughly the absorption strength of a moderately concentrated dye, and it is the kind of number a lab spectroscopist can compare directly against a candidate molecule in a cuvette.

Every Venus mission proposal for the last forty years has, somewhere in its science case, a paragraph about the unknown UV absorber. The substance controls how much sunlight reaches the cloud tops, which sets the upper atmosphere’s energy budget, which feeds back into the superrotation that whips the cloud deck around the planet every four days. If we cannot identify it, every model of Venus’s climate is operating with a free parameter that has been tuned rather than measured. There is also a deeper reason the absorber matters: the cloud deck sits between roughly 50 and 70 kilometers altitude, with pressures and temperatures that on Earth would not be ruled out as a habitat for some kind of microbial life, and the phosphine debate of 2020 was in effect a debate about what kind of chemistry the clouds could host. A clean identification of the absorber would not settle that question, but it would remove one of the major unknowns. The paper was published in Astrobiology on August 25, 2026.

Astronomers have known about Venus’s UV markings since the late 1920s, when ultraviolet-sensitive photographic plates showed the planet as a mottled disc rather than the bland yellow ball it appears at visible wavelengths. The Pioneer Venus Orbiter in the late 1970s, Venus Express from 2006 to 2014, and Akatsuki since 2015 have all mapped the markings in detail. They track the four-day superrotation of the upper cloud deck, which is itself a puzzle: the atmosphere rotates about sixty times faster than the solid planet below. The markings brighten, dim, and re-form over timescales of days to years, and they do not correlate cleanly with any single altitude or temperature layer.

The candidate list is long. Sulfur allotropes, ferrous chloride, hematite, several organic compounds, even microorganisms have all been proposed at various points. None of them, on their own, match all the observational constraints at once: the right absorption strength, the right wavelength dependence, the right behavior over time, and chemical survival in a cloud environment that is mostly concentrated sulfuric acid with traces of water. The Spacek et al. paper takes a different approach. Instead of asking which molecule fits, the team asks how strong the absorption in the bulk cloud liquid has to be, in units a lab spectroscopist recognizes.

They start from spacecraft measurements of Venus’s reflectance between 365 and 455 nanometers and feed those measurements into a radiative-transfer model that treats the cloud droplets as Mie scatterers and accounts for multiple scattering by atmospheric molecules above the cloud deck. The output is the absorption coefficient of the bulk cloud liquid, the same quantity you would get from putting a sample in a cuvette and running a UV-visible spectrometer.

The peak comes out at about 1,278 per centimeter at 375 nanometers. To put that in concrete terms, porphyrin-type pigments in the lab, used here only as familiar examples of efficient absorbers rather than as biological claims, would need to be present at concentrations on the order of 10 grams per liter to hit that coefficient. Many of the inorganic candidates proposed over the years would need to be present at concentrations that strain chemical plausibility in a sulfuric acid aerosol.

A second result is just as important. The spectrum is steep. Between 365 and 455 nanometers, the inferred absorption drops sharply. That rules out the broad, brown, tar-like absorption that simple organics tend to develop when soaked in concentrated sulfuric acid over time. Whatever the absorber is, it resists being converted into that messy mixture. In Spacek’s words, the relatively sharp absorption profile is consistent with a chemically defined absorber that resists conversion into the tar-like mixture. The shape of the spectrum is now a constraint any future candidate has to satisfy.

The radiative-transfer step is the heart of the result and worth a closer look. Venus’s clouds are optically thick, with optical depths well above unity at UV wavelengths, so a photon entering the cloud deck is likely to scatter many times before it is absorbed or reflected back. From orbit, you see a planet that is darker than the underlying absorption alone would suggest, because each scattering event lengthens the photon’s path through the absorbing medium.

Spacek’s group accounts for that with a two-stream treatment, separating the cloud droplet’s scattering cross section from its absorption cross section. The droplet’s bulk refractive index at the relevant wavelengths is the standard sulfuric acid value. The atmospheric path above the cloud deck, mostly carbon dioxide with sulfur dioxide, is treated as a Rayleigh-scattering layer with a small but non-negligible contribution. The model then inverts the observed reflectance to recover the absorption coefficient of the bulk liquid.

The choice of wavelength window matters. Below 365 nanometers, Venus’s atmosphere starts to absorb strongly on its own, mainly through sulfur dioxide bands, and the cloud signal gets harder to disentangle from the gas signal. Above 455 nanometers, the absorber is less active, and the signal-to-noise ratio on the recovered absorption coefficient drops. The 365 to 455 nanometer window is the cleanest band where the absorption is dominated by the cloud droplet’s liquid content.

The 1,278 per centimeter number is a decadic absorption coefficient, the base-10 version of the natural absorption coefficient. In spectroscopy, a value around 1,000 per centimeter in a one-centimeter path length corresponds to roughly 90 percent absorption. That is an aggressive target for any single-component absorber at the concentrations likely in a Venusian cloud droplet, which is why the paper frames its conclusion in terms of either very high concentration, very efficient molecules, or both. The porphyrin-class example is used precisely because porphyrins are exceptionally efficient absorbers per molecule.

A subtler point: the constraint applies to the bulk liquid absorption, not to a single molecule’s molar extinction. A mixture of moderately efficient absorbers at high enough concentration can also produce a bulk coefficient of 1,278 per centimeter, and the paper’s framing does not distinguish between the two cases.

Spacek et al. have not identified the absorber. They have done something arguably more useful: they have turned a planetary-science puzzle into a laboratory measurement with a specific number. A bulk liquid absorption coefficient of about 1,278 per centimeter at 375 nanometers, with a steep roll-off toward 455 nanometers, is now the constraint any candidate has to hit.

The next steps are clearer for it. Lab spectroscopy can screen proposed compounds against this number without flying anything to Venus. Atmospheric modelers can use the tight constraint to reduce the free parameters in their climate simulations. And mission planners designing future Venus cloud-sampling platforms, whether they are looking for chemistry or for the more speculative question of cloud-borne biology, now have a sharper target list to test.