OrbitalHub

Where curiosity reaches escape velocity.

Domain is for sale. $50,000,000.00 USD. Direct any inquiries to contact@orbitalhub.com.


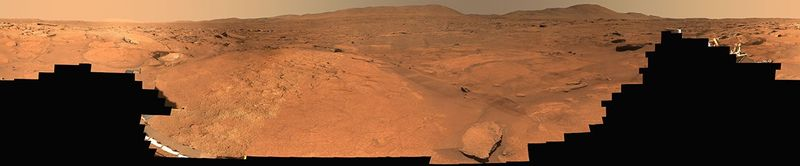
A 360-degree Mastcam-Z panorama of Turquoise Bay in the Margin Unit along the inner edge of Jezero Crater, stitched from 818 natural-color images Perseverance captured between October 5 and 16, 2023, sols 933 through 944 of the mission. The rolling brownish-red Martian terrain stretches to the horizon, with the rover itself visible as a small bright glint near the center of the panorama.


A piece of rock on the inner rim of Jezero Crater was soaked at least three times by very different waters over the course of Martian history, and NASA’s Perseverance rover has now read each of those chemical signatures off the same outcrop. The work, led by Candice Bedford at Purdue University, appears in the journal Communications Earth & Environment and was published online on September 21, 2026 (NASA Mars news, Sep 21 2026; Sci.News coverage). It turns a single strip of terrain along the crater’s former shoreline into one of the more interesting astrobiology sites on the planet, and it quietly resets a long-running debate about how the rocks there formed in the first place.

The location in question is called the Margin Unit, a band of rock that hugs the inner edge of Jezero’s rim where the ancient lake that once filled the crater met dry land. Mission scientists had been puzzling over it since before Perseverance even landed. Orbital instruments had shown strong carbonate signals along that shoreline, and carbonates are the sort of mineral that on Earth usually forms in shallow, life-friendly water, so the natural expectation was that the Margin Unit would turn out to be sedimentary rock, the layered, sandy stuff that is great at trapping microbial remains. Instead, Perseverance’s instruments showed that the band is mostly olivine-rich igneous rock, a coarse-grained material that on Earth typically crystallizes slowly underground from cooling magma. The carbonates are there, but they are not the original rock. They are an overprint, and the new paper unpacks how three separate waters, each with a different temperature and chemistry, left their own overprint on the same parent material over time (Universe Today, Sep 24 2026). That detail matters because the Margin Unit sits inside one of the largest carbonate exposures on Mars, and Jezero itself has been the centerpiece of NASA’s most ambitious astrobiology campaign in decades. If the orbital carbonate signal really does trace a single ancient lake, then the carbonates are essentially a fossil of that lake, and they should record the chemistry of habitable water. If the carbonates instead reflect a much messier history of groundwater, hydrothermal fluids, and lake water acting on the same rock at different times, the carbonates are not a snapshot of habitability, they are a stack of snapshots. Bedford’s team argues it is the latter, and they have the chemistry to show it.

The paper is built on more than 185 rock targets, all measured by SuperCam, the laser-and-spectrometer instrument perched on Perseverance’s mast. SuperCam fires a laser up to 6.5 meters away at a target rock and reads the spectrum of the resulting plasma to determine the rock’s chemistry. Across roughly 265 meters of vertical relief in the Margin Unit, the team at high elevations saw what they expected from a deep, slow-cooled igneous body: coarse olivine crystals with essentially no sign that water had ever reached them. About 265 meters lower, at the elevation where the ancient lake would have lapped against the crater wall, the same parent rock looks transformed. The olivine grains are fractured, and silica has filled the spaces between them. Some of those silica-bearing samples also contain the calcium-sulfate and fluorite veins that mark a third, much hotter stage of alteration (Space.com coverage). The sequence the team proposes runs as follows. Long before any lake existed in Jezero, carbon-dioxide-rich groundwater percolated through cracks in the olivine-rich bedrock. Where that groundwater met the right minerals, it produced carbonate. As the softer host rock around those carbonate-filled fractures eroded away over billions of years, the carbonates were left standing as ridges, which is the texture that first drew orbital attention to the Margin Unit in the first place. Then, in a window that the team cannot date precisely, water that may have been the Jezero paleolake, or a shift in the chemistry of groundwater connected to the lake, washed through the rock again. This second event partly remobilized the early carbonates and dropped silica into the pore spaces, with more silica appearing in rocks that sit below what would have been the old waterline. Finally, a third water event, this one clearly hotter, drove fluids through younger fractures in the eastern Margin Unit and deposited 25-centimeter-thick veins of calcium sulfate and fluorite. Fluorite, in particular, is a fingerprint of hydrothermal activity on Earth, and finding it on Mars is a strong hint that hot water was circulating through volcanic terrain long after the lake was gone.

Bedford has been working with Mars rovers for a decade, and her framing of the result is worth the gravity. “It is very rare that things are as we expect them to be from orbital data,” she said in a NASA press release accompanying the paper, adding that she hopes the work helps reshape how scientists view the history of water in Jezero and across Mars, and ultimately helps reconstruct the changing climate and habitability of early Mars (NASA Mars news). Her co-author Eleni Ravanis, who works on the SuperCam team at the University of Hawaii at Manoa, made a more specific point about what the silica signal is actually telling us: turning olivine into carbonate leaves silica behind, so the more silica you see, the closer the rock sat to the waterline, which makes silica a kind of paleoshoreline marker for a lake that no longer exists. The implication is that the Margin Unit is not just a place where water once flowed, it is a place where water acted multiple times, with each event leaving its own chemical signature stacked on top of the last.

Astrobiologically, that stacking is the most interesting part. On Earth, the reaction between water and olivine can release hydrogen, and there are microbes that can live off that hydrogen. The reaction also leaves behind carbonate and silica, both of which are good at preserving traces of those microbes. So a rock that has been soaked, reheated, and re-soaked in different fluids is not a worse biosignature target than a rock that has only been touched once. It is a record of a longer, more complicated habitability window, and the chemistry preserved inside it is denser. Perseverance has already drilled and cached samples from the Margin Unit, including cores named Pelican Point and Lefroy Bay, and those samples are expected to be among the most prized tubes in the future Mars Sample Return campaign. If any of those cached samples turn out to carry organic material, this paper will be the document that explains why those particular rocks were the right ones to pick up. The image below is a 360-degree Mastcam-Z panorama of Turquoise Bay, a region inside the Margin Unit, captured between October 5 and October 16, 2023, sols 933 through 944 of the mission, and it shows the kind of rolling, weathered terrain that SuperCam has been analyzing ever since (NASA Photojournal PIA26815).
 

October 12, 2026

Roman’s coronagraph opens its eye

Posted by


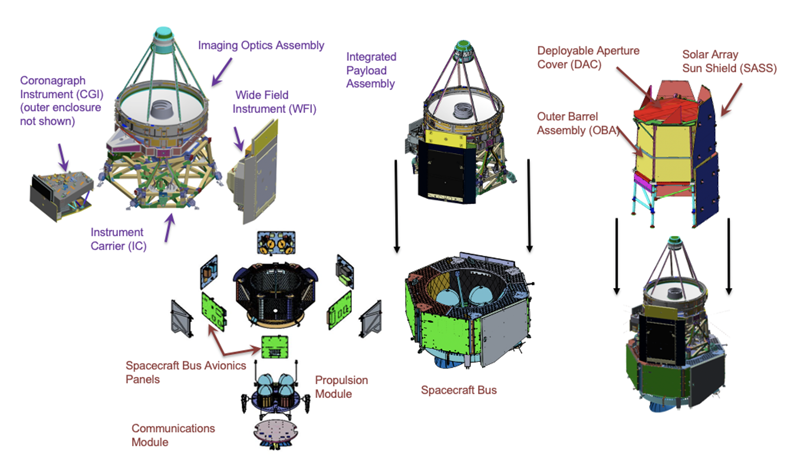
Schematic of the Nancy Grace Roman Space Telescope with the Coronagraph Instrument (CGI) called out as a separate module from the Wide Field Instrument (WFI), both attached to the Imaging Optics Assembly and Instrument Carrier, with the Spacecraft Bus and Solar Array Sun Shield shown separately. Source: Wikimedia Commons: Scheme of Roman Space Telescope (NASA public-domain artwork).


Five weeks after lifting off from Kennedy Space Center on a Falcon Heavy, NASA’s Nancy Grace Roman Space Telescope did the one thing its coronagraph was built to do. On September 22, 2026, the Coronagraph Instrument, a technology demonstrator bolted onto the side of the Wide Field Instrument and shielded from starlight by a system of masks and deformable mirrors, opened to cosmic light for the first time, according to a NASA Roman blog post on September 30 and a contemporaneous Caltech announcement that also noted the milestone on September 27. The team had kept the detectors slightly warmer than they will run during science operations to keep contamination from settling on them, so the first image was a noisy one. Five days later, on September 27, they cooled the detectors and pointed again at a new patch of the Large Magellanic Cloud, and the second frame showed what a star field is supposed to look like. The coronagraph had a focused image, and the team could exhale.

The milestone matters because Roman’s coronagraph is the first active, deformable-mirror coronagraph ever operated in space. Hubble’s coronagraphs were passive: a black spot in the focal plane to physically block starlight, with no way to clean up the diffraction rings and speckles that left a bright star’s halo drowning out any nearby planet. Roman’s coronagraph, designed and built at NASA’s Jet Propulsion Laboratory and operated from Caltech’s IPAC, has two deformable mirrors that reshape themselves about 100 times a second to push the residual starlight into a controlled pattern the team calls a “dark hole.” If the approach works, it will be the technological seed for the Habitable Worlds Observatory, the still-in-formulation flagship NASA wants to launch in the 2040s to image Earth-like planets around Sun-like stars. None of that is possible until a deformable-mirror coronagraph has actually been tested in orbit, which is what made September 22 a quiet but real turning point.

The story behind September 22 starts with launch. Roman left Earth on August 30, 2026 (the mission profile on Wikipedia covers the launch, the cruise to L2, and the planned five-year primary survey), and the Wide Field Instrument and Coronagraph Instrument have been powering on and stretching out one subsystem after another as the observatory cruises toward its halo orbit around the Sun-Earth second Lagrange point. The coronagraph itself woke up on September 1. Mid-month it deployed its mechanical limbs and electronics. The team then spent September 15 through 21 testing the fine-guidance system, a piece of the observatory’s attitude control that has no separate hardware, but instead reads guide-star positions from a small patch of each of the 18 infrared detectors in the Wide Field Instrument. The fine-guidance system reports those positions to the spacecraft’s attitude control about four times per second, and the attitude control nudges the observatory a tiny amount each time to keep it from drifting. Tests confirmed Roman could hold pointing stable to better than one hundred-thousandth of a degree for half an hour at a time with the Wide Field Instrument, and for eight hours at a time with the Coronagraph, a tighter constraint because the coronagraph’s own internal stability loop was also running.

The stability budget for the coronagraph is what makes the second observation more impressive than the first. Even a few nanometers of mirror motion, or a few milliarcseconds of pointing error, would let unwanted starlight leak around the coronagraph’s masks and overwhelm a planet roughly a millionth as bright as its host star. Engineers put the current pointing performance in the same terms they use for any other precision pointing system: keeping a laser focused on a U.S. dime from about 150 miles away, with a goal of stretching that to roughly 230 miles as the commissioning continues. With the fine-guidance loop and the coronagraph’s own internal loop both running, on September 22 the team allowed starlight from a faint star in the Large Magellanic Cloud to fall on the coronagraph’s detectors. The image was blurry by design because the detectors were running warmer than they would in steady-state science, but it confirmed the optical path from the primary mirror, through the coronagraph masks and deformable mirrors, to the focal plane was clear and focused.

Five days later the team ran a second observation, this time after cooling the detectors toward their final operating temperature for better sensitivity, and pointed at a new region of the Large Magellanic Cloud where the team expected many stars in a single frame. The coronagraph saw them. That second observation confirmed the team could reliably move the field of view and keep the coronagraph stable while doing so. Roman’s coronagraph instrument scientist Vanessa Bailey, at JPL, summed up the second observation in plain language: “we’re breathing a sigh of relief.” Alexandra Greenbaum, coronagraph data management lead at IPAC, framed the milestone around what comes next: she’s looking forward to the rest of commissioning on both the operations and the data-processing side.

The technology itself is the science and engineering deep dive here, because that is what makes the milestone a milestone. A coronagraph suppresses starlight so a much fainter planet or disk next to that star becomes detectable. In a passive coronagraph, like the one on Hubble’s STIS instrument or on James Webb’s NIRCam, a physical mask in the focal plane blocks the bright star’s core, but the wave nature of light still spreads some of that starlight into a halo of rings and speckles around the mask edge. Roman’s coronagraph actively corrects the wavefront of the incoming light using two deformable mirrors, surfaces whose shapes can be changed hundreds of times per second by pushing on the back of the mirror with hundreds of small actuators. When the deformable-mirror pattern is right, the speckle pattern from starlight interferes with itself and cancels out across a small region of the image, opening what the team calls the “dark hole.” That dark hole is where a much fainter planet, if there is one, would be visible. The trade is that the dark-hole trick only works for a narrow annulus around the star, and the deformable mirrors must keep running or the dark hole closes within milliseconds. Roman’s coronagraph uses two 64-by-64 actuator mirrors and a set of focal-plane masks that physically block the starlight before the deformable mirrors do their work, and the September 22 observation was a sanity check that all of those pieces are aligned well enough to deliver a focused image at all.

The other piece that makes the coronagraph unusual is the fine-guidance system, which is part of why the September 15-to-21 testing week mattered. Hubble, JWST, and most space telescopes carry a separate guider instrument, basically a small auxiliary telescope that locks onto a guide star and tells the main telescope where it is pointing. Roman does not have one. Instead, the team reuses a few pixels on the edges of the Wide Field Instrument’s 18 infrared detectors to track guide stars, and uses the spectra of those guide stars, not just their positions, to hold pointing steady. That gives Roman a way to point more precisely than a star-image tracker would, because spectra carry more information than a centroid, and it saves mass by removing a separate instrument. Roman’s guiding lead Begoña Vila, at Goddard, said the team is looking forward to validating that spectral-guiding mode in the coming weeks. The September 15-to-21 tests used position-only guiding; spectral guiding is the second tier, and confirming it is one of the remaining milestones of commissioning.

What comes next is a three-month commissioning campaign that will run Roman through a series of progressively harder tests. The coronagraph team will practice keeping the dark hole stable for longer and longer exposures, will test the deformable-mirror control loop under realistic thermal conditions, and will try imaging the dust disks that the coronagraph was originally scoped to study. NASA expects Roman’s first image release in early 2027, with the coronagraph’s first science-quality image landing later in the year once the deformable-mirror dark hole is reliably closing on demand. The September 22 and 27 observations are not those images. They are the “we have a working instrument” sign on the door, and the second one shows that the door is on hinges.


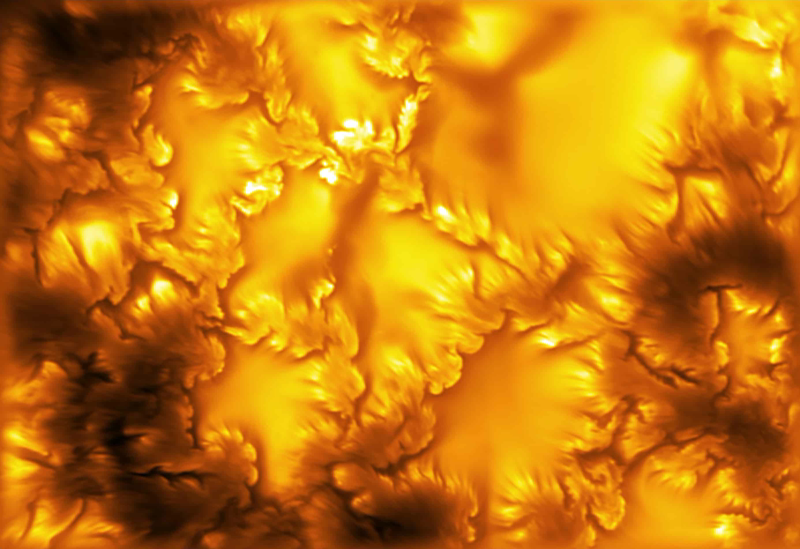
The highest-resolution image of the Sun's photosphere ever captured, taken at 416 nm by the Inouye Solar Telescope, showing granulation cells in golden orange with darker intergranular lanes and small vortex-like swirls along the edges of magnetic structures. Image source: NSF/NSO/AURA/MPS.


For roughly a century and a half, Kelvin-Helmholtz instability has lived a quiet life in physics. It explained the curls at the crests of ocean waves in a stiff breeze. It showed up in the banded clouds of Jupiter and Saturn. It was theorized to happen on the Sun’s visible surface, where hot plasma bubbles up and slides sideways past magnetic field lines, but no one had ever caught it doing it. That changed on August 5, 2026, when David Kuridze at the U.S. National Science Foundation National Solar Observatory and colleagues published the first unambiguous observation of Kelvin-Helmholtz vortices in the Sun’s photosphere, captured by the 4-meter Daniel K. Inouye Solar Telescope on Maui. The features are tiny: roughly 20 kilometers across, with an instability wavelength between 50 and 65 kilometers. The NSF NSO press release went out the same day, and the result was covered widely afterward.

Solar physicists have spent the better part of two decades arguing about a simple question: what keeps braiding the Sun’s magnetic field? The field is built up by a global dynamo, regenerated on an 11-year cycle, and released in flares and coronal mass ejections that drive space weather at Earth. The release happens through magnetic reconnection, where tangled field lines snap and reset into a lower-energy configuration, but something has to braid the lines in the first place, and existing models have struggled to braid them fast enough. The leading candidate has been “flux braiding” by granular flows (the bubbling of the Sun’s surface as hot plasma rises, cools, and sinks), but no one had directly observed the small-scale mechanism that makes that braiding efficient.

That is what the new result changes. The images show that wherever the photospheric magnetic field is strong enough, the boundary of the magnetic structure becomes sheared by the surrounding granular flow, and that shear rolls up into vortices with the wavelength and shape predicted by classical Kelvin-Helmholtz theory. The vortices are not rare. They are everywhere the field is strong. That gives the braiding mechanism a physical engine: KHI-driven turbulence, persistent and ubiquitous, capable of twisting field lines on the right timescale. It also gives coronal heating, the long-standing puzzle of why the Sun’s outer atmosphere is more than a million degrees Kelvin while the surface is only 5800 K, a candidate answer, since the same shear that braids the field also mixes magnetized and unmagnetized plasma and pumps energy upward.

The Inouye Solar Telescope, also known as DKIST, sits at roughly 3000 meters on Haleakalā, with a 4-meter primary mirror (the largest in any dedicated solar telescope). Science operations started in late 2021 after two decades of construction. The August 5 paper pulls together observations from the telescope’s Visible Broadband Imager (VBI), which captures the photosphere in narrow wavelength bands tuned to specific spectral lines. The KHI data were taken at 416 nanometers, a wavelength sensitive to the photosphere’s quiet magnetic regions.

Kuridze’s team is international: the National Solar Observatory in Boulder; the NSF NCAR High Altitude Observatory (HAO); and the Max Planck Institute for Solar System Research (MPS) in Göttingen. Twelve co-authors include Friedrich Wöger and Thomas Rimmele from NSO; Matthias Rempel from HAO; and Robert Cameron and Sami Solanki from MPS. The paper also validates, at the highest resolution to date, MURaM simulations (Max Planck/University of Chicago Radiative MHD), which simulate the Sun’s surface from first-principles physics. The agreement on vortex structures, wavelength, and fine-scale striations was close enough that the team could rule out alternative explanations.

The vortices appear as small curls at the edges of magnetic field concentrations, where the surrounding plasma flows at one speed and the flux tube moves at another. The curls break down into thin dark stripes a few kilometers wide, the finest-scale dark striations known on the Sun. In the comparison image the team published, the simulated frame and the observed frame are nearly indistinguishable, which convinced the referees that the feature was real and not an artifact. The structures are stable on the timescales of minutes, long enough to rule out noise, but short enough that they could only have been caught with sub-second exposure times.

The timing matters. August 5 lands during the peak of Solar Cycle 25, when the Sun’s magnetic field is most disordered and space-weather events are most likely to affect satellites and power grids. Kuridze told CNN the discovery is “a really efficient way for the Sun to break big plasma flows down into smaller motions,” letting the Sun heat its corona to millions of degrees. Rempel called the agreement between the Inouye observations and the MURaM simulations “the highest resolution validation of solar magnetohydrodynamic simulations to date,” in coverage summarized by Sci.News.

Kelvin-Helmholtz instability, formulated around 1870 by Lord Kelvin and Hermann von Helmholtz, describes how a flat interface between two fluid layers moving at different speeds can spontaneously wrinkle. Any small perturbation along the interface gets amplified by the shear: the high-speed side drags the boundary forward, the low-speed side holds it back, and the differential motion feeds back into the perturbation until the boundary rolls up into a train of spiral vortices. The spacing of the vortices, the instability wavelength, is set by the shear velocity, the density contrast across the interface, and the magnetic tension that resists the rolling.

In the Sun’s photosphere, the relevant interface is between a magnetic flux tube (a vertical column of stronger magnetic field anchored in the Sun’s surface) and the surrounding non-magnetized plasma. The flux tube is buoyant: it has lower density than its surroundings because magnetic pressure partially replaces gas pressure. It also moves more slowly than the surrounding plasma, which is shoved sideways by granulation. That is exactly the configuration for Kelvin-Helmholtz: a denser, slower fluid next to a less-dense, faster fluid, with a magnetic interface that resists being broken. As the team observed, the interface deforms, vortices form, and thin dark stripes are shed downstream, just as classical theory predicts.

The numbers line up. The team measured the instability wavelength between 50 and 65 kilometers in both observations and MURaM simulations, matching the wavelength computed from the measured shear and density contrast within a factor of two. The vortex diameters are smaller, on the order of 20 kilometers, the right size for the boundary layer to wrap around before the vortices detach. A single granulation cell on the Sun’s surface is about 1000 kilometers across, so each granule contains many thousands of vortices when magnetic flux is present. Every granule has magnetic flux threading it, and every flux tube has a sheared boundary.

This matters because the same vortices that braid the magnetic field also mix it. Magnetic flux diffusion, the rate at which the Sun’s field spreads out and reconnects across the photosphere, has been a stubborn parameter in dynamo models: predicted values were too low to explain the 11-year cycle, and observed values were hard to pin down. KHI-driven mixing gives a physical source for that diffusion, on the right spatial and temporal scales. It also pumps energy upward: the vortices shed kinetic energy that cascades to smaller scales, where viscous and resistive dissipation convert it to heat in the chromosphere and corona. Whether that cascade is large enough to be a major contributor to coronal heating is what the team is now pursuing, with automated detection pipelines to count vortices across the full active region.

The August 5 paper is a settled result, not a live event: the Nature paper, the DKIST data, the MURaM simulations, and the imagery are all public and archived. What changes is the resolution of the field. The Inouye Solar Telescope is resolving features at the 20-kilometer scale on the Sun’s surface, and the team has done the comparison work to rule out alternative explanations. The next step is automated detection of these vortices in the existing DKIST archive, which runs into the petabyte range. For space-weather prediction, the practical step is to fold KHI-driven magnetic diffusion into the operational models that drive the next solar cycle’s forecasts. The first such updates, from HAO and MPS, are expected within the year. The Sun has been running its 11-year magnetic cycle for at least the past few hundred cycles. We are only now watching it run.


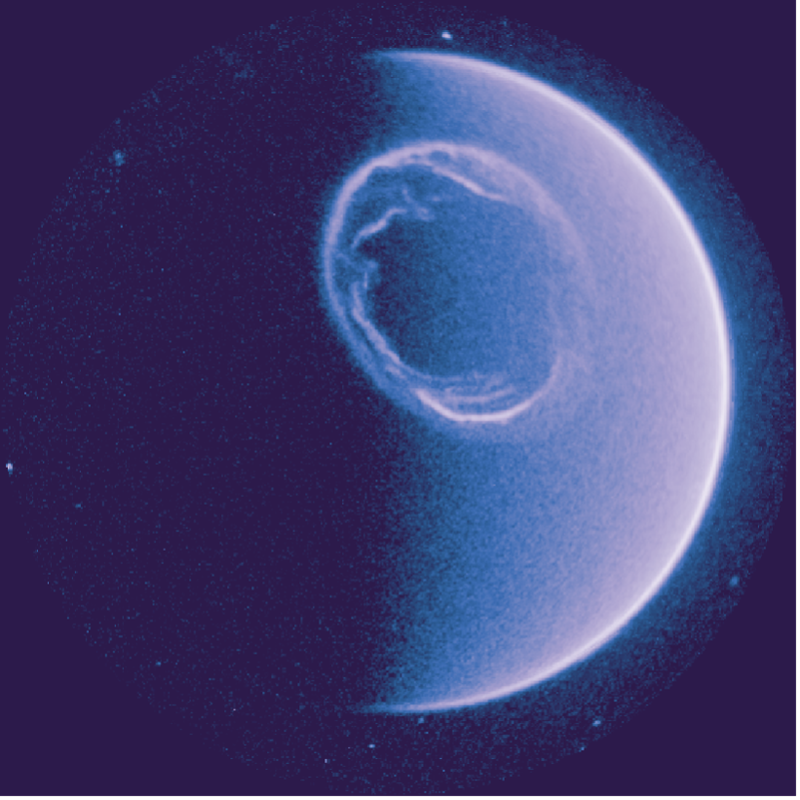
Earth's northern hemisphere as seen by SMILE's UVI camera on 24 July 2026, showing the dayside and nightside auroral oval in ultraviolet light. (Image credit: ESA & CAS/Smile/UVI)


For most of the last eighteen years, anyone wanting to see the whole northern auroral oval at once has had to piece together images from low-Earth orbit, stitching narrow camera swaths into a quilt. The ultraviolet imager on the new SMILE spacecraft ended that gap on 24 July 2026, and on 30 September 2026 the European Space Agency released the result: a 45-hour ultraviolet movie of the entire ring of northern lights, dayside and nightside together, with an auroral substorm frozen mid-ripple. It is the first complete ultraviolet portrait of the oval since NASA’s Polar mission ended in 2008, and the early frames are already changing how researchers think about the boundary between the solar wind and Earth’s magnetic shield.

SMILE, the Solar wind Magnetosphere Ionosphere Link Explorer, is the first space mission jointly selected, funded, built, launched, and operated by ESA and the Chinese Academy of Sciences. It launched on 19 May 2026 aboard a Vega-C from Europe’s Spaceport in French Guiana, reached its science orbit on 20 June, and on 23 September 2026 ESA declared the spacecraft ready to start routine science operations. The mission is built around a question that has lingered since the magnetosphere was first sketched in the 1960s: how does the Sun’s wind of charged particles couple, end to end, to the bright auroras people watch from the ground. Past missions like ESA’s Cluster constellation and NASA’s IMAGE have studied pieces of that problem. SMILE is the first to watch the whole system in one go.

The instrument that produced the released image is UVI, the ultraviolet aurora imager, one of four science payloads aboard the 2,300-kilogram spacecraft (1,580 kilograms of that is propellant used to climb to its operational orbit). UVI was switched on 16 July 2026 and began returning data on 24 July, when the spacecraft caught a substorm in progress. Substorms are short disturbances in the magnetosphere, produced when a pulse of solar wind compresses Earth’s magnetic field lines, fires a burst of energetic particles down toward both poles, and lights up the oval for tens of minutes. The released 58-second clip covers 00:00 to 00:58 Universal Time, with the timestamp ticking in the upper left corner and distant ultraviolet stars drifting in the background. The way the bright ring ripples and brightens across those 58 seconds is the signature of a substorm loading and unloading the magnetotail.

The image at the top of this post is a single frame from that clip. The crescent Earth is light blue, the way it always looks in the ultraviolet Lyman-alpha and far-ultraviolet bands UVI is tuned to. Around the north pole, the white swirl is the auroral oval itself, including the dayside arc that ground cameras cannot see because the Sun drowns it out. The image is square because UVI’s field of view is roughly 10 degrees across, and the spacecraft’s highly inclined, highly elliptical orbit takes it as far as 121,000 km above the North Pole at apogee, nearly a third of the way to the Moon. From that height, the camera can frame the entire oval in a single exposure. The other three instruments contribute context that UVI alone cannot: SXI, a soft X-ray imager led by the University of Leicester, will map the magnetopause, the boundary where the solar wind meets Earth’s magnetic field, by imaging X-rays produced when solar wind ions swap charge with neutral atoms in the geocorona. MAG, a boom-mounted magnetometer, samples the local field strength. LIA, a light ion analyzer on the platform, counts the solar wind particles themselves. The combination is what makes SMILE different: it is a magnetosphere-wide camera, not a single-region probe.

The science the mission is built to chase is space weather. Solar storms can knock out satellites, drag down power grids, and force airlines to reroute polar flights, and the most damaging ones are the hardest to predict because the chain from solar wind to ground-level aurora runs through a magnetosphere that nobody has watched in its entirety. SMILE’s 45-hour continuous ultraviolet sessions are aimed at filling that gap, capturing the oval through enough of a solar rotation to see how the magnetosphere responds as the wind direction and density shift. ESA expects about 300 substorms across the three-year nominal mission, more than usual because the Sun is at the peak of its eleven-year cycle. The mission consortium, reported by India Today, includes more than 250 European and Chinese scientists and 14 contributing countries, with Airbus Defence and Space leading the payload module assembly at ESA’s ESTEC technical centre in the Netherlands. The mission also carries the first instrument ever designed to look at the magnetopause in X-ray light, opening a window that no previous mission has had.

There are open questions that no amount of engineering has answered yet. SXI, the soft X-ray imager, is currently too sensitive to stray light when pointed at Earth, and the team is uploading new settings and software to the spacecraft to bring the background down. The good news is that the unwanted light is dropping on its own as SMILE’s orbit carries it farther from Earth and as the north pole tilts into winter darkness. Mid-October 2026 should bring SXI’s first clean view of the magnetopause or the northern polar cusp, the funnel-shaped hole in the magnetic field above the pole through which solar wind ions rain down. Once SXI lights up, SMILE will be returning simultaneous X-ray and ultraviolet movies of the same events, the first time anyone has correlated the two views frame by frame. The auroral substorm clip itself, covered by Space.com on 2 October, is what put SMILE in front of a public audience that had not heard of the mission before.

What comes out of the next few months is going to be a database, not a single picture. The first ultraviolet still is the proof that the camera and the orbit work, and the GIF of the 24 July substorm is a teaser for the kind of change the camera can resolve. The real work begins in late October 2026, when SXI is expected to deliver its first usable magnetopause image and the four-instrument observation campaign gets underway. Three years from now, the dataset SMILE accumulates should let researchers tie specific solar wind conditions to specific ground-level disturbances in a way that current models, which lean heavily on extrapolation, cannot. That is the kind of data that takes the guesswork out of space weather forecasts, and that is what the mission was conceived to deliver. The first still was the postcard; the science database is what the postcard is advertising.


October 11, 2026

The Moon could anchor Earth’s GPS

Posted by


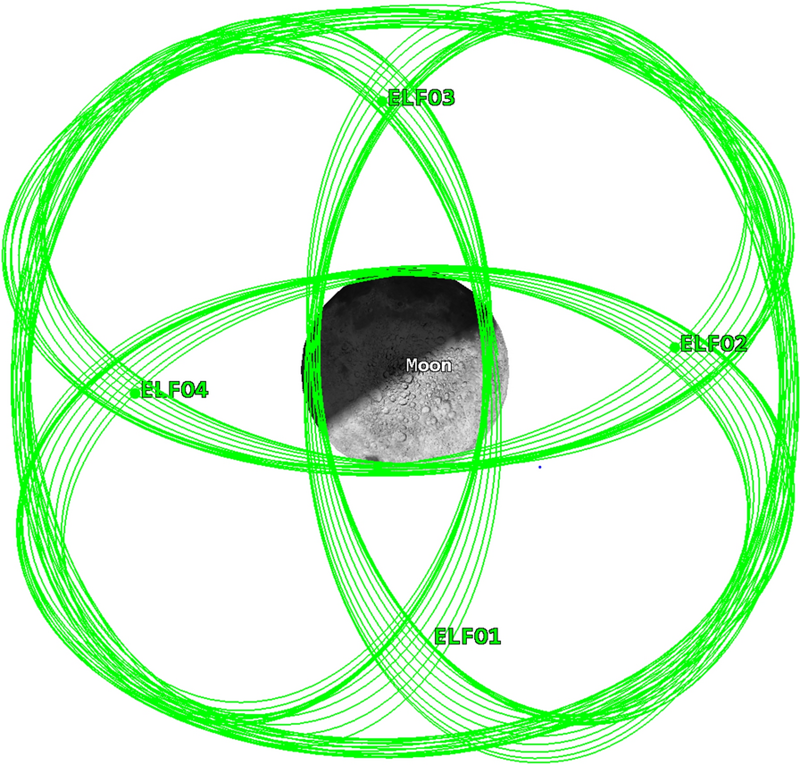
The proposed four-ELFO constellation around the Moon, with orbits labeled ELF01 through ELF04 in green, viewed from above the lunar north pole. The elongated ellipses are the Elliptical Lunar Frozen Orbits designed to provide continuous coverage of the lunar south pole while remaining stable with minimal station-keeping. Figure 4 from Lin et al. 2026 (https://link.springer.com/article/10.1186/s43020-026-00217-9/figures/4), reproduced under CC BY 4.0.


A constellation of navigation satellites can measure the distance between each member with centimeter accuracy and still, slowly, lose track of which way the whole network is pointing. That is the awkward truth at the heart of every Global Navigation Satellite System on Earth, and it is the puzzle researchers at Shanghai’s Microsatellites Engineering Center set out to solve on 17 September 2026 with a paper in Satellite Navigation, announced through EurekAlert. The lead authors were Xia Lin and Baojun Lin, two of the center’s senior engineers. Their answer was to extend the network 384,000 kilometers outward and let four satellites in elliptical orbits around the Moon serve as a gravitational anchor. The result, written up in the open-access journal under a CC BY 4.0 license, is the first end-to-end demonstration that real BeiDou-3 inter-satellite data, paired with simulated lunar cross-links, can keep an autonomous navigation system stable to within roughly 35 centimeters of User Range Error over 60 days, an order of magnitude better than the BeiDou-only baseline.

The reason a spaceborne navigation system needs an anchor at all is that inter-satellite ranging, the technique GPS pioneered in the 1990s and that every modern GNSS now uses to back up its ground stations, has a built-in symmetry problem. Each satellite measures its distance to its neighbors. Those measurements fix the relative geometry of the constellation with high precision, but they cannot distinguish one orientation of the whole network from another, because rotating the constellation rigidly in space leaves every inter-satellite distance exactly the same. Engineers call this property an orientational rank deficiency, and the symptom it produces is a slow rotational drift in the right ascension of the ascending node, the angle that defines where each orbital plane points in inertial space. Without ground-station updates, even a state-of-the-art autonomous system like BeiDou’s accumulates error at a rate of meters per month, which is why every GNSS operator still maintains an expensive global network of monitoring stations as a backup.

The Lin et al. solution exploits a simple geometric fact. A satellite in Earth orbit experiences the Earth’s gravity, which is nearly symmetric about the rotational axis. A satellite in a tight elliptical orbit around the Moon experiences the Moon’s gravity, which is not aligned with Earth’s axis at all. If the entire BeiDou-plus-lunar network were rotated incorrectly as a rigid body, the Earth-orbiting and Moon-orbiting members would no longer respond to their respective gravitational environments in the same way. Earth-Moon cross-links therefore carry information that Earth-only links cannot, and that information breaks the symmetry. The team quantified the change in a particularly clean way. They computed the condition number of the information matrix, a standard mathematical measure of how well-posed a least-squares problem is. For 24 BeiDou Medium Earth Orbit satellites alone, the condition number sat between roughly 10^15 and 10^18, the signature of a numerically singular system. Adding four simulated ELFO satellites dropped the condition number to about 10^2, a fourteen-orders-of-magnitude improvement that signals the symmetry has been fully broken.

The team’s experimental setup is unusually faithful for a navigation study, because half of it is real. They pulled actual on-orbit inter-satellite-link measurements from the operational BeiDou-3 MEO constellation, whose Ka-band TDMA cross-links can resolve ranges with noise floors near 10 centimeters, and combined those measurements with a simulated four-satellite constellation in Elliptical Lunar Frozen Orbits. The ELFO geometry, with four satellites in nearly identical, carefully chosen orbits arranged 90 degrees apart in node, is the same architecture that ESA’s Moonlight initiative and NASA’s LunaNet concept have independently converged on for lunar relay coverage, because ELFOs offer long dwell times over the south pole and remain stable with minimal station-keeping. The team used the well-characterized Sirbu et al. four-ELFO design and ran a 60-day simulation from October through December 2020, processing the BDS-3 data through a Kalman filter that jointly estimated the orbits of all 28 satellites along with clock offsets and Earth rotation parameters. The team also tested the architecture against an additional intermediate scenario in which the BeiDou satellites were allowed to use predicted orbit corrections on their own, an option that captures what an operator could realistically do for the first few weeks of a ground-station outage before the predicted-ephemeris quality decays.

Without any ground-station correction at all, the constellation in the unmitigated scenario drifted by about 7.85 meters of User Range Error after two months. Adding predicted orbital parameters as a partial constraint improved that to 0.6 meters. Adding the four ELFO cross-links dropped it to 0.35 meters, and the three-axis rotation bias was suppressed to 13.59, 10.27, and 4.04 milliarcseconds over the full 60 days. Crucially, the same cross-links help the lunar satellites, too: the four ELFO orbiters reached a maximum three-dimensional position error of 2.26 meters, with radial, along-track, and cross-track components below 0.16 m, 1.7 m, and 1.8 m respectively. The architecture is genuinely two-way. Earth-bound satellites help pin the Moon-bound satellites, and the Moon-bound satellites help pin the Earth-bound ones.

The reason this is more than a clean numerical result is that the cislunar navigation constellations ESA and NASA are actively planning to build for crewed lunar surface operations now have a second job description, as The Brighter Side of News explained in its coverage of the paper. ESA’s Moonlight and NASA’s LunaNet have both been framed primarily as services for south-pole landers, rovers, and astronauts, but if the Lin et al. result holds up in operational hardware, the same lunar relay satellites will quietly double as a stability anchor for the GNSS networks that every other piece of modern infrastructure depends on. A four-satellite lunar constellation costs a small fraction of a full ground-station refresh, and unlike ground stations it cannot be knocked out by a regional communications failure, a cyberattack, or a natural disaster.

Several caveats apply. The lunar portion of the experiment is a simulation, not flight data, and the joint condition-number analysis assumes the Earth-Moon cross-link can be timed to roughly the same precision as the existing BeiDou-3 Ka-band cross-links, which today is straightforward in principle but has not been demonstrated in hardware at 384,000-kilometer range. The 60-day window is also short for a real constellation; whether the drift suppression holds over years, through solar maximum, and across lunar eclipse seasons remains open. The Lin et al. paper is, in their own framing, a preliminary analysis, the first credible end-to-end case that the geometry works, not the last word. The team is appropriately careful about that. The next step that matters is a flight demonstration, likely as a hosted payload on one of the early Moonlight or LunaNet spacecraft, that closes an actual Earth-Moon cross-link and measures the rotational bias suppression directly. The result, when it comes, will tell us whether the 0.35-meter number survives contact with reality. If it does, the architecture of every future GNSS is going to have a footnote about the Moon.


October 10, 2026

A planet born from a dead star’s ashes

Posted by


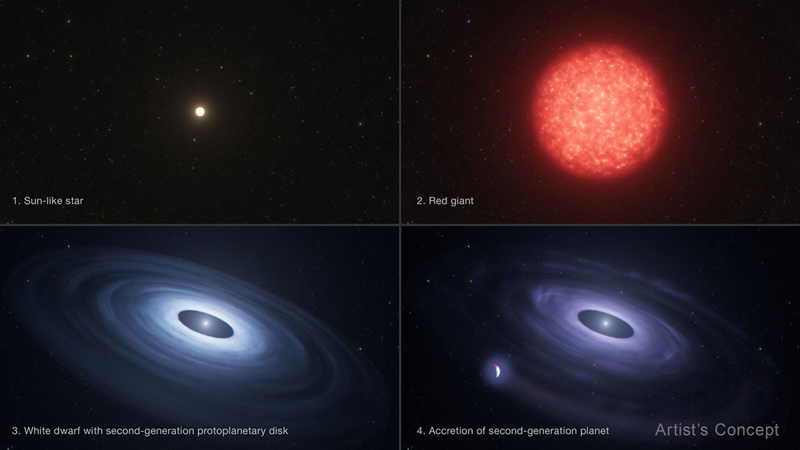
Four-quadrant illustration showing the evolutionary stages a Sun-like star goes through to produce a second-generation planet: Sun-like star, red giant, white dwarf with a second-generation protoplanetary disk, and a second-generation planet accreting onto the white dwarf. NASA/ESA/STScI artist concept.


A white dwarf 145 light-years from Earth has just given astronomers a problem they did not know they had. The star, catalogued as HS 0209+0832, was observed by Hubble in 1999 as part of a snapshot survey of stellar remnants. Twenty-six years later, a doctoral candidate at the University of Warwick pulled the same archival spectra out of the Hubble archive, ran roughly a hundred previously unidentified lines against an updated atomic database, and found that most of them were niobium, the element used in jewelry alloys and MRI superconducting magnets. The team’s conclusion, published Monday in Nature Astronomy, is that HS 0209+0832 may be hosting a planet that was not born with the star, but assembled afterwards from the chemically enriched debris the star itself shed when it died. Earth is a first-generation planet, made from the same disk of gas and dust that formed the Sun. The candidate around HS 0209+0832 would be something rarer: a second-generation world.

The NASA Hubble press release on the discovery frames the find as the first credible evidence that the white-dwarf stage of a star’s life is not an epilogue but a chapter that can produce new worlds, a result Phys.org reported on the same day. Lead author Jamie Williams put it more concretely: rather than the white-dwarf stage being a kind of final epilogue, the team’s result implies that what we have observed in old planetary systems so far is only the opening chapter of a much longer story, with new worlds potentially showing up to continue it. The conventional view of what happens after a Sun-like star loses its envelope has been that any close-in planets get engulfed during the red-giant phase, and any survivors settle into wider orbits as the white dwarf cools. Whether a fresh planet can condense out of the gas the dying star leaves behind has been mostly theoretical.

That theoretical picture has weight because the universe does not waste matter. A Sun-like star ends its life by inflating into a red giant, then blowing off its outer layers as a planetary nebula. The exposed core, made mostly of carbon and oxygen, is the white dwarf. The ejected envelope is rich in everything the star made during its lifetime, including elements heavier than iron. To find niobium in a white dwarf’s atmosphere in the quantities the Hubble data show requires that the white dwarf recently accreted material that was processed inside an evolved stellar interior, exactly the kind of material that would also be sitting in a debris disk around the white dwarf and available to form planets.

Williams and her co-authors, including Boris Gänsicke at Warwick and Nicholas Stone at the University of Wisconsin–Madison, did not start with a planet hypothesis. They started with a mystery spectrum. Hubble’s Cosmic Origins Spectrograph had been pointed at HS 0209+0832 in 1999, and the recorded spectrum contained roughly one hundred narrow absorption lines that did not match any known atomic transitions at the time. Williams ran the unidentified lines against modern atomic line lists and found that the largest single chunk were niobium transitions missing from the original reduction. The data were not new; the database was. The abundance implied by the absorption depth is several orders of magnitude above what the Sun’s photosphere shows, and niobium had not been reported in any other white dwarf analyzed to date. The most natural source is a body rich in heavy elements in a close orbit, shedding material that is being pulled onto the white dwarf.

Confirmation came from two independent places. The Far Ultraviolet Spectroscopic Explorer (FUSE), a NASA mission that operated from 1999 to 2007, also observed HS 0209+0832 and recorded strong niobium lines in its own bandpass. NASA’s Transiting Exoplanet Survey Satellite (TESS) spent four months staring at the white dwarf and detected a periodic brightness variation consistent with a planet orbiting at roughly 6 million kilometers, much closer to the white dwarf than Mercury is to the Sun. Putting the timing and the chemistry together, the team estimates the candidate is a gas giant roughly the size of Jupiter, on a tight orbit, currently being stripped of its outer atmosphere by the white dwarf’s intense radiation. The planet’s evaporating envelope should be feeding a comet-like tail of gas that spirals back onto the white dwarf.

The geometry matters. White dwarfs are small, about the size of Earth, with masses packed into a volume a million times smaller than the Sun. Anything that gets close enough to be tidally disrupted enters the Roche limit and is shredded into a disk. The HS 0209+0832 system appears to have exactly that configuration: a gas giant that has migrated close enough to lose mass, a debris disk of heavy-element-rich gas spiraling inward, and a white dwarf whose atmosphere records the chemistry of what is being added. Niobium at the observed level is not a chondritic signature. It points to material that has been processed inside an evolved star and then recondensed.

The team is careful with the claim. The TESS photometry is consistent with a planet, but a single four-month light curve does not exclude other explanations: rotating star spots can produce periodic brightness variations at the few-percent level. The Hubble spectrum is more robust. The niobium is there, in a quantity that requires an external source. The working hypothesis is that the source is a second-generation gas giant losing atmosphere onto a disk, and the team plans to keep monitoring HS 0209+0832 with Hubble and other facilities to nail down the orbit, the mass, and the composition of whatever is feeding the white dwarf. If the candidate holds up, it is the first direct evidence that planets can form from the debris of a dead star, opening a new population of objects to look for around the white dwarfs in the local galactic neighborhood.

Why this matters is that the universe has a long way to go after a Sun-like star dies. Roughly 97 percent of all stars in the Milky Way will end up as white dwarfs, and the galaxy is currently littered with several billion of them. At least a quarter show evidence of being polluted by surrounding debris, most of it attributed to the tidal disruption of rocky asteroids and the occasional comet. If even a small fraction of the polluted white dwarfs turn out to host second-generation planets, the number of objects in the galaxy that are technically “planets” goes up by an order of magnitude. Some of those planets will sit in the habitable zones of their white dwarfs, in stable thermal environments for billions of years, long after main-sequence stars like the Sun have gone through their red-giant phases. White-dwarf planets are an observational target with a candidate list that started, this week, with exactly one entry.

The Hubble Space Telescope has been operating for more than three decades, and the HS 0209+0832 result is a reminder that decades-old data still has surprises in it. The 1999 spectrum was not wrong; it was just unreadable at the time. The four-quadrant illustration NASA released with the paper walks through the four stages a Sun-like star has to go through to make a system like this: main-sequence, red giant, white dwarf with a second-generation protoplanetary disk, and finally the accretion of a second-generation planet. Each stage was known. Putting them in sequence, with a real system at the end of the chain, is the part that was missing.

The next paper from the team is likely to be a follow-up spectroscopic campaign on HS 0209+0832, looking for variability in the niobium line strength as the putative planet orbits and sheds mass in chunks. A measurable phase dependence, with niobium absorption deepening when the planet is between the white dwarf and the observer and shallowing when the planet is behind, would be the cleanest confirmation of the picture. Failing that, a direct imaging campaign with the James Webb Space Telescope at infrared wavelengths could pick up the thermal emission of the disk and the planet itself. Earth formed out of the leftover gas from the Sun’s birth. The next planet the field confirms, if the Williams result holds, will be the first that formed out of the leftover gas from a star’s death. The difference is a new population of worlds, sitting in plain sight in the Hubble archive, waiting to be read.