OrbitalHub

Where curiosity reaches escape velocity.

Domain is for sale. $50,000,000.00 USD. Direct any inquiries to contact@orbitalhub.com.

October 11, 2026

The Moon could anchor Earth’s GPS

Posted by


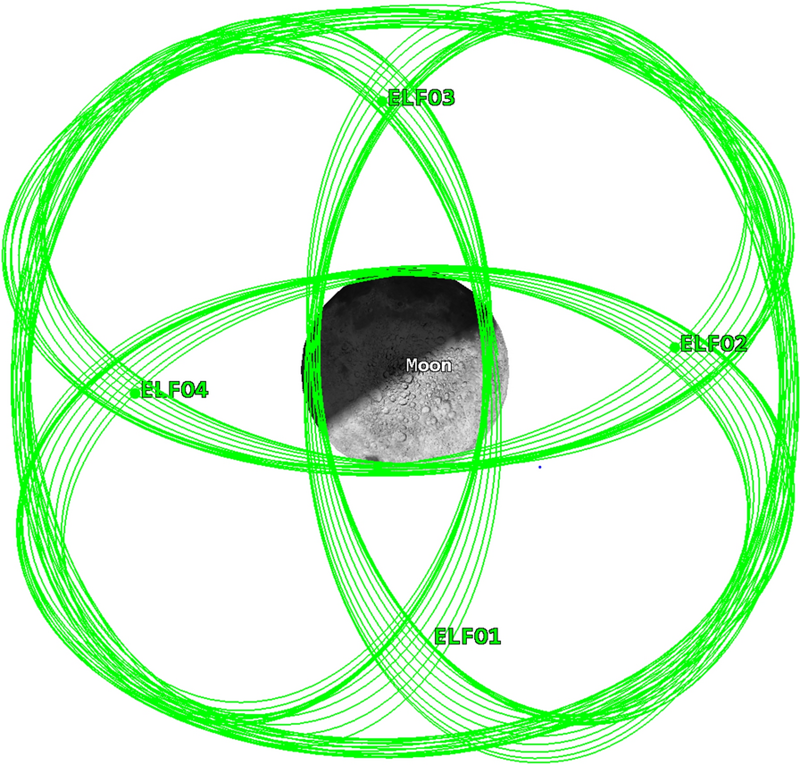
The proposed four-ELFO constellation around the Moon, with orbits labeled ELF01 through ELF04 in green, viewed from above the lunar north pole. The elongated ellipses are the Elliptical Lunar Frozen Orbits designed to provide continuous coverage of the lunar south pole while remaining stable with minimal station-keeping. Figure 4 from Lin et al. 2026 (https://link.springer.com/article/10.1186/s43020-026-00217-9/figures/4), reproduced under CC BY 4.0.


A constellation of navigation satellites can measure the distance between each member with centimeter accuracy and still, slowly, lose track of which way the whole network is pointing. That is the awkward truth at the heart of every Global Navigation Satellite System on Earth, and it is the puzzle researchers at Shanghai’s Microsatellites Engineering Center set out to solve on 17 September 2026 with a paper in Satellite Navigation, announced through EurekAlert. The lead authors were Xia Lin and Baojun Lin, two of the center’s senior engineers. Their answer was to extend the network 384,000 kilometers outward and let four satellites in elliptical orbits around the Moon serve as a gravitational anchor. The result, written up in the open-access journal under a CC BY 4.0 license, is the first end-to-end demonstration that real BeiDou-3 inter-satellite data, paired with simulated lunar cross-links, can keep an autonomous navigation system stable to within roughly 35 centimeters of User Range Error over 60 days, an order of magnitude better than the BeiDou-only baseline.

The reason a spaceborne navigation system needs an anchor at all is that inter-satellite ranging, the technique GPS pioneered in the 1990s and that every modern GNSS now uses to back up its ground stations, has a built-in symmetry problem. Each satellite measures its distance to its neighbors. Those measurements fix the relative geometry of the constellation with high precision, but they cannot distinguish one orientation of the whole network from another, because rotating the constellation rigidly in space leaves every inter-satellite distance exactly the same. Engineers call this property an orientational rank deficiency, and the symptom it produces is a slow rotational drift in the right ascension of the ascending node, the angle that defines where each orbital plane points in inertial space. Without ground-station updates, even a state-of-the-art autonomous system like BeiDou’s accumulates error at a rate of meters per month, which is why every GNSS operator still maintains an expensive global network of monitoring stations as a backup.

The Lin et al. solution exploits a simple geometric fact. A satellite in Earth orbit experiences the Earth’s gravity, which is nearly symmetric about the rotational axis. A satellite in a tight elliptical orbit around the Moon experiences the Moon’s gravity, which is not aligned with Earth’s axis at all. If the entire BeiDou-plus-lunar network were rotated incorrectly as a rigid body, the Earth-orbiting and Moon-orbiting members would no longer respond to their respective gravitational environments in the same way. Earth-Moon cross-links therefore carry information that Earth-only links cannot, and that information breaks the symmetry. The team quantified the change in a particularly clean way. They computed the condition number of the information matrix, a standard mathematical measure of how well-posed a least-squares problem is. For 24 BeiDou Medium Earth Orbit satellites alone, the condition number sat between roughly 10^15 and 10^18, the signature of a numerically singular system. Adding four simulated ELFO satellites dropped the condition number to about 10^2, a fourteen-orders-of-magnitude improvement that signals the symmetry has been fully broken.

The team’s experimental setup is unusually faithful for a navigation study, because half of it is real. They pulled actual on-orbit inter-satellite-link measurements from the operational BeiDou-3 MEO constellation, whose Ka-band TDMA cross-links can resolve ranges with noise floors near 10 centimeters, and combined those measurements with a simulated four-satellite constellation in Elliptical Lunar Frozen Orbits. The ELFO geometry, with four satellites in nearly identical, carefully chosen orbits arranged 90 degrees apart in node, is the same architecture that ESA’s Moonlight initiative and NASA’s LunaNet concept have independently converged on for lunar relay coverage, because ELFOs offer long dwell times over the south pole and remain stable with minimal station-keeping. The team used the well-characterized Sirbu et al. four-ELFO design and ran a 60-day simulation from October through December 2020, processing the BDS-3 data through a Kalman filter that jointly estimated the orbits of all 28 satellites along with clock offsets and Earth rotation parameters. The team also tested the architecture against an additional intermediate scenario in which the BeiDou satellites were allowed to use predicted orbit corrections on their own, an option that captures what an operator could realistically do for the first few weeks of a ground-station outage before the predicted-ephemeris quality decays.

Without any ground-station correction at all, the constellation in the unmitigated scenario drifted by about 7.85 meters of User Range Error after two months. Adding predicted orbital parameters as a partial constraint improved that to 0.6 meters. Adding the four ELFO cross-links dropped it to 0.35 meters, and the three-axis rotation bias was suppressed to 13.59, 10.27, and 4.04 milliarcseconds over the full 60 days. Crucially, the same cross-links help the lunar satellites, too: the four ELFO orbiters reached a maximum three-dimensional position error of 2.26 meters, with radial, along-track, and cross-track components below 0.16 m, 1.7 m, and 1.8 m respectively. The architecture is genuinely two-way. Earth-bound satellites help pin the Moon-bound satellites, and the Moon-bound satellites help pin the Earth-bound ones.

The reason this is more than a clean numerical result is that the cislunar navigation constellations ESA and NASA are actively planning to build for crewed lunar surface operations now have a second job description, as The Brighter Side of News explained in its coverage of the paper. ESA’s Moonlight and NASA’s LunaNet have both been framed primarily as services for south-pole landers, rovers, and astronauts, but if the Lin et al. result holds up in operational hardware, the same lunar relay satellites will quietly double as a stability anchor for the GNSS networks that every other piece of modern infrastructure depends on. A four-satellite lunar constellation costs a small fraction of a full ground-station refresh, and unlike ground stations it cannot be knocked out by a regional communications failure, a cyberattack, or a natural disaster.

Several caveats apply. The lunar portion of the experiment is a simulation, not flight data, and the joint condition-number analysis assumes the Earth-Moon cross-link can be timed to roughly the same precision as the existing BeiDou-3 Ka-band cross-links, which today is straightforward in principle but has not been demonstrated in hardware at 384,000-kilometer range. The 60-day window is also short for a real constellation; whether the drift suppression holds over years, through solar maximum, and across lunar eclipse seasons remains open. The Lin et al. paper is, in their own framing, a preliminary analysis, the first credible end-to-end case that the geometry works, not the last word. The team is appropriately careful about that. The next step that matters is a flight demonstration, likely as a hosted payload on one of the early Moonlight or LunaNet spacecraft, that closes an actual Earth-Moon cross-link and measures the rotational bias suppression directly. The result, when it comes, will tell us whether the 0.35-meter number survives contact with reality. If it does, the architecture of every future GNSS is going to have a footnote about the Moon.
 

October 10, 2026

A planet born from a dead star’s ashes

Posted by


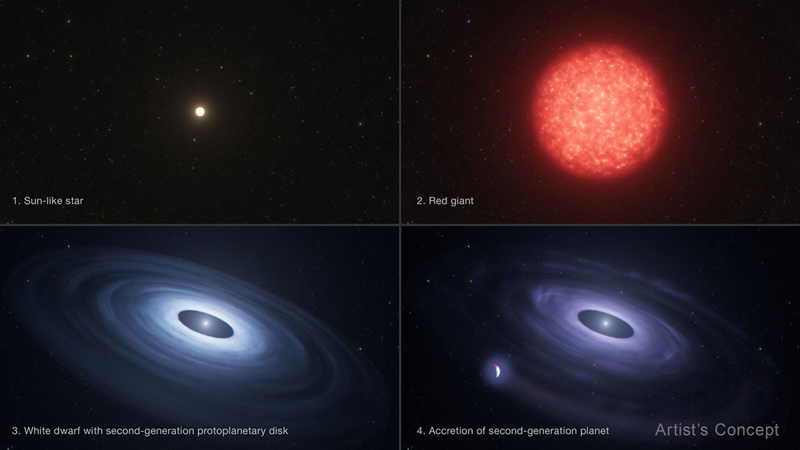
Four-quadrant illustration showing the evolutionary stages a Sun-like star goes through to produce a second-generation planet: Sun-like star, red giant, white dwarf with a second-generation protoplanetary disk, and a second-generation planet accreting onto the white dwarf. NASA/ESA/STScI artist concept.


A white dwarf 145 light-years from Earth has just given astronomers a problem they did not know they had. The star, catalogued as HS 0209+0832, was observed by Hubble in 1999 as part of a snapshot survey of stellar remnants. Twenty-six years later, a doctoral candidate at the University of Warwick pulled the same archival spectra out of the Hubble archive, ran roughly a hundred previously unidentified lines against an updated atomic database, and found that most of them were niobium, the element used in jewelry alloys and MRI superconducting magnets. The team’s conclusion, published Monday in Nature Astronomy, is that HS 0209+0832 may be hosting a planet that was not born with the star, but assembled afterwards from the chemically enriched debris the star itself shed when it died. Earth is a first-generation planet, made from the same disk of gas and dust that formed the Sun. The candidate around HS 0209+0832 would be something rarer: a second-generation world.

The NASA Hubble press release on the discovery frames the find as the first credible evidence that the white-dwarf stage of a star’s life is not an epilogue but a chapter that can produce new worlds, a result Phys.org reported on the same day. Lead author Jamie Williams put it more concretely: rather than the white-dwarf stage being a kind of final epilogue, the team’s result implies that what we have observed in old planetary systems so far is only the opening chapter of a much longer story, with new worlds potentially showing up to continue it. The conventional view of what happens after a Sun-like star loses its envelope has been that any close-in planets get engulfed during the red-giant phase, and any survivors settle into wider orbits as the white dwarf cools. Whether a fresh planet can condense out of the gas the dying star leaves behind has been mostly theoretical.

That theoretical picture has weight because the universe does not waste matter. A Sun-like star ends its life by inflating into a red giant, then blowing off its outer layers as a planetary nebula. The exposed core, made mostly of carbon and oxygen, is the white dwarf. The ejected envelope is rich in everything the star made during its lifetime, including elements heavier than iron. To find niobium in a white dwarf’s atmosphere in the quantities the Hubble data show requires that the white dwarf recently accreted material that was processed inside an evolved stellar interior, exactly the kind of material that would also be sitting in a debris disk around the white dwarf and available to form planets.

Williams and her co-authors, including Boris Gänsicke at Warwick and Nicholas Stone at the University of Wisconsin–Madison, did not start with a planet hypothesis. They started with a mystery spectrum. Hubble’s Cosmic Origins Spectrograph had been pointed at HS 0209+0832 in 1999, and the recorded spectrum contained roughly one hundred narrow absorption lines that did not match any known atomic transitions at the time. Williams ran the unidentified lines against modern atomic line lists and found that the largest single chunk were niobium transitions missing from the original reduction. The data were not new; the database was. The abundance implied by the absorption depth is several orders of magnitude above what the Sun’s photosphere shows, and niobium had not been reported in any other white dwarf analyzed to date. The most natural source is a body rich in heavy elements in a close orbit, shedding material that is being pulled onto the white dwarf.

Confirmation came from two independent places. The Far Ultraviolet Spectroscopic Explorer (FUSE), a NASA mission that operated from 1999 to 2007, also observed HS 0209+0832 and recorded strong niobium lines in its own bandpass. NASA’s Transiting Exoplanet Survey Satellite (TESS) spent four months staring at the white dwarf and detected a periodic brightness variation consistent with a planet orbiting at roughly 6 million kilometers, much closer to the white dwarf than Mercury is to the Sun. Putting the timing and the chemistry together, the team estimates the candidate is a gas giant roughly the size of Jupiter, on a tight orbit, currently being stripped of its outer atmosphere by the white dwarf’s intense radiation. The planet’s evaporating envelope should be feeding a comet-like tail of gas that spirals back onto the white dwarf.

The geometry matters. White dwarfs are small, about the size of Earth, with masses packed into a volume a million times smaller than the Sun. Anything that gets close enough to be tidally disrupted enters the Roche limit and is shredded into a disk. The HS 0209+0832 system appears to have exactly that configuration: a gas giant that has migrated close enough to lose mass, a debris disk of heavy-element-rich gas spiraling inward, and a white dwarf whose atmosphere records the chemistry of what is being added. Niobium at the observed level is not a chondritic signature. It points to material that has been processed inside an evolved star and then recondensed.

The team is careful with the claim. The TESS photometry is consistent with a planet, but a single four-month light curve does not exclude other explanations: rotating star spots can produce periodic brightness variations at the few-percent level. The Hubble spectrum is more robust. The niobium is there, in a quantity that requires an external source. The working hypothesis is that the source is a second-generation gas giant losing atmosphere onto a disk, and the team plans to keep monitoring HS 0209+0832 with Hubble and other facilities to nail down the orbit, the mass, and the composition of whatever is feeding the white dwarf. If the candidate holds up, it is the first direct evidence that planets can form from the debris of a dead star, opening a new population of objects to look for around the white dwarfs in the local galactic neighborhood.

Why this matters is that the universe has a long way to go after a Sun-like star dies. Roughly 97 percent of all stars in the Milky Way will end up as white dwarfs, and the galaxy is currently littered with several billion of them. At least a quarter show evidence of being polluted by surrounding debris, most of it attributed to the tidal disruption of rocky asteroids and the occasional comet. If even a small fraction of the polluted white dwarfs turn out to host second-generation planets, the number of objects in the galaxy that are technically “planets” goes up by an order of magnitude. Some of those planets will sit in the habitable zones of their white dwarfs, in stable thermal environments for billions of years, long after main-sequence stars like the Sun have gone through their red-giant phases. White-dwarf planets are an observational target with a candidate list that started, this week, with exactly one entry.

The Hubble Space Telescope has been operating for more than three decades, and the HS 0209+0832 result is a reminder that decades-old data still has surprises in it. The 1999 spectrum was not wrong; it was just unreadable at the time. The four-quadrant illustration NASA released with the paper walks through the four stages a Sun-like star has to go through to make a system like this: main-sequence, red giant, white dwarf with a second-generation protoplanetary disk, and finally the accretion of a second-generation planet. Each stage was known. Putting them in sequence, with a real system at the end of the chain, is the part that was missing.

The next paper from the team is likely to be a follow-up spectroscopic campaign on HS 0209+0832, looking for variability in the niobium line strength as the putative planet orbits and sheds mass in chunks. A measurable phase dependence, with niobium absorption deepening when the planet is between the white dwarf and the observer and shallowing when the planet is behind, would be the cleanest confirmation of the picture. Failing that, a direct imaging campaign with the James Webb Space Telescope at infrared wavelengths could pick up the thermal emission of the disk and the planet itself. Earth formed out of the leftover gas from the Sun’s birth. The next planet the field confirms, if the Williams result holds, will be the first that formed out of the leftover gas from a star’s death. The difference is a new population of worlds, sitting in plain sight in the Hubble archive, waiting to be read.


October 10, 2026

CHIME detects cosmic hydrogen on its own

Posted by


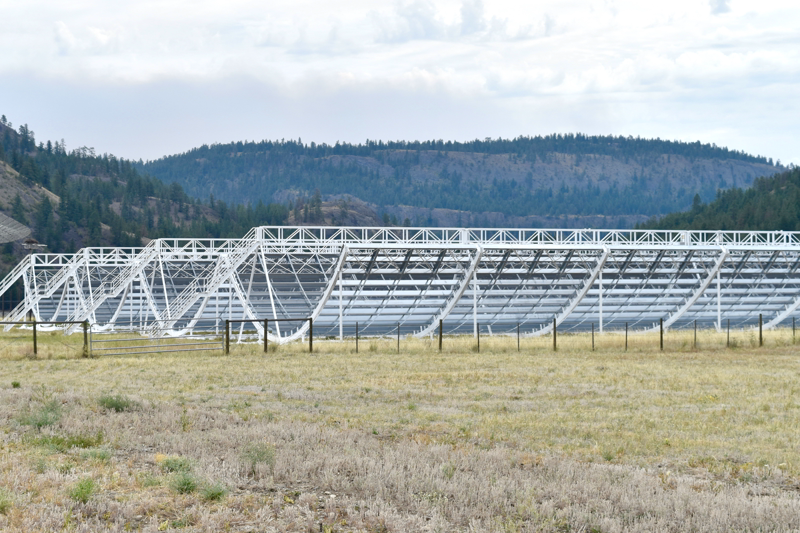
The CHIME telescope's four 100-metre wire-mesh cylindrical reflectors in an open field near Penticton, British Columbia, with forested hills behind. Image: Wikimedia Commons, CC BY-SA 4.0.


The Canadian Hydrogen Intensity Mapping Experiment, run out of a low-slung cluster of wire-mesh cylinders near Penticton, British Columbia, has just done something the rest of cosmology has been waiting on for the better part of two decades. In a paper published in The Astrophysical Journal on 28 September 2026 and posted to arXiv as 2511.19620, the CHIME Collaboration reports the first standalone detection of the cosmological 21-centimeter signal, the faint radio glow of neutral hydrogen from an era when the universe was roughly five billion years old. The result reached a signal-to-noise ratio of 12.5 across 94 nights of observing, a clean confirmation that intensity mapping can carry cosmological information without leaning on any other telescope.

The detection matters because it removes a crutch that earlier 21cm cosmology work could not do without. To pick a faint hydrogen signal out of the radio sky, every previous CHIME result had to be cross-correlated with an external galaxy or quasar catalog, so that any structure showing up in both maps could be trusted. That technique works, but it ties a hydrogen experiment to the schedule and depth of someone else’s survey. The new measurement is an auto-correlation, meaning the team trusted only CHIME’s own data and still recovered a statistically unambiguous clustering signal. Splitting the 608.2 to 707.8 megahertz frequency window in two yields independent detections at 8.7 and 9.2 sigma. Two independent confirmations in a single dataset is the kind of robustness that turns a hint into a measurement.

The reason this is exciting rather than merely incremental comes down to what intensity mapping is meant to do. Galaxy surveys like DESI, Euclid, and the Vera Rubin Observatory’s LSST build their maps by detecting and counting individual galaxies, a process that consumes enormous telescope time and tends to miss the dim, hydrogen-rich galaxies where most of the universe’s atoms actually live. CHIME does something different. Its four 100-metre cylindrical reflectors look at the whole northern sky every day, with no moving parts, and instead of resolving individual galaxies they sum the faint 21cm emission from millions of unresolved sources inside each patch of sky. The result is a low-resolution three-dimensional map of where the neutral hydrogen is, calibrated by redshift because cosmic expansion has stretched the original 21cm line into longer and longer wavelengths the further back in time one looks.

CHIME’s full operating band runs from 400 to 800 megahertz, which corresponds to redshifts between roughly 2.5 and 0.8, an epoch the collaboration describes as substantially younger than the one surrounding Earth today but old enough to capture the period when dark energy began to dominate the cosmic energy budget. The new paper uses only the cleaner half of that window, between 608.2 and 707.8 megahertz, which corresponds to redshifts of 1.34 down to 1.01, with a mean redshift of 1.16. That is exactly the slice where the universe had finished its early formative fireworks but had not yet been completely taken over by the accelerating expansion driven by dark energy.

Why this matters comes down to what the team can now attempt to do with the rest of the CHIME archive. The instrument has been collecting data continuously since first light in 2017 and the collaboration says it now has nearly seven years of observations in hand, most of which has not yet been analyzed. The Sept 28 paper uses 94 nights from 2019 only. If the new processing pipeline can keep extracting the auto-power spectrum cleanly from older data, CHIME should be able to push the measurement to higher redshifts, into the period when the universe was only about three billion years old, and to lower redshifts, where the dark-energy signal is strongest. That spans almost the entire window during which dark energy transitioned from negligible to dominant. Tracing the universe’s expansion history across that span, with a single instrument and a single tracer, is the prize the collaboration has been working toward since construction finished in 2017.

The first detection was a 2023 paper that cross-correlated CHIME’s hydrogen maps with optical galaxy and quasar catalogs from eBOSS. That cross-correlation approach was scientifically productive but also exposed. The hydrogen experiment needed a second, much larger optical survey to confirm any signal. The new result flips that around: CHIME is now the primary instrument, and any cross-correlation with another survey becomes an optional consistency check rather than a requirement. Co-author Dr. Mark Halpern, a University of British Columbia physicist and CHIME principal investigator, called the result a fundamentally new way of probing the cosmos, built on an instrument conceived, paid for, and operated entirely by Canadian institutions.

The technical work that made this possible is what most readers will not see and what most of the team spent the most time on. The 21cm cosmological signal at these frequencies is buried under several layers of brighter noise. Galactic synchrotron emission from our own Milky Way dominates by orders of magnitude. Distant radio galaxies and active galactic nuclei add another, structured layer on top. Human radio-frequency interference from satellites, radar, and cell towers adds a moving, partly unpredictable foreground. And small imperfections in CHIME’s receivers and correlator can mix otherwise smooth foreground signals into patterns that look like cosmological structure. Pulling the hydrogen out required the team to develop new radio-frequency interference detection algorithms, achromatic beamforming techniques that keep the telescope’s synthesized beam stable across frequency, and a foreground-filtering step that runs before time-averaging so that spectral leakage does not smear bright foregrounds into faint cosmological modes. Independent sub-band splits, null tests on the data, and many alternative processing choices were all checked before the team trusted the result, a process Chakraborty described as working very hard to convince ourselves that this was not a false alarm.

The team’s analysis goes one step beyond the headline detection. In a companion paper they take the auto-power spectrum at face value as a measurement of how strongly neutral hydrogen clusters at redshift 1.16, and they compare it with predictions from the IllustrisTNG cosmological simulations. The observed hydrogen clustering disagrees with the simulated clustering by about 3.1 standard deviations for the TNG100 simulation volume and 4.0 standard deviations for the larger TNG300. That is not a crisis. The team reads the gap between observation and simulation as a clue about how tightly hydrogen is packed at the small, non-linear scales the new measurement is most sensitive to, not as evidence that the total hydrogen inventory is wrong. It shows that CHIME’s standalone data can test models of how gas actually populates galaxies and dark-matter halos, not just deliver a number for dark-energy cosmology.

The long-term target is still baryon acoustic oscillations, the imprint of pressure waves from the hot early universe that act as a cosmic standard ruler. Tracking how that ruler stretches at different redshifts is one of the cleanest ways to measure how the universe’s expansion rate has changed over time, and therefore to test competing models for what dark energy is doing. The current measurement does not yet deliver BAO. Foreground-removal eliminates some of the largest-scale modes the BAO analysis needs, and the detected power spectrum occupies smaller non-linear scales where gravitational clustering has already scrambled the clean linear signal. What the Sept 28 paper establishes is the prerequisite: a telescope designed to map the universe through hydrogen can isolate that hydrogen without another survey pointing out where to look. The next step is to apply that capability across more of the CHIME archive and across the wider redshift range the telescope was built for.

For a community that has spent more than a decade waiting for a 21cm cosmology result that does not need a galaxy survey attached, the message from the Okanagan Valley this week is that the wait is over, and the next decade of dark-energy measurements just got a new instrument.


October 10, 2026

Falcon Heavy flies its first NRO mission

Posted by


A Falcon Heavy rocket climbs off Launch Complex 39A at night, its 27-engine plume glowing bright orange against the dark Florida sky and reflecting off the water beside the pad.


A Falcon Heavy lifted off from Launch Complex 39A at NASA’s Kennedy Space Center at 11:54 p.m. EDT on Thursday, October 1, 2026 (0354 UTC on October 2), carrying the NROL-97 mission into orbit for the National Reconnaissance Office, the U.S. agency that builds and operates the country’s spy satellites. It was the first time the NRO has flown a payload on Falcon Heavy rather than on a single-stick Falcon 9, and it was the first national-security mission procured under the National Security Space Launch Phase 3 Lane 2 contract that the U.S. Space Force awarded in 2025.

The mission was the third SpaceX launch in a thirteen-hour stretch that also saw a Falcon 9 carry the Crew-13 astronauts to the International Space Station from the Cape at 11:10 a.m. ET and another Falcon 9 send 130 smallsat payloads into sun-synchronous orbit on the Transporter-18 rideshare from Vandenberg at 11:32 a.m. PT, per Spaceflight Now’s launch report. The triple-header ended with four booster landings inside a single calendar, the first time SpaceX has brought that many first stages back in twenty-four hours.

Falcon Heavy is the three-booster variant of the Falcon 9: a single core stage flanked by two strap-on boosters that are themselves flight-proven Falcon 9 first stages. Twenty-seven Merlin 1D engines fire at liftoff, producing roughly 22,800 kilonewtons of thrust, and the side boosters separate from the core about two and a quarter minutes into flight before flipping, boosting back toward Cape Canaveral, and returning to land. The Heavy flew for the first time in February 2018, made its second flight in April 2019 carrying the Arabsat-6A satellite, and reached its fourteenth flight on the NROL-97 mission, according to the SpaceX official NROL-97 mission page and the launch archive.

The two side boosters that flew NROL-97 had both flown before. The NRO mission reused them just a month after their last flight, which lofted NASA’s Nancy Grace Roman Space Telescope to L2 in early September 2026. B1104 made its second flight and B1072 its fourth. The new core stage, B1106, was brand new and was expended on the NROL-97 mission; the trajectory required the core to do a disposal burn that did not bring it back to a landing site. After stage separation, the side boosters made their way back. Both returned to Landing Zones 1 and 2 at Cape Canaveral Space Force Station, and the landings produced the audible sonic booms that anyone in central Florida heard three minutes before midnight local time. SpaceX had returned LZ-1 to service for this mission after that pad had been replaced for a stretch of LZs at Space Launch Complex 40, and the SLC-40 landing pad was used earlier in the day by the booster returning from the Crew-13 mission.

Little about the payload itself is public, which is the standard posture for NRO missions. The NRO rarely publishes technical details beyond launch and landing confirmations, and the live SpaceX broadcast carried only the standard hazard area and trajectory notes. It was the first NRO mission to launch under the new procurement structure the agency adopted. The agency bought the launch in 2025 through the competitive NSSL Phase 3 Lane 2 process, and that contract structure is the mechanism the U.S. Space Force uses to buy launches for the majority of its national-security payloads. Lane 2 covers the medium-to-heavy class of missions for which Falcon Heavy is now the baseline ride. ULA’s Vulcan rocket and Blue Origin’s New Glenn are the other Lane 2 providers, and the contract split is the reason Falcon Heavy (rather than first-class Vulcan) flew this payload.

The payload fairing had flown before as well. SpaceX and the NRO confirmed the fairing was previously used on the NROL-95 mission in July, another example of the steady refurbishment and reuse pattern that SpaceX has applied across the Falcon 9 fleet and is now extending into the more delicate fairing hardware. The cost model on a mission like NROL-97 is unusual for the agency context, because the contract is fixed-price rather than cost-plus: the U.S. Space Force’s published Lane 2 task order values run into the hundreds of millions of dollars per mission, with Falcon Heavy missions priced in the $97 million range per the NextSpaceflight launch entry, although the actual NRO contract value has not been disclosed for NROL-97 specifically. The economic argument for the NRO in choosing Falcon Heavy over the alternatives is the standard one in the launch market right now: it is the cheapest heavy-lift rocket that already has a flight history, and the side boosters are reused flight-proven hardware that has already amortized its development cost.

The mission is the third Falcon Heavy launch of 2026, which is shaping up to be a relatively slow year for the rocket compared to 2024 and 2025, both of which saw the vehicle fly close to a head-to-head cadence with the rest of the Falcon fleet. The pace has been limited by payload availability more than by launch capability; the heavy-lift market is dominated by geostationary communications satellites, NASA flagship missions like Roman and Europa Clipper, and a small number of national-security payloads, and there are simply not that many of those missions in any given year. Looking at SpaceX’s published manifest for the rest of 2026 and the early months of 2027, the company has only a couple more Falcon Heavy launches booked in that window [unverified], which would put the rocket on track for one of its quietest years since 2021 so far. The NROL-97 mission is the kind of flight Falcon Heavy exists to handle, and the fact that it was the NRO’s first choice of the rocket suggests that 2027 and 2028 will see the cadence pick up further as the Lane 2 contract awardees ramp their flight rates.

The triple-header that ended with NROL-97 also gave SpaceX a small operational benchmark. Three Falcon-family launches inside thirteen hours, four booster recoveries, two different launch complexes (SLC-40 for Crew-13, LC-39A for NROL-97, and SLC-4E at Vandenberg for Transporter-18), and three different mission profiles (crewed, rideshare, classified heavy-lift), per the Space.com launch report. It was the operational shape of the Falcon program in late 2026, and it was the first NROL mission ever to ride on a Heavy rocket. The next national-security mission on the manifest is likely to be a Lane 1 contract (meaning a Vulcan or a National Rocket), unless the Space Force decides to push more Lane 2 weight onto Falcon Heavy next year. That decision will tell us whether NROL-97 was a one-off or a real sign of the future for the agency’s Falcon Heavy launcher.


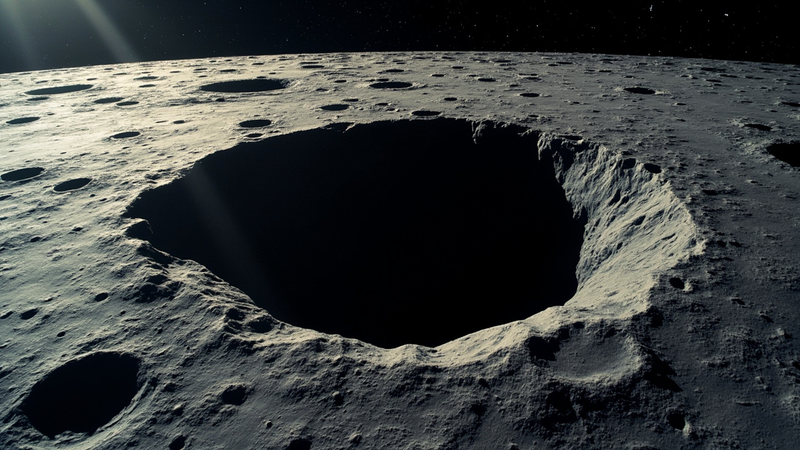
A high-resolution visualization of the Marius Hills Pit, a roughly 50-meter skylight in Oceanus Procellarum, showing the dark circular opening casting a deep shadow onto the surrounding mare plain.


There is a hole on the Moon that has not stopped nagging planetary scientists since they first noticed it. The Marius Hills Pit sits in Oceanus Procellarum, the largest of the lunar maria, in a region already famous for holding the densest collection of volcanic features anywhere on the surface. Lunar Reconnaissance Orbiter images show an opening roughly 50 meters across and somewhere between 30 and 40 meters deep, the floor lost in permanent shadow, the walls exposing layers of basalt that no other spot on the Moon leaves so conveniently within reach. JAXA’s SELENE (Kaguya) spacecraft photographed it in 2009. NASA released the highest-resolution LROC view in 2010. The European Space Agency published its own montage the same decade. And for sixteen years the question has been the same: does the pit lead down into a tube, or is it just a hole?

On October 1, 2026, NASA picked a team to find out (NASA, October 2 2026). The project is called GIMLI — Geophysical Instruments for Marius Lunar pit Investigation — and it will be led by Nathaniel Putzig of the Planetary Science Institute. Honeybee Robotics, the Blue Origin-owned outfit that built the legs for Mars 2020 and the Sample Retrieval Lander arms, will provide the instruments and the project management. The Norwegian Space Agency is contributing the ground-penetrating radar. Co-investigators are spread across Boise State, Johns Hopkins, the Lunar and Planetary Institute, and the University of Oslo. The payload will fly to the surface through NASA’s Commercial Lunar Payload Services (CLPS) initiative under the agency’s Payloads and Research Investigations on the Surface of the Moon (PRISM) program.

What makes GIMLI unusual is the combination. Three independent geophysical methods will be aimed at the same target from the same lander. A ground-penetrating radar will send electromagnetic pulses into the regolith and time their echoes. A gravimeter will measure the local gravity field to a precision high enough to register the slight pull deficit left by an underground void. And a third system — the one Putzig has been waiting to fly for most of his career — will do active-source seismology, the deliberate thumping of the ground with a small explosive or impact source and the recording of how the resulting acoustic wave bounces back. That last technique has not been run on the Moon since Apollo 17 in December 1972 (TechTimes, October 2 2026).

The reason anyone cares whether the tube exists is not the geology. It is the architecture. A lunar day lasts 29.5 Earth days, and the surface temperature swings between roughly +120 and -170 degrees Celsius. Galactic cosmic rays and solar energetic particles deliver the equivalent of a chest x-ray every few seconds to anything exposed. Micrometeoroids the size of sand grains arrive at 70 km/s. A long lava tube, by contrast, holds a near-constant temperature near −20 °C in its interior and provides a meter or more of rock overhead — natural radiation and impact shielding that no inflatable habitat can match. If the Marius Hills Pit really does open into a tube big enough to walk through, the engineering problem of where to put the first permanent lunar base gets substantially easier.

The orbital evidence is already strong. Kaku and colleagues, working with the 4–6 MHz echoes from SELENE’s Lunar Radar Sounder, reported in 2017 a candidate tube roof around 120 meters below the surface near the Marius Hills skylight (Kaku et al., LPSC 2017 abstract 1711). Separately, Chappaz et al. used gravity-gradient data from NASA’s Gravity Recovery and Interior Laboratory (GRAIL) mission to flag a Bouguer anomaly consistent with a low-density void several kilometers east of the pit. Both results are suggestive, not conclusive — orbital radar and gravity can detect a void only in aggregate, with poor horizontal resolution and a strong dependence on what the surrounding rock happens to look like. The case for a usable tube is the kind of question that has to be answered from the surface, with instruments whose geometry is known to within a meter.

Active-source seismology is well suited to that geometry. The classic field setup is two parts: a source — Apollo 17 used a crew-deployed thumper that fired small explosive charges — and a string of geophones that record the wave’s arrival times. The wave’s group velocity depends on the elastic moduli of the material it traverses, and any sharp acoustic-impedance contrast — a void, a frozen-melt boundary, a regolith–bedrock contact — produces a reflection. By shooting from several known source positions and recording on a known array, you can triangulate the depth and shape of the reflector. The technique is what oil and gas geophysicists have used for a century to map the geometry of reservoirs, and it is the same mathematics that Putzig’s team will apply to a 50-meter hole in a mare basalt. The gravimeter is a complement: a void produces a small but measurable decrease in local gravity that a sensitive instrument can isolate, especially when the GPR has already constrained the depth.

The engineering is also a return to first principles. The Apollo 17 Lunar Surface Gravimeter ran from December 1972 to September 1977 and yielded, among other things, the catalog of deep and shallow moonquakes that has been reanalyzed ever since. Modern seismometers are an order of magnitude more sensitive, and modern electronics can run for the multi-day acquisition window the GIMLI survey needs. Honeybee Robotics has not yet published the source design, but the options are well understood: a small explosive launcher, a drop-mass impactor, or a vibroseis-style swept-frequency shaker. Any of the three produces a repeatable signal in the tens-of-hertz band that a 4.5-billion-year-old lava tube would reflect cleanly.

The other thing the survey can do, regardless of whether the tube is there, is tell the volcanic history of the region. The walls of the Marius Hills Pit expose lava-flow stratigraphy that elsewhere on the Moon is buried under hundreds of meters of younger mare basalt. Imaging those layers, and dating the contacts between them, would let geologists read the time sequence of eruptions across one of the Moon’s most prolific volcanic provinces. Even a null result — proof that the pit is just a collapse feature with no associated tube — would be a useful constraint on lava-flow cooling models.

The CLPS lander carrying GIMLI has not been announced, and the launch is likely two to three years away. But the science is already constrained, the team is in place, and the radar-and-seismology combination has not been tried at this scale on another world. When those instruments reach the rim of a 50-meter hole in Oceanus Procellarum, the question the SELENE and GRAIL teams opened in 2017 will finally be settled. Either the Moon has a usable shelter waiting in the Marius Hills, or it does not. Either way, the next twenty years of lunar architecture just got a fact to plan around.


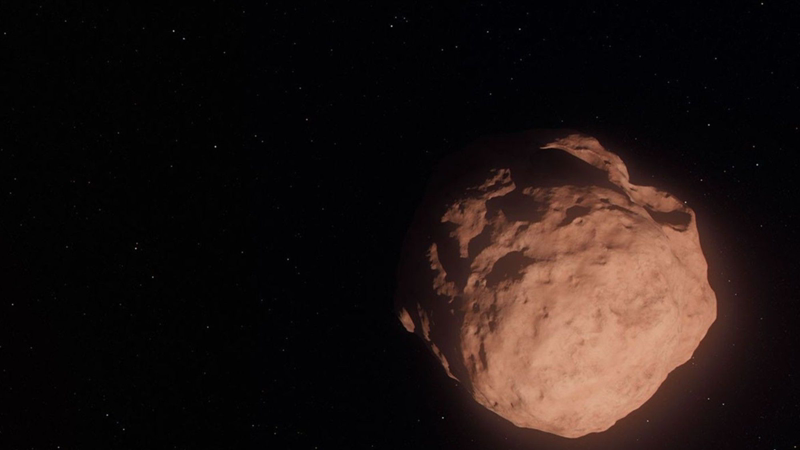
An illustration of a Trans-Neptunian Object: a small, faint, icy body orbiting the sun beyond the orbit of Neptune, shown as a single lumpy brown rock against a starless black background.

Image credit: NASA, ESA, Leah Hustak (STScI). The illustration is from the official NASA/ESA news materials accompanying the September 2026 announcement of the 27 new TNOs.


The Hubble and James Webb space telescopes have spent most of their careers looking out, at distant galaxies and the early universe. A new survey turned them around to look back home, and in the process turned up 27 new Trans-Neptunian Objects, all of them so small and so distant that they are still bearing the chemistry of the solar system’s earliest planetesimals.

These TNOs are between 6 and 25 miles across, with the smallest only about 6 miles (10 kilometers) in diameter. They sit between the cold classical Kuiper Belt and the dynamically hot Scattered Disk, and the survey is the deepest look yet into the region beyond Neptune. As such, the work is the first census with enough sensitivity to compare the smallest TNOs to their larger siblings, which is the comparison that lets you say something about how the solar system formed.

A TNO is a small icy body that orbits the sun beyond Neptune. The classical ones sit on near-circular orbits level with the ecliptic plane and are dynamically cold, meaning they have not moved much since they formed. The hot ones have been kicked there from closer in, mostly by gravitational resonances with the giant planets while those planets were still growing. They ended up on highly elongated orbits well off the ecliptic. Most of the 27 new objects are classical cold TNOs, with a smaller number from the scattered disk.

How cold are these cold TNOs, exactly? The new survey found them at apparent magnitudes between 24.1 and 29.3, putting them at the very edge of what either telescope can detect. Reaching reliable sizes for objects this faint required combining both observatories’ strengths: Hubble’s deep visible-light imaging to find the candidates, and JWST’s infrared vision to size them, because at infrared wavelengths a body’s brightness reflects its actual size rather than its albedo, the way visible-light brightness does.

The work was led by two PhD candidates, Anastasia Morgan of Northern Arizona University, who led the color and composition analysis, and Marielle Eduardo of the University of Victoria, who led the size distribution. They were part of a larger team that also included David Trilling, also of NAU. The size work was the headline: Eduardo was able to derive the diameters of the 27 TNOs from their infrared brightnesses, and the resulting size distribution was the first surprise.

Models of planetesimal formation predict a steep size distribution: many small objects and a few large ones. When Eduardo plotted the inferred sizes of the 27 TNOs, she found they followed the same shape distribution as larger TNOs. That was not the surprise. The surprise was that the slope of the size distribution was shallower than models predicted at the very smallest sizes, meaning there are fewer really tiny TNOs out there than the models would predict. Either planetesimal formation is more efficient at small sizes than the models say, or the smallest objects get eaten or ejected by something the models don’t include.

Models of how the solar system has churned through 4.5 billion years of collisions predict that small TNOs should be heavily gardened by impacts, their surface composition thoroughly mixed up and homogenized. The 27 objects should look quite different on their surfaces from their larger siblings, the way a heavily cratered asteroid looks different from a freshly fallen meteorite. But the colors of these small TNOs look just as pristine as those of larger ones, the same red-or-gray surface colors they have had since the dawn of the solar system.

Morgan, who led the color and composition analysis, said in a statement that the team’s expectation was that impacts would have erased whatever the objects’ original chemistry was. The fact that the smallest objects still preserve that chemistry is, she said, the kind of result that changes how astronomers think about the history of the outer solar system.

This same chemistry preservation holds even for the dynamically hot TNOs that originated between Uranus and Neptune before being thrown into the scattered disk by resonances with the growing giant planets. Trilling, who led the analysis on the hot-population side, said the data show the hot TNOs retain a chemical signature of where they were born, even though their orbits have been scrambled since then. Whatever preserved the cold TNOs’ surfaces preserved the hot ones’ too.

There are two ways to read this. The simpler one is that there are far fewer collisions out there than the population-density models predict, which would require a real rethink of how dense the outer solar system actually is. The more interesting one is that collisions do happen but somehow don’t tear up the surface of these objects as much as expected, perhaps because the impactors are too small to do real damage, or because the surfaces are unusually cohesive for some reason.

This is not the first time small-body surface chemistry has been unexpectedly hard to perturb. The OSIRIS-REx samples from Bennu, returned to Earth in 2023, showed that rubble-pile asteroids also remember their formation conditions far better than cratering models would predict, suggesting the same pattern holds closer to home as well as at the edge.

The deeper point is that the chemistry of the early solar system is more durable than the textbooks say. Across the size spectrum, from rubble-pile asteroids a few hundred meters across to planetesimals tens of kilometers across, the surfaces are carrying the chemistry they had when they formed 4.5 billion years ago. This makes them uniquely valuable as time capsules.

What the new survey is really telling us is that the small end of the solar system is far less weathered than we thought. The TNOs were supposed to be the battered outer suburbs of the solar system, places where collisions are common and mixing is complete. The opposite is true. They are more like a museum than a battlefield, with each object preserving a record of where and how it was made.

The team plans to expand the survey with additional JWST observations in the next year, both to find more small TNOs and to characterize the larger ones in more detail. The combination of two flagship observatories working together has turned what was once a search at the limits of detectability into a routine observation program, and the next decade is likely to see hundreds more small TNOs characterized this way.

For now, the message is clear: the smallest, most distant objects in the solar system are quietly holding onto chemistry from before the planets finished forming, and they are going to keep doing it for billions of years more.