OrbitalHub

Where curiosity reaches escape velocity.

Domain is for sale. $50,000,000.00 USD. Direct any inquiries to contact@orbitalhub.com.


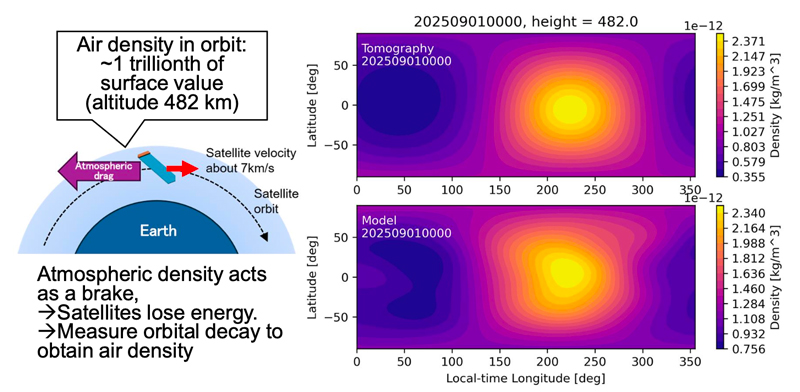
A two-panel world map showing thermospheric density reconstructed from Starlink orbital decay at 482 km altitude on 1 September 2025 (top) compared with a reference model (bottom), with a schematic on the left showing how atmospheric drag decelerates a satellite in orbit.


For decades the thermosphere, the broad band of electrically neutral gas that sits between roughly 100 and 1,000 km above the ground, has been one of the most expensive places on Earth to study. A handful of in-situ instruments on satellites like ESA’s SWARM constellation have nibbled at it one orbit at a time. Atmospheric models fill the gaps, but with rising space traffic the gaps have grown political: collision avoidance, reentry forecasting, and space-weather alerts all need accurate thermospheric density on short timescales, and the measurements feeding those models are sparse. A team at Kyoto University has now shown that the same orbital data SpaceX publishes for free to coordinate its Starlink constellation can be turned into a continent-scale thermospheric density snapshot, using a method borrowed from medical imaging. The result, published 30 July 2026 in Earth, Planets and Space, is the first latitude-by-longitude map of thermospheric density reconstructed entirely from the orbital decay of commercial broadband satellites.

The thermosphere matters because every spacecraft in low Earth orbit lives inside it. Even at 500 km altitude the gas is thin enough that an astronaut on an EVA suit would consider it vacuum, but it is dense enough that a 250-kilogram satellite experiences a steady, measurable aerodynamic drag. That drag pulls satellites down, which is why the International Space Station and thousands of debris fragments eventually reenter. It is also why precise orbit prediction is so hard: a small change in thermospheric density can shave minutes off a predicted pass, and during a geomagnetic storm a single high-speed plasma plume from the Sun can change density at satellite altitude by a factor of two in less than an hour.

The economic stakes have grown with Starlink, OneWeb, Kuiper, and the Chinese Guowang constellation. As of mid-2026 there are roughly 9,000 active satellites in low Earth orbit, with another 50,000 pieces of tracked debris larger than 10 cm. Every collision risk assessment, every conjunction warning, every debris-reentry prediction depends on knowing how dense the air is along each object’s path. Today, most operational systems rely on either accelerometer data from a few sentinel satellites or on empirical density models calibrated against historical storms, which means they tend to miss local structure in the thermosphere: the day-night asymmetry, the geomagnetic-latitude bite, the traveling atmospheric disturbances that follow a sunrise terminator around the globe.

A method that turns routine commercial satellite tracking into a near-real-time thermospheric density map would change that. It would also change what counts as “ground truth” for the physics of the upper atmosphere: the same data set that lets SpaceX coordinate its own orbital slot allocation could now be re-used by every atmospheric scientist with a Python notebook and access to a public ephemeris feed.

The Kyoto University group, led by space engineer Mamoru Yamamoto with first author Takuya Sori, had already pushed in this direction. In an earlier paper they showed that they could estimate how thermospheric density varies over time and altitude using public Two-Line Element (TLE) data, the short text records that amateur satellite trackers use to find the ISS. The technique was time-honored: a satellite in a decaying orbit loses energy at a rate set by the local air density, so inverting the decay curve gives density as a function of height and time.

The 2026 paper takes the next step. Instead of treating each satellite as a single measurement, the team treated the constellation as a moving grid of sensors. For roughly 1,200 Starlink satellites at an altitude of 482 km, they calculated orbital energy loss from publicly broadcast ephemeris messages over a chosen interval and fed the resulting drag estimates into a tomographic inversion. Tomography, the same family of math that turns a CT scanner’s one-dimensional projections into a 3-D image, is good at reconstructing a 2-D field from many intersecting 1-D lines. Here the lines are satellite ground tracks across the globe.

The reconstruction, anchored on a single day of data from 1 September 2025, produced a full two-dimensional density map of the thermosphere at roughly 500 km altitude, with peaks over the sunlit mid-latitudes and lower density on the night side. When the Kyoto team compared their tomographic result against density profiles recorded along their tracks by the European Space Agency’s SWARM satellites, the agreement was within the noise floor of the comparison: both showed the same high-density lobes over the daytime side of the Earth, and the same minima near the dawn terminator.

The work, formally titled “Tomography of thermospheric density from Starlink Ephemeris: initial report”, appeared in Earth, Planets and Space on 30 July 2026. Kyoto University’s research news office published a press release on 4 August, and the result was picked up across space and Earth-science outlets including ScienceDaily and Phys.org. A KURENAI repository copy is available without paywall.

The “ephemeris” in the new paper is not the same thing as a TLE. A TLE is a compact orbital state vector published by the U.S. Space Force’s Space-Track catalog; it is good to roughly a kilometer of position accuracy and is updated a few times a day. SpaceX publishes a higher-precision ephemeris for each Starlink satellite, broadcast continuously over the same radio link the satellites use for internet traffic, which includes predicted position and velocity to a fraction of a meter. It is the kind of data that, until now, was treated as operational infrastructure rather than science data.

Drag at 482 km is dominated by collisions with atomic oxygen, the dominant species in the upper thermosphere. The momentum transfer rate per unit density for a satellite at typical Starlink ballistic coefficients has been measured in orbit many times; the Kyoto team leans on those calibrations rather than computing from first principles. The bigger problem is geometry. A single satellite samples density along a single line on the globe. To reconstruct a 2-D field you need many satellites crossing many different latitudes and local solar times in the same interval. With about 1,200 Starlinks in a near-polar orbit that circles the Earth every 90 minutes or so, the constellation completed more than a hundred full ground tracks during the chosen 24-hour window, which is enough to populate every 5-degree latitude-longitude cell at least a few times.

The “tomographic inversion” itself is a weighted least-squares fit with a smoothness prior. Weights come from each satellite’s expected drag uncertainty (a function of mass, frontal area, and atmospheric composition model), and the smoothness prior prevents the optimizer from inventing small-scale structure the data cannot resolve. The output is a single snapshot, not a movie. A time series would need the inversion repeated on a rolling window.

Independent validation mattered. The European Space Agency’s SWARM mission, launched in 2013, has been measuring thermospheric density along its three orbital tracks for over a decade. SWARM reads a non-gravitational acceleration directly with an onboard accelerometer, which is the gold standard for in-situ density measurements. On 1 September 2025 SWARM’s tracks happened to fall inside the latitude-longitude cells the Kyoto inversion had populated. The two density fields agreed at the level expected from SWARM’s own noise floor, plus some extra uncertainty the Kyoto team acknowledged from their assumption that every Starlink satellite has the same effective ballistic coefficient.

The remaining bottleneck is uniform ballistic coefficient. Real Starlinks vary slightly in mass and orientation, and not all of them have their ephemeris precision documented publicly. The Kyoto group flags this as the next refinement to chase.

Three numbers summarize the work: 1,200 satellites, 482 km altitude, one day of data. Together they describe the smallest possible demonstration that a global commercial broadband network can be repurposed into a free, passive, science-grade sensor for the upper atmosphere.

A near-real-time implementation would need only an automatic ephemeris ingestion pipeline and a routine inversion, something the team has indicated they are working on. If such a pipeline goes operational, atmospheric modelers will have far more ground truth on the quiet-day thermosphere than they have today, and the same data will feed directly into space-weather products that already serve satellite operators.

For now the result is a proof of concept: enough to show it works on one day, not yet a system that rewires upper-atmosphere science.
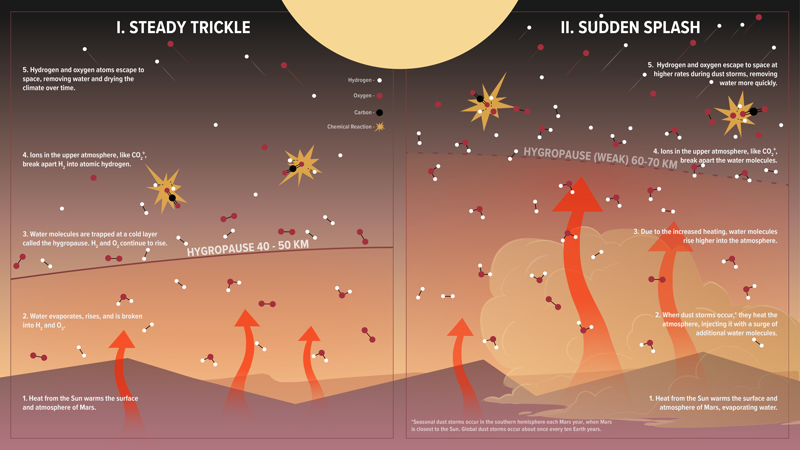


NASA Scientific Visualization Studio infographic showing two side-by-side cross sections of the lower Martian atmosphere, labeled "I. Steady Trickle" and "II. Sudden Splash," comparing normal water loss against the elevated water loss during a global dust storm


Lana Williams, a PhD researcher at Lancaster University, took the stage at the Royal Astronomical Society’s National Astronomy Meeting in Birmingham on July 21 with a result that nobody had set out to find. Her team had been doing a routine comparison: does a solar energetic particle (SEP) event (a pulse of high-energy protons and ions flung out by a solar flare or coronal mass ejection) change the temperature of Mars’ lower atmosphere? Of the five long-duration SEP events the team examined, four showed nothing. The fifth, which arrived while the 2018 planet-encircling dust storm was still expanding, showed a measured warming of roughly 50 °C (about 90 °F) at altitudes of 75 to 125 km. That is a large signal in atmospheric physics, and it appeared in the one event of five where Mars’ surface was already being scoured by a global dust storm (Royal Astronomical Society press release; Phys.org coverage).

The team used two complementary spacecraft that are normally thought of as studying different altitudes. NASA’s Mars Atmosphere and Volatile EvolutioN (MAVEN) orbiter, which has been watching the Sun-Mars interaction since 2014, contributed observations of how the incoming particles deposited their energy in the upper atmosphere. ESA and Roscosmos’ ExoMars Trace Gas Orbiter (TGO), in operation since October 2016, contributed the simultaneous thermal profile of the middle and lower atmosphere. By stacking the two datasets against the Mars Climate Database, the team could see whether observed temperatures diverged from the climatological mean (Sci.News).

Mars is not a protected planet. With no global magnetic field, its upper atmosphere takes the solar wind and SEP events head-on, and the planet’s atmospheric escape rate has been one of the long-running questions in comparative planetology. A radiation-driven temperature pulse in the lower atmosphere is a different kind of signal than the better-studied escape of hydrogen and oxygen from the top of the atmosphere. It means energy deposited above is being communicated downward into the region where dust, clouds, and weather live, and the existing models of that region do not necessarily assume such a connection.

If the pattern holds, the result has practical consequences. Dust storms are the worst time to be operating solar-powered equipment on the surface, and they already coincide with the kind of optical depth that ends rover missions, the 2018 storm being the one that finally silenced Opportunity. Adding a SEP-driven heating pulse on top of an already-stressed atmosphere changes the radiation environment and the upper-tropospheric temperature profile, with consequences for any future crew or uncrewed habitat. The work also offers a partial answer to a question that has been quietly bothering Mars atmospheric scientists: the models did not always match the 2018 TGO temperature record as well as one would like, and a SEP component may explain some of that residual.

Williams and collaborators at the University of Leicester and the Instituto de Astrofísica de Andalucía–CSIC in Granada selected five SEP events spread across the period when MAVEN and TGO were both returning science data. The event selection was the careful part: the team required each SEP to be long-duration, so that any thermal response would have time to propagate, and required both spacecraft to be making compatible observations at the same time. The first four events, occurring in quieter atmospheric conditions, did not produce a statistically meaningful divergence from the Mars Climate Database’s predicted temperature profile. In the team’s own words, “we expected that these highly energetic particles might have some effect on temperatures in Mars’ lower atmosphere, but in four of the five events we studied we found no clear evidence of heating.” The fifth, in June 2018, broke the pattern by a wide margin (Royal Astronomical Society press release; Tech Times).

The June 2018 event is the storm that ended Opportunity’s mission. NASA formally declared the rover’s end in February 2019 after more than a thousand recovery commands went unanswered, and the global dust storm that began on May 30, 2018 grew into a planet-encircling event by mid-June, with optical depths in some regions reaching tau values of 5 to 10, enough to blot out direct sunlight at the surface (2018 Mars global dust storm, Wikipedia; Space.com retrospective). It is also the same storm during which MAVEN’s Neutral Gas and Ion Mass Spectrometer measured water vapor 20 times higher than usual, lifting moisture to altitudes where it could be broken apart by ions and lost to space. That measurement was published in 2020 and is now the standard reference for the role of dust storms in Mars’ long-term water loss (NASA SVS infographic, MAVEN team).

A second-order detail has to be acknowledged. NASA’s MAVEN lost contact with Earth on December 6, 2025, and a February 2026 review board concluded the spacecraft was not recoverable. NASA formally ended the mission in May 2026 (MAVEN, Wikipedia; Reuters, May 2026). The Lancaster study relies on archived MAVEN data, so the analysis itself is not affected by the spacecraft’s loss, but the result arrives at a moment when the only orbiter dedicated to studying the Sun-Mars interaction is no longer in operation. Future SEP-Mars coupling studies will lean even more heavily on TGO and on Mars Reconnaissance Orbiter’s continuing aeronomy observations.

The 50 °C / 90 °F warming at 75 to 125 km altitude is not, on the face of it, what one would expect. SEPs deposit their energy high in the atmosphere, mostly through ionization of CO₂, which is the dominant species on Mars. In a quiet atmosphere, that energy is radiated away or conducted to space faster than it can build a temperature signal in the middle atmosphere. The Lancaster team’s working hypothesis is that the suspended dust changes the radiative budget of the lower and middle atmosphere. Dust absorbs upwelling infrared and re-emits it; it also provides a denser population of ice-coated grain surfaces on which water can condense. The net effect is to keep the middle atmosphere warmer than the climatology would predict, so when an SEP event dumps a pulse of energy from above, the column is already closer to a thermal threshold and the additional heating becomes visible. This is a “two stressors, one signal” pattern that has analogues on Earth in stratospheric ozone chemistry and aerosol-radiation interactions, but the Mars case is cleaner because the two drivers are so well separated in time and altitude (Gizmodo coverage of the talk; Phys.org).

For the engineering side, the result matters because MAVEN and TGO were not designed to look for this signal. MAVEN’s strength is in-situ ion and neutral measurements in the upper atmosphere, with instruments like NGIMS and IUVS. TGO carries NOMAD and ACS for atmospheric spectroscopy, plus a radio-science experiment that uses the spacecraft’s occultation link to derive vertical temperature profiles. Putting the two together for an SEP-dust synergy study is the kind of cross-mission analysis that only became possible once both archives had matured. The lesson for future Mars exploration architecture is the same one that keeps coming back: the value of long-lived orbital assets is realized years after their prime mission ends.

A methodological caveat is worth flagging. The Lancaster team is presenting one matching event out of five. The result is suggestive but it is not yet a population-level claim. The Royal Astronomical Society’s framing, “first study hints,” is doing real work in the press release (Royal Astronomical Society press release). Confirming or refuting the synergy will require a second matching event, and global dust storms that produce them happen roughly once every three to four Mars years, so the next opportunity may not come until late in Solar Cycle 26 or into Cycle 27.

The take-home is that Mars’ lower atmosphere is not a passive target for whatever the Sun and the surface throw at it; it is a coupled system in which a dust-driven radiative perturbation can change the visibility of a solar-driven energetic perturbation. That coupling was not in the models in 2018, and it should be in the next round. The Lancaster team has put a concrete, well-instrumented case on the table and is asking the field to plan for the next match. The answer will come on a Mars year measured in years, not months, and the MAVEN and TGO archives are now the legacy infrastructure on which that answer will be built.


A render of Reflect Orbital's Eärendil-1 sunlight-reflection satellite with its thin-film reflector deployed.


On July 9, 2026, the Federal Communications Commission granted a license to a small California company called Reflect Orbital to launch a satellite the size of a dining table, fold out an 18-meter sheet of mirrored Mylar 625 km above the ground, and aim a moving five-kilometer-wide spot of sunlight at whatever patch of Earth it wants to illuminate. The license covers a single satellite, Eärendil-1, and a single demonstration pass. The wider plan is as many as 50,000 such spacecraft by 2035.

The FCC’s order authorized radio spectrum for the spacecraft and the data link that will run the test. It did not authorize the act of bouncing sunlight at people, because that act is not a communications function and the agency does not regulate light. That distinction is the hinge on which the entire controversy swings, and it is why the American Astronomical Society called itself “dismayed” within hours of the announcement (The Debrief, July 16, 2026).

Astronomy is one of the few sciences whose primary signal is the absence of unwanted light. Ground-based optical telescopes depend on a sky that is, in their exposure windows, mostly dark. The Vera C. Rubin Observatory in Chile is currently running the largest astronomical survey ever attempted, stacking thousands of wide-field exposures from a 3.2-gigapixel camera over ten years. Every photon that does not come from a star, galaxy, or asteroid is a contaminant. Each Starlink train and imaging constellation has already cost the field time and money, and astronomers have spent the past five years learning how to subtract that signal from their data.

Eärendil-1 is a different kind of contaminant. It is not a point source streaking through a single exposure. It is a deliberate, modulated light source that the operator can point at any ground patch within range. Tony Tyson, the chief scientist of the Vera C. Rubin Observatory, told a National Academies meeting on June 4 that he considered the plan “even crazier” than the broadband constellations, because the thin-film reflectors would scatter sunlight rather than aim it precisely. “Imagine the sky full of moons,” he said (SpaceNews, July 10, 2026).

The European Southern Observatory, which operates some of the largest optical telescopes on Earth in Chile’s Atacama Desert, weighed in on July 1 with a calculation: a full 50,000-satellite Reflect Orbital constellation would multiply the background sky brightness at its facilities by a factor of three to four. Betty Kioko, an institutional affairs officer at the observatory, called the technology “an existential threat” to optical astronomy. Reflect Orbital’s FCC application drew nearly 1,900 public comments, almost all of them critical, before the agency ruled.

Reflect Orbital is based in Hawthorne, California, a few miles from SpaceX headquarters. The company calls itself “the sunlight company.” Its premise is that the Earth’s day-night terminator is, from a commercial standpoint, a wasted hour at the start of every morning and another at the end of every evening, and that an orbital mirror could redirect a small slice of sunlight onto a solar farm or work site during those hours. The chief executive, Ben Nowack, has said the satellites could extend the operating hours of terrestrial solar plants before sunrise and after sunset.

The FCC order, issued in the standard format used for experimental satellite licenses, gives the company permission to use the radio frequencies needed to control the spacecraft and telemeter its health data back to the ground. It does not, as the agency itself noted, authorize the optical payload. The 142-kilogram Eärendil-1 will carry a thin-film square reflector 18 meters on a side, made of aluminized Mylar, folded into the satellite’s body for launch and unfurled once the spacecraft reaches an altitude of 600 to 650 kilometers in a near-polar orbit inclined at 88 degrees. Reflect Orbital has said the satellite will ride to orbit on a SpaceX rideshare mission later in 2026.

The operational concept is to keep the reflector pointed at the Sun while continuously tilting its face so that the reflected beam sweeps across the dark side of the Earth below. A single satellite at 625 km can hold a five-kilometer-wide spot on the ground for several minutes at a time. With dozens or hundreds of satellites spaced around the orbit, the spot could be passed from one to the next and held for hours. The company has also said the light produced is “not bright enough to start fires or harm eyes, even when viewed through a telescope, and cannot be concentrated past maximum natural sunlight irradiance,” and that it will maintain exclusion zones around astronomical observatories and turn the beam off instantly on command.

The American Astronomical Society’s statement, released the same day as the FCC decision, was direct. It warned of damage to sensitive research instruments and flash-blinding risks to pilots and drivers, and noted that the company’s own FCC filings had included language about the possibility of permanent eye damage to anyone looking through a mid-sized telescope at the wrong moment. The society cited research suggesting that a full constellation could double or triple nighttime sky brightness even at remote observatories through atmospheric scattering of the reflected light.

The FCC’s response to those arguments was procedural. The agency’s order concluded that “concerns about Eärendil-1’s impacts on optical astronomy fall outside our review and authorization of the space station and are not a basis for denial of or additional conditions on Reflect Orbital’s operations.” It added that the company had committed to working with NASA and the National Science Foundation to address astronomical concerns. The agency framed its role narrowly: it regulates spectrum, not photons, and concluded that making spectrum available for new space activities serves the public interest.

A flat reflector in orbit cannot turn night into day, but it can shift the natural terminator. The Earth rotates once every 23 hours and 56 minutes, so any point on the equator spends roughly twelve hours in sunlight and twelve in darkness. A satellite in a sun-synchronous orbit at 625 km circles the planet about fifteen times a day, and on roughly half of those passes the spacecraft is on the lit side. The geometry that matters is the specular reflection angle: the mirror must be oriented so its normal vector bisects the angle between the incoming Sun and the outgoing ground spot, and that angle changes continuously as the satellite moves along its orbit.

The reflector itself is the simplest part. Aluminized Mylar at this scale has a mass per unit area of roughly 50 grams per square meter [unverified], so an 18-by-18-meter sheet weighs on the order of 16 kilograms. The hard engineering problems are attitude control and pointing stability. To hold a five-kilometer spot from 625 km up, the angle of the mirror must be controlled to within roughly 0.1 degrees [unverified]. Any vibration, thermal distortion, or gravitational sag in the unfurled sheet will smear the spot.

The scale of the proposed constellation is what worries astronomers most. Fifty thousand satellites at 625 km would put roughly one reflector every 100 kilometers along every orbit. Even with each satellite dark for half its orbit, the cumulative effect on the night sky would be a steady, moving pattern of bright objects that no terrestrial observatory could subtract out with software. The light is not radio interference, which can be filtered; it is broadband visible light in the same band the telescopes are trying to measure.

The FCC has approved a single test satellite, not a constellation. Reflect Orbital has until the end of 2026 to fly Eärendil-1, deploy its reflector, and demonstrate that the beam can be aimed precisely enough to stay inside the intended target zone. If the demonstration succeeds, the company will return to the FCC and likely to other agencies for the spectrum, orbital debris, and launch approvals needed for a full constellation. If it fails, the controversy loses its anchor. In the meantime, the American Astronomical Society, the European Southern Observatory, and the Vera C. Rubin Observatory argue that the test alone has already shifted the burden of proof, because the same engineering that lets one satellite hold a beam on a five-kilometer spot is the engineering that, multiplied by fifty thousand, lights up the night sky over the world’s best observatories.


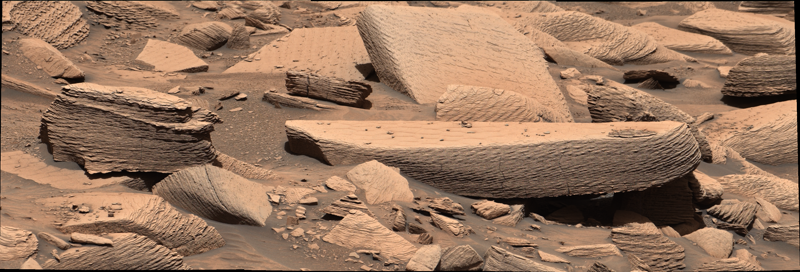
Layered beige Martian rocks at the Jawbone Canyon site in Gale crater, photographed by NASA's Curiosity rover on Sol 4391 (December 12, 2024), showing the stacked wind ripple laminations interpreted as supercritical climbing wind ripple strata.


Somewhere around 3.6 billion years ago, on what was probably an unremarkable afternoon, a sandstorm rolled into Gale crater on Mars. It may have lasted only hours. By the next day, the wind was back to normal and the surface was a sunlit desert again. No one saw it. Nothing else on the planet recorded it. But the storm left a physical imprint, and NASA’s Curiosity rover drove past that imprint on December 12, 2024, on its 4,391st Martian day, and photographed it (NASA Science Photojournal, July 20 2026).

The imprint is now the cover paper of the July 1, 2026 issue of the journal Geology. A team led by Steven Banham of Imperial College London describes millimeter-thick, crinkly laminations inside a rock the rover team nicknamed “Jawbone Canyon,” in the Mirador formation on the lower slopes of Mount Sharp. The structures are supercritical climbing wind ripple strata: a class of wind-deposited layering so rare on Earth that sedimentologists have only documented it in a handful of modern and ancient settings, and never before on another planet (Banham et al. 2026, Geology 54(7):611, DOI 10.1130/G54158.1).

Mars climate science has long had a sandstorm problem. Orbital cameras have shown that dust devils and regional dust storms lift fines off the surface today. Climate models assume that early Mars had a thicker atmosphere capable of moving sand. But the physical evidence for sustained sand-moving winds on ancient Mars has been almost entirely indirect: cross-bedded sandstones that record long-term wind patterns, dune fields that froze into rock, ventifacts worn by saltation.

Those records cannot resolve a single weather event. A climbing wind ripple is the signature of a wind strong enough, lasting long enough, and carrying enough sand that the ripples could not migrate as fast as new sand arrived. The crests piled up on the stoss side instead of sliding down the lee side. Each millimeter-thick lamina is the trace of a burst of sand transport; the climb angle records how fast sediment accumulated relative to how fast the bedform moved. The team measured angles of 10 to 18 degrees, values the paper says can only be produced by storms lasting minutes to hours, not by seasonal winds over thousands of years.

That makes the Jawbone Canyon outcrop the first direct physical evidence of a sandstorm on Mars. The paper’s wording is measured: “These climbing ripple sets occur in a thin succession, which suggests that they record a broader sustained event, such as a sandstorm or gale, lasting several hours or more.” The phrase is doing real work, because the alternative explanations had to be ruled out one by one. The central argument is a negative: ordinary wind regimes cannot deposit climbing ripples of these thicknesses at these angles, so whatever made them had to be stronger than everyday wind.

A secondary argument reaches further. Banham notes in the paper and in press interviews that the modern Martian atmosphere, at roughly 6 millibars of mean surface pressure, is too thin to drive saltation at the scale required to build these structures (Astrobiology.com, April 4 2026). The deposits imply that the atmosphere three and a half billion years ago was denser than today’s. The exact density is not pinned down, but the qualitative conclusion is clear: the air on early Mars was heavy enough to push sand in ways the present-day air cannot.

The find was not part of any planned observation. Curiosity’s science team operates in shifts, and one of the standing tasks is to scan the black-and-white navigation panoramas taken at the end of each drive for anything anomalous. Banham and his collaborators, including Linda Kah of the University of Tennessee, Joel Davis of Imperial College London, Sanjeev Gupta, Gerhard Paar, and several JPL-Caltech sedimentologists and mission scientists, noticed unusual textures in those panoramas as the rover approached the Mirador formation. They targeted the rocks with the higher-resolution Mastcam, and at full resolution the laminations resolved into the climbing ripple patterns.

Banham described the find as serendipitous: “We weren’t really looking for these deposits, and then lo and behold, we drove around the corner and found them. We were lucky that we had just the right people on shift that recognized them.” The rock itself is modest in size, roughly a meter wide and 20 centimeters high, with six discrete packages of ripple layers stacked through its thickness. The laminae dip toward the north, which means the wind that built them came from the south. Similar climbing ripples were later identified at a nearby site the team named Dry Lake, and the paper argues that the deposits formed near the margin of a larger dune field or in a wind-scoured depression where airflow patterns concentrated sand accumulation.

The discovery is also a vindication of the Mastcam team’s instinct to keep taking high-resolution follow-up imagery of “unusual” textures. Climbing ripples this small could have been mistaken for noise in lower-resolution data, or simply dismissed as weathered outcrop. The fact that a thin succession of six packages survived in one place for over three billion years, exposed at the surface for the rover to roll up to, is its own piece of good fortune.

The terminology is precise. In sedimentology, ripples are small bedforms, typically a few centimeters tall and tens of centimeters in wavelength, that form when wind or water flows over a bed of loose sand and organizes it into regular undulations. In a normal subcritical regime, sand grains saltate up the windward (stoss) face and avalanche down the leeward (lee) face, and the ripple migrates downwind without growing vertically. In a supercritical regime, the wind is strong enough and the sand supply is high enough that grains accumulate faster on the stoss face than they can slide off the lee face, so the ripple climbs. The climb angle is set by the ratio of vertical accumulation to horizontal migration; a 10-degree angle corresponds to roughly six times as much vertical deposition as horizontal migration.

Climbing ripples have been documented in a small number of terrestrial settings: deep-sea turbidity currents, certain wind-blown dune margins, and a few fluvial flood deposits. They are rare because the conditions that produce them are themselves unusual. On Mars, no one had ever identified them, in part because orbital images cannot resolve millimeter-scale laminae and in part because no previous rover had driven through sedimentary terrain with both the imaging resolution and the science team bandwidth to spot them.

The Banham paper lays out the diagnostic criteria: millimeter-scale lamina thickness, climb angles between 10 and 18 degrees, preserved stoss-side grainflow cross-stratification, and lateral continuity across the outcrop face. All four appear at Jawbone Canyon. The team estimates that a single 50-millimeter-thick layer could have formed in 6 to 20 minutes under storm conditions; the full succession of six packages therefore records on the order of an hour or two of sustained sand transport (Daily Galaxy, July 17 2026).

Curiosity has been on Mars for more than thirteen years. In that time it has found evidence of ancient lakes, rivers, groundwater, organic molecules, and a past climate that was at least intermittently habitable. What it had not found, until now, is direct evidence of an ancient sandstorm. The Jawbone Canyon outcrop fills that gap with a single rock roughly the size of a kitchen table.

The immediate payoff is a new constraint on early Mars atmospheric density: the air had to be thick enough to drive saltation at storm intensities. The longer-term payoff is a search template. Banham has said the next thing he wants the team to find is raindrop impact marks, craters in fine sediment left by rain, which would settle a separate debate about whether early Mars ever saw liquid rain rather than only snow and surface runoff. “It would be magic if we found those,” he said. The climbing ripples are not the last stop on Curiosity’s geology to-do list. They are evidence that the rover is still, after 4,391 sols, finding things on Mars that no one had asked it to look for.


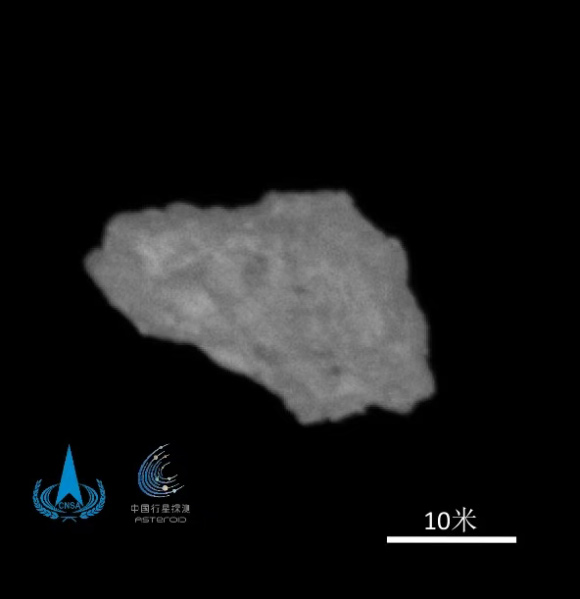
Tianwen-2's first close-up of the quasi-moon asteroid 469219 Kamoʻoalewa, captured from about 20 km on 2 July 2026; a 10-metre scale bar is included in the lower right.


A small, elongated rock against a black sky, with a 10-metre scale bar tucked into the lower-right corner. That is the entire first portrait of asteroid 469219 Kamoʻoalewa, returned on 2 July 2026 by China’s Tianwen-2 probe from a distance of about 20 kilometres. The picture is rough, but it is enough. Kamoʻoalewa is roughly the size of a small office building, and until now the only data astronomers had on its surface came from telescopes on the ground and from a few passes of the James Webb Space Telescope. Now a spacecraft is sitting in front of it, and the first thing that picture reveals is that the rock looks nothing like the Moon, which is what a five-year-old theory said it should look like (SpaceNews, Sci.News).

Kamoʻoalewa is one of seven known quasi-satellites of Earth, meaning its orbit around the Sun closely tracks ours even though it is not gravitationally bound to the planet. From our moving viewpoint it appears to loop around the Earth like a slow second moon, but the similarity is an illusion of perspective (Wikipedia). For most of the past decade the working hypothesis has been that Kamoʻoalewa is a chunk of the Moon’s far side, blasted into space by an impact and later nudged into an Earth-like orbit. The red colour of its reflectance spectrum, measured from telescopes in 2021, looked more like heavily weathered lunar silicates than like any common type of near-Earth asteroid (Space Daily).

That hypothesis is now under coordinated pressure from three independent lines of work: a population model published in Astronomy & Astrophysics, a reanalysis of the spectrum in Nature Communications, and the new JWST observations led by Benjamin Sharkey at the University of Arizona. Tianwen-2’s image does not settle the question, but it shows that the spacecraft can find, track and image a target only tens of metres across, which is the prerequisite for the sample return that will settle it. The mission is China’s first attempt at an asteroid sample return, and the spacecraft is built to bring roughly 100 grams of material home in late November 2027 (Sci.News, SpaceNews).

Tianwen-2 launched from the Xichang Satellite Launch Center on 29 May 2025, riding a Long March 3B/G2 rocket. CNSA disclosed little about the cruise until the spacecraft was already at its target. Independent tracking by AMSAT-DL in Europe picked up the probe’s signal as it approached the asteroid and showed a series of engine burns (SpaceNews). On 6 June 2026 the spacecraft first detected Kamoʻoalewa. The next day it executed a capture manoeuvre at 30,000 km to match the asteroid’s orbital plane. By 19 June it had closed to 2,000 km. On 2 July it settled into a 20 km station-keeping point and took the picture (Sci.News, SpaceNews).

CNSA announced the arrival on 6 July 2026. The agency’s statement stressed that the optical navigation data reduced uncertainty in the asteroid’s predicted position from hundreds of kilometres, based on ground observations alone, down to the kilometre scale. The 20 km point is the start of close-proximity science operations, including global mapping and selection of the sampling site. Departure from Kamoʻoalewa is planned for April 2027, with the reentry capsule delivering samples in late November 2027 (SpaceNews).

Kamoʻoalewa was discovered on 27 April 2016 by the Panoramic Survey Telescope and Rapid Response System, Pan-STARRS, at Haleakala Observatory in Hawai’i. Its name is a Hawaiian phrase that translates roughly to “oscillating celestial fragment” (Sci.News, Wikipedia). Ground-based estimates put its diameter between 40 and 100 metres. The Tianwen-2 image, with its 10-metre scale bar, suggests a diameter of just over 20 metres. That matches the JWST-based estimate from Sharkey’s team, published as a preprint in late June 2026, which puts the mean diameter at 18 plus or minus 2 metres and the rotation period at about 27.9 minutes (SpaceNews, arXiv:2606.24017).

Granvik, an astronomer at the University of Helsinki and Luleå University of Technology, told SpaceNews that the first image “basically confirms” the high geometric albedo implied by Sharkey’s JWST work, and that this reflectivity is not compatible with the low-to-moderate albedo of lunar material. “So it seems that Kamoʻoalewa is of asteroidal origin,” Granvik said (SpaceNews).

The lunar-fragment hypothesis was a coherent story built from two indirect clues, not from direct evidence. The 2021 spectroscopic study led by Benjamin Sharkey found that Kamoʻoalewa’s reflectance was unusually red and resembled heavily weathered lunar silicates more than common near-Earth asteroid types. A 2024 Nature Astronomy paper led by Yifei Jiao then proposed a specific source: the 22-kilometre-wide Giordano Bruno crater on the lunar far side, whose estimated age and impact physics could produce fragments of the right size and send some into co-orbital space (Space Daily).

Three recent studies each chip away at that picture. The first is a population model by Marco Fenucci and colleagues in Astronomy & Astrophysics. The team modelled both ordinary near-Earth asteroids delivered from the main belt and fragments produced by the Giordano Bruno impact. Their estimate produced 1.23 plus or minus 0.13 Kamoʻoalewa-like objects from the main-belt population, compared with 0.042 from Giordano Bruno ejecta. That is more than an order of magnitude in favour of a main-belt origin, although the calculation is a population argument, not a parent-body match (Space Daily).

The second is a May 2026 Nature Communications paper led by Pengfei Zhang. The team reanalysed the absorption feature and found it consistent with LL chondrites, the stony meteorites associated with asteroids like Itokawa. In laboratory tests, highly space-weathered LL-chondrite powder reproduced Kamoʻoalewa’s reflectance spectrum even though solid pieces did not. They proposed an origin in the Flora asteroid family, followed by extensive weathering of fine surface material (Space Daily).

The third is Sharkey’s new JWST observations, taken in February 2026 and supported by Large Binocular Telescope measurements in April. The infrared spectrum is much less red than the 2021 ground-based result. The authors say the colours resemble several silicate asteroid classes, including S, V, or E-types, more than weathered lunar material. The albedo and absorption features may fit an oldhamite-bearing, enstatite-rich composition. The preprint’s best-fit geometric albedo is 0.59, with model fits as low as 0.36 still working, which is far too bright to match lunar highland or mare material (arXiv:2606.24017, TechTimes).

None of these three studies identify the same asteroid analogue. What they share is that none of them require Kamoʻoalewa to be lunar rock. Tianwen-2 will be the tiebreaker. Its 11 science payloads include cameras, laser ranging, spectrometers, sounding radar and particle analyzers, plus the DIANA dust analyzer contributed by Italy (SpaceNews). For sampling, the spacecraft carries three redundant techniques: hovering, touch-and-go, and anchoring plus attachment, with the last dependent on whether the surface can support it. The anchoring approach is unusual; it would require the spacecraft to grip a body that is only tens of metres across. After the sample heads home, the main spacecraft is to continue onward to the active main-belt comet 311P/PANSTARRS, where it would carry out the first close investigation of an active main-belt object (SpaceNews).

The first Tianwen-2 picture of Kamoʻoalewa establishes that the spacecraft has reached its target and can resolve an object barely wider than a tennis court at 20 km. It does not yet say where the asteroid came from. Between now and the late-2027 sample return, the most consequential measurements will be multispectral imaging at lower altitudes and the choice of sampling site. Laboratory work on the returned grains can compare mineralogy, elemental ratios and isotopes with Apollo and Luna samples on one side and with LL chondrites on the other. A lunar match would have to overturn the new statistical and spectral arguments against it. A chondritic match would mean an ordinary asteroid had acquired a lunar disguise through long space weathering, which would be its own kind of finding (Space Daily).

The next milestone in the timeline is the move from 20 km station-keeping into closer mapping. The first attempt at sample collection is expected in 2027. Granvik’s reading of the new albedo, Fenucci’s population model, Zhang’s LL-chondrite fit and Sharkey’s JWST spectrum together point the same direction, but they do not yet reach the Moon. That is what the sample return is for.


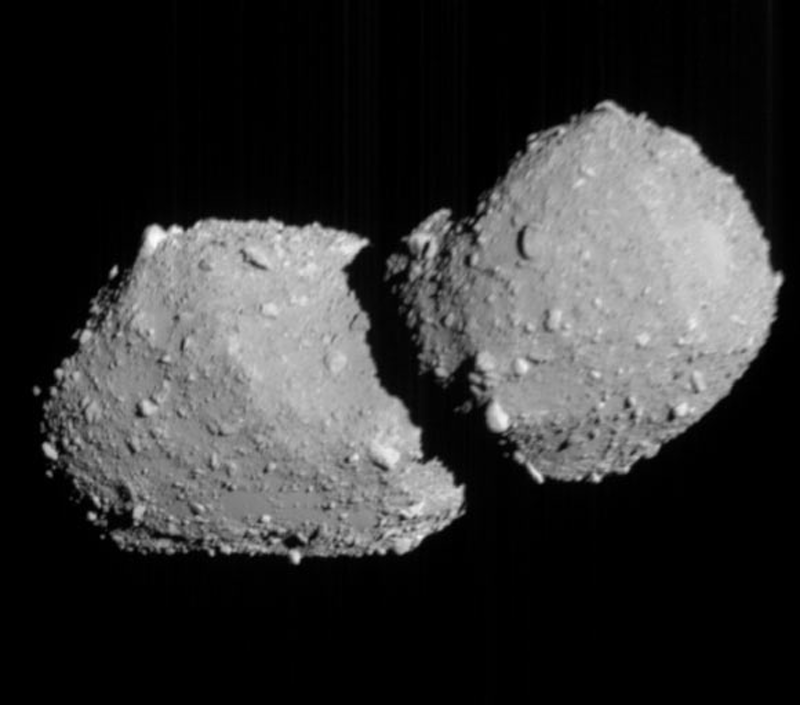
ONC-T image of asteroid Torifune captured by Hayabusa2 on July 5, 2026, showing the two-lobed contact-binary shape from a distance of roughly 800 kilometers.


On the evening of July 5, 2026, a 600-kilogram box of solar panels and instruments zipped past a peanut-shaped rock 450 meters across at roughly five kilometers per second. The flyby lasted about as long as the time it took you to read this sentence. The spacecraft was JAXA’s Hayabusa2, on a deliberate dash past near-Earth asteroid 98943 Torifune, also known by its provisional designation 2001 CC21. By the time anyone on Earth saw a single pixel of the encounter, the spacecraft was already several thousand kilometers beyond the asteroid, never to swing back (JAXA, July 6, 2026).

That brevity is the point. Torifune is the first of three asteroid encounters the extended Hayabusa2 mission is supposed to make before the probe reaches its true final target, the tiny 11-meter asteroid 1998 KY26, in 2031. The spacecraft is a sample-return craft that has already done its main job. Every extra maneuver now is rehearsal for an encounter that will be the most technically punishing of the mission (The Planetary Society, July 7, 2026).

Two reasons. First, Torifune is a contact binary, a body made of two lobes stuck together like a snowman, and those shapes are common in the small-body population but hard to study up close. Ground-based radar and adaptive-optics images suggested it was elongated; until last week no spacecraft had ever confirmed the structure with its own camera.

Second, the flyby is a deliberate dress rehearsal for planetary defense. JAXA wanted to demonstrate the kind of precision terminal guidance a kinetic impactor mission like NASA’s DART would need, where the spacecraft picks a small, faint, irregularly shaped target and threads a narrow approach corridor without hitting it. Torifune is the right kind of object: small, dim, and only clearly resolved a few days before closest approach. The mission team could not plot the final approach trajectory until the very end, because Torifune is faint enough that its exact orbit was uncertain until then (The Planetary Society, July 7, 2026).

If you are trying to design a spacecraft that bumps a city-block-sized rock off course, this is the kind of practice you want.

Hayabusa2 launched in December 2014 on an H-IIA rocket and arrived at asteroid Ryugu in mid-2018. Over the next eighteen months it dropped a pair of tiny hopping rovers, lowered the German-French MASCOT lander onto the surface, fired a 2-kilogram copper projectile into Ryugu to expose fresh sub-surface material, and scooped up samples. The return capsule landed at Woomera, Australia, in December 2020. Inside, scientists found water-bearing minerals, organic molecules, and grains that had escaped billions of years of space weathering. The samples are still being analyzed and are among the cleanest primitive materials anyone has yet returned from a carbon-rich near-Earth asteroid (Sci.News, July 8, 2026).

Most sample-return missions end there. Hayabusa2 did not. After releasing its sample capsule, the main spacecraft fired its ion engines and began a new trajectory. The extended mission has two goals: a high-speed flyby of Torifune in 2026, two Earth gravity assists in 2027 and 2028, and a final rendezvous with 1998 KY26 in 2031 (ISAS, mission page).

The Torifune encounter happened on July 5 at 18:30 JST, give or take one second. The spacecraft passed about 800 meters from the asteroid’s center, well outside the body but close enough that its three imaging instruments could resolve surface detail. ONC-T, the visible-light Optical Navigation Camera, started tracking Torifune on June 20 and continued to use the asteroid as an optical navigation reference right up to closest approach. About an hour before the flyby, the spacecraft also switched on NIRS3, a near-infrared spectrometer that hunts for water and hydroxyl signatures; TIR, a thermal infrared imager; and LIDAR, which bounces a laser off the surface to measure distance (JAXA, July 6, 2026).

Closest approach came and went. Hayabusa2 could not look back. JAXA confirmed the spacecraft was healthy at 18:35 JST, five minutes after the flyby, and the first images and thermal maps arrived within a day (Sky & Telescope, July 6, 2026).

The visible-light image showed what ground-based observers had suspected. Torifune is two distinct lobes joined at a narrow neck, the textbook shape of a contact binary formed when two smaller asteroids collided gently and stuck rather than bouncing apart. At about 450 meters across, it is in the same size class as the near-Earth asteroid Apophis and roughly an order of magnitude larger than the object that exploded over Chelyabinsk in 2013 (The Planetary Society, July 7, 2026).

The naming fits. JAXA chose “Torifune” through a public contest; it is short for Ame-no-Torifune, a Japanese deity associated with safe, steady, high-speed travel. You can see why the mission team liked it.

A flyby at five kilometers per second does not leave much margin for error. A small miscalculation in the closest-approach distance translates into several hundred meters of horizontal miss, easily enough to fly by the wrong side of the asteroid. There is no second chance. Hayabusa2 had to arrive at a precise point in space at a precise time, then keep going.

The spacecraft used a hybrid optical and radio navigation scheme. ONC-T took repeated images of Torifune against the background star field, and the team on the ground measured the asteroid’s apparent position to refine the predicted encounter point. Combined with deep-space network Doppler and ranging data, this let mission control update the trajectory within the last few days before closest approach. JAXA has not published the final navigation error budget, but the fact that ONC-T returned sharply focused images from 800 meters suggests the geometry worked (JAXA, July 6, 2026).

The thermal imager, TIR, observed Torifune in the 8 to 12 micrometer band, the thermal infrared where a sunlit asteroid radiates most of its heat. The brightness temperature, divided by the solar illumination, lets you back out the surface’s thermal inertia, a property set by regolith grain size, packing, and whether the surface is bare rock or blanketed in dust. For a small contact binary, the thermal data is the only way to learn what the surface is made of, because visible and near-infrared spectroscopy during a flyby captures too little reflected sunlight to break out mineral absorption signatures cleanly.

LIDAR is simpler but just as important. It rangefinds the surface with a 1.064-micrometer pulsed YAG laser, accurate from 30 meters out to 25 kilometers. During the Torifune encounter it produced a continuous altitude profile in the final minutes before closest approach, doubling as both a navigation input and a shape model. Combined with the ONC-T silhouette from a known viewing angle, the LIDAR track pins down the asteroid’s three-dimensional shape far better than the optical images alone (JAXA, July 6, 2026).

The instrument suite is what the spacecraft will carry into the 1998 KY26 encounter in 2031. KY26 is a different problem. At roughly 11 meters across, it is small enough that Hayabusa2 will not simply fly past; the extended mission plan calls for an actual orbit insertion and an attempted landing. The asteroid’s rapid rotation period, on the order of a few minutes, will make that landing extremely difficult, and the extended mission team is using Torifune to validate the optical and thermal mapping pipeline they will need for the harder job.

Hayabusa2 has now visited three asteroids across two missions. The first primary mission gave the world its best sample of a carbon-rich near-Earth asteroid. The extended mission is a chain of progressively harder technical demonstrations, and the Torifune flyby is the one with the lowest stakes but the cleanest test of the navigation approach JAXA wants to use in 2031. More data will downlink over the coming weeks.

Two years from now, the spacecraft will swing past Earth for a gravity assist. Three years after that, in 2031, it will arrive at a rock smaller than a house and try to land on it. Last week’s flyby is the first of the milestones the extended mission still owes the public. JAXA hit the geometry and returned a clean, recognizable image. The data will inform how we eventually deflect a real asteroid.