OrbitalHub

Where curiosity reaches escape velocity.

Domain is for sale. $50,000,000.00 USD. Direct any inquiries to contact@orbitalhub.com.


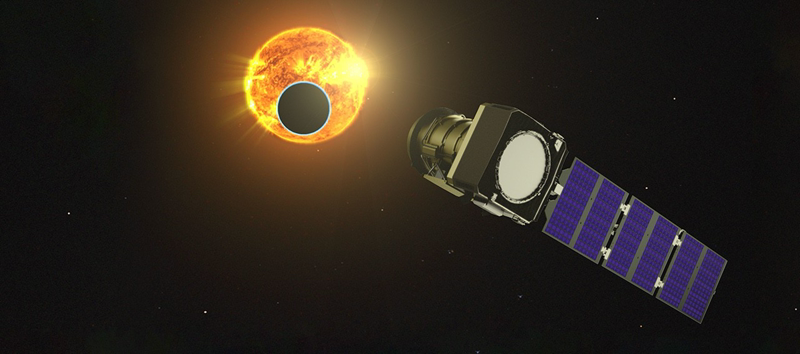
Artist's concept of the Pandora spacecraft observing a transiting exoplanet, with the dark disk of the planet visible against its bright host star and the spacecraft's solar arrays and telescope aperture on the right. Source image: NASA SVS Pandora_peers_at_a_transit_alt.jpg.


A NASA SmallSat called Pandora finished its commissioning campaign in mid-August and started routine science observations this week, becoming the first spacecraft ever launched under NASA’s Astrophysics Pioneers program to begin returning data. The mission’s job is unglamorous and foundational: stare at known transiting exoplanets for 24 hours at a time, in visible and near-infrared light together, and work out how much of the signal that astronomers have been calling “the planet’s atmosphere” is actually the star’s surface talking back. Over its year-long primary mission, Pandora will repeat that pattern at least 10 times each on at least 20 different worlds (NASA Science, Aug 25, 2026).

Pandora is not a flagship-class observatory. It is a 45-centimeter telescope in a small-satellite bus, launched on January 11, 2026, with a cost cap closer to a university instrument than to a NASA great observatory. The trade is that the mission gives up raw sensitivity and trades it for time: it can spend full days on a single target, something James Webb Space Telescope, Hubble, or any of the other big telescopes simply cannot afford to do, because their schedules are filled with hundreds of competing requests (NASA Science mission page).

Transit spectroscopy is the dominant way the field measures exoplanet atmospheres today. When a planet crosses in front of its star, a thin sliver of starlight passes through the planet’s atmosphere on its way to Earth, and the wavelength-by-wavelength absorption of that light is supposed to encode the composition of the atmosphere. Water, methane, carbon dioxide, hazes and clouds all leave fingerprints at characteristic wavelengths, and a community of thousands of papers since 2002 has built up an enormous catalog of “detected” molecules on this premise.

The premise has a quiet problem. Stars are not uniform disks. Their surfaces host hotter, brighter patches called faculae and cooler, darker patches analogous to sunspots, and those patches grow, shrink, and rotate across the star’s face on timescales of hours to weeks. When the planet transits, the starlight that grazes the planet’s atmosphere is the light coming from the exact patch of the star covered by the planet at that moment. If that patch happens to be a facula, the recorded spectrum is biased bright; if it is a starspot, the spectrum is biased dark. Both biases can mimic or erase molecular features that the atmosphere alone would have produced.

This contamination problem has been written about for years, most concretely in a 2018 paper by Benjamin Rackham (then at Harvard, now at MIT) and Daniel Apai, which showed that starspot and facula crossings could fake the entire water feature in an Earth-sized planet’s transit spectrum, with the implication that several claimed habitable-zone water detections needed re-evaluation (NASA Science, Aug 25, 2026). Rackham is now on the Pandora team. The mission is, in a real sense, a purpose-built response to the contamination question his paper raised. That response has implications for how the next decade of Webb and Ariel spectra should be interpreted.

Pandora is the first mission under NASA’s Astrophysics Pioneers program, a line that NASA created in 2020 to fund astrophysics SmallSats at roughly $20 million each, with a higher-than-usual tolerance for risk. Pioneers missions are meant to answer focused scientific questions with focused instruments, on short timelines and modest budgets, and to give early-career principal investigators a path to flying a mission. Pandora was selected in the inaugural 2021 call (NASA Science mission page).

The principal investigator is Elisa Quintana at NASA’s Goddard Space Flight Center, with project management and engineering at Lawrence Livermore National Laboratory. The telescope itself was a joint development between Livermore and Corning Incorporated: an all-aluminum 18-inch (45 cm) primary, chosen for its thermal stability over a long stare. The detectors are the heart of the instrument, and the near-infrared one is a Teledyne HxRG part originally built and qualified as a flight spare for the James Webb Space Telescope (NASA Science, Aug 25, 2026). The bus was built by Blue Canyon Technologies, which also handled spacecraft assembly, integration, and environmental testing, and which provides ongoing mission operations support. The University of Arizona leads mission operations, and NASA’s Ames Research Center performs the data processing.

Pandora launched on January 11, 2026, into low Earth orbit. The commissioning campaign that followed took roughly seven months, longer than the four-to-six months NASA’s SmallSat missions often need, mostly because of the precision pointing required to hold the telescope on a star and not drift during a 24-hour exposure. By mid-August, deputy project manager Jordan Karburn of Lawrence Livermore was ready to call it: the spacecraft is healthy and all the instruments are performing as well as the team had hoped. Routine science observations began on August 25, 2026 (NASA Science, Aug 25, 2026).

The instrument’s central trick is the simultaneous visible and near-infrared stare. When Pandora points at a star that is hosting a transit, both detectors record photons at the same time. The visible detector measures the brightness of the star across the stellar surface, including the changing pattern of spots and faculae as the star rotates. The near-infrared detector measures the transit spectrum itself, where the planet’s atmospheric absorption lives.

To turn those two measurements into a contamination-free planet spectrum, the team uses the pattern of brightening and dimming in the visible band to model what the star was doing during the transit in the infrared. They subtract the inferred stellar component from the observed infrared spectrum, leaving the planet’s absorption as the residual. That is the same general technique the field has applied to individual Hubble and Spitzer observations, but applied across a whole program at a depth and time coverage those missions could never match.

The visible detector alone does not give you a clean stellar surface map, because the planet is also blocking part of the star during the transit. Pandora solves that by spending 24 hours on each target, with the transit landing somewhere inside that window. The 20 hours outside the transit capture the stellar rotation signature cleanly, and the 4-hour transit window captures the planet’s absorption while the stellar pattern is still being monitored in the visible.

The 20-target, 10-observation, 24-hour-stare program is calibrated against a smaller list of well-characterized exoplanet host stars that other observatories have already studied in detail. The plan is that Pandora will first nail down the stellar contamination correction on those targets, where independent Webb and Hubble spectra exist for cross-checking, and then apply the validated correction to more challenging targets further out.

The Pandora team’s claim, made by project scientist Knicole Colón at NASA Goddard, is that combining Pandora’s many-hour stares with shorter Webb snapshots will give the community the first set of planet spectra that are demonstrably free of the starspot/facula confusion that has plagued the field. That is a specific, testable claim, and the year-long primary mission is sized to deliver it (NASA Science, Aug 25, 2026).

Pandora is a quiet mission by NASA’s standards, and that is the point. The Astrophysics Pioneers line was created to fund focused science that flagship missions cannot deliver, on the argument that some questions need dozens of hours per target rather than a single snapshot. Pandora’s question is the one that underlies every transit-spectroscopy result published since 2002: how much of what we attribute to a planet’s atmosphere is actually the star’s surface?

The mission is now collecting data. The first peer-reviewed results are likely to land in late 2027 or early 2028, when the team has had time to reduce the first 12 to 18 months of stares and compare them against the existing Webb and Hubble baseline. If the contamination correction works as advertised on the well-characterized stars first, the team will extend the technique to the more interesting targets, including small cool stars whose habitable zones fall in the Sweet Spot for atmospheric characterization.

The broader programmatic test is whether Pioneers as a line can deliver the science per dollar that the 2020 decadal review committee hoped for. Pandora is the first example the field will judge.
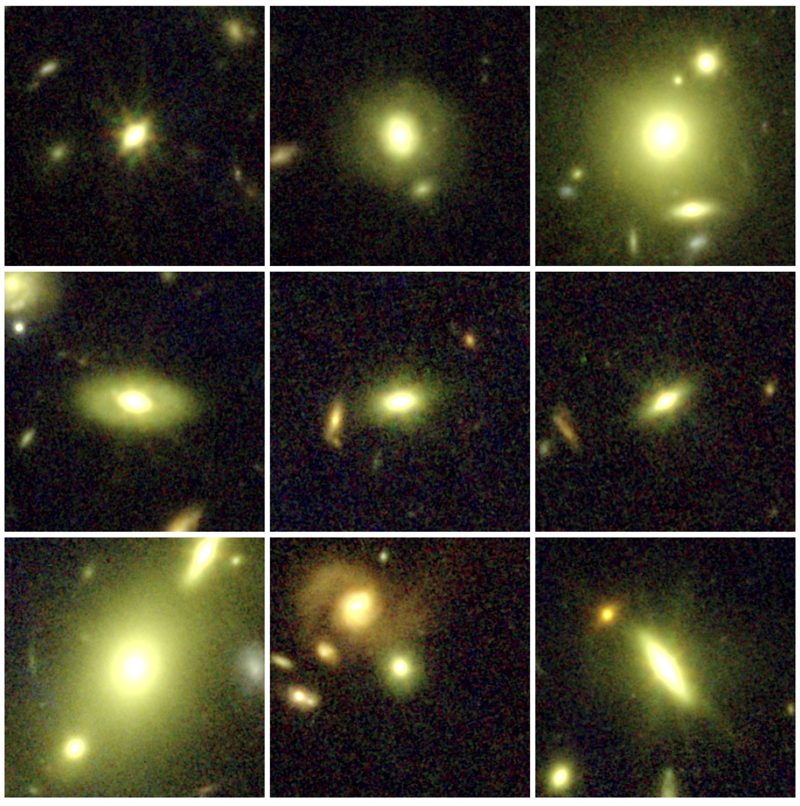


A 3x3 mosaic of the nine massive, quiescent galaxies in the JWST-IMFERNO sample, each a red-yellow elliptical or disk against a dark background. Their spectra were used to measure the bottom-heavy initial mass function. Source: Cheng et al. 2026, via Space.com.


Nine of the most massive galaxies in the nearby young universe have just told astronomers that the way they weigh themselves on paper has been wrong, and the correction makes them three to four times heavier than the previous best estimates. The galaxies sit at redshift z roughly 0.7, so their light left when the universe was about six billion years old, and they have already stopped forming stars in any meaningful quantity. A team led by Chloe Cheng at Leiden University, working inside the JWST-IMFERNO program, used the Near Infrared Spectrograph on the James Webb Space Telescope to take spectra deep enough to pick out the absorption features of low-mass stars in these distant systems for the first time. The result, published in Nature Astronomy on 18 August 2026 as Cheng, Slob, Kriek et al. 2026, is that the most massive early galaxies have a bottom-heavy initial mass function (IMF): they make a much larger fraction of low-mass stars than the Milky Way does. The implication is uncomfortable: the galaxies JWST has been finding “impossibly early” at z greater than 10 are now under even more pressure to have grown absurdly fast.

Astronomers measure the masses of galaxies the way a tax accountant estimates a person’s wealth from a bank statement: by counting the bright signals and assuming the rest scales the way it usually does. For galaxies, the “bright signals” are the few massive stars that dominate a spectrum, and the assumption is the IMF, the relative number of stars of different masses that a population of new stars produces. In the Milky Way and its immediate neighbourhood, the IMF has been calibrated against direct star counts: there is a fixed proportion of stars born above and below one solar mass, and that proportion is consistent across star-forming regions. Apply that same IMF to a distant galaxy and you can convert its total light into a stellar mass.

The problem is that the low-mass stars dominate the mass but barely contribute to the light. In the Milky Way, stars below about 0.7 solar masses make up roughly half the stellar mass but contribute only a few percent of the optical luminosity. Their presence has to be inferred. As the Leiden University press release frames it, “the brightest stars would be the skyscrapers you can immediately see from far away,” and the question has always been how many ordinary houses are hidden behind them.

JWST-IMFERNO answered that question for nine galaxies that finished forming their stars roughly six billion years ago. According to the team’s spectral fits, the two oldest galaxies in the sample carry so many low-mass stars that their true stellar masses are three to four times higher than the Milky-Way-IMF calculation would suggest. Joel Leja at Penn State, a co-author, told the Penn State press office that these systems have “three or four times more mass than we expected.” That correction pushes the most extreme galaxies further into territory galaxy formation models were already failing to reach.

The JWST-IMFERNO program (programme ID 5629, PIs Mariska Kriek, Aliza Beverage and Chloe Cheng) ran NIRSpec micro-shutter-array spectroscopy on May 3, 4 and 25 of 2025, taking extremely deep spectra of nine massive quiescent galaxies selected from the LEGA-C survey. LEGA-C, the Large Early Galaxy Astrophysics Census carried out with the VIMOS spectrograph on ESO’s Very Large Telescope, had already provided optical-wavelength spectra deep enough to measure stellar ages and metallicities for galaxies at z around 0.6 to 1.0. JWST’s NIRSpec extends the wavelength coverage into the near-infrared, where the absorption features that diagnose the low-mass stellar population live.

The sample was chosen to be representative of the most massive quiescent galaxies at that epoch: stellar masses above about 10 to the 11 solar masses, old stellar populations, low specific star formation rates. Cheng, finishing her PhD at Leiden, led the spectral fitting with state-of-the-art stellar population synthesis models. The procedure compares the observed spectrum against a grid of models that vary both the IMF shape and the standard population parameters (age, metallicity, dust). The Milky Way IMF, which has a characteristic mass near 0.2 solar masses and a slope that flattens at the low-mass end, served as the reference. The team found that the data prefer a steeper low-mass slope, in some cases a power-law index that produces many more stars below 0.5 solar masses.

A Space.com writeup by Robert Lea places the result in the broader context of the JWST “impossibly early” galaxy problem, the cluster of papers since 2023 reporting massive quiescent galaxies at z greater than 4 and even z greater than 10. The Cheng et al. result does not make that problem harder directly, because JWST-IMFERNO measured galaxies at z around 0.7, not the higher redshifts where the tension is sharpest. It does make it harder indirectly: if these z equals 0.7 descendants already carry a bottom-heavy IMF, then the IMF in their progenitors at z greater than 4 is likely to have been at least as bottom-heavy, and the stellar masses inferred for those progenitors from a Milky Way IMF would be too low by an even larger factor.

The paper appeared on arXiv on 28 January 2026 and passed peer review at Nature Astronomy in the spring and summer, with publication on 18 August 2026. The Leiden press release appeared the same day; the Penn State and Space.com writeups followed on 21 August, with ScienceDaily and phys.org coverage shortly after.

The technical content sits in three layers. The first is the spectral fitting: distinguishing a low-mass-star-dominated spectrum from a young, dust-reddened one requires very high signal-to-noise ratios and stable models. JWST-IMFERNO’s spectra reach signal-to-noise ratios near 100 per pixel, an order of magnitude deeper than anything previously published for galaxies at this redshift.

The second layer is the IMF parameterisation. The Milky Way IMF can be approximated as a broken power law with a characteristic mass near 0.2 solar masses and a slope that flattens below about 0.5 solar masses. A “bottom-heavy” IMF steepens that low-mass slope, so the same total light budget comes from a much larger number of low-mass stars. The Cheng et al. fits prefer a low-mass slope between roughly 2.5 and 3.0 in the targeted galaxies, versus about 1.3 for the Milky Way. The mass contribution from stars below 0.5 solar masses rises from roughly 30 percent in a Milky Way population to more than half in the bottom-heavy case.

The third layer is what the result does to cosmology. Stellar mass is the primary input to galaxy formation models: how fast galaxies convert gas into stars, how they grow their black holes, how they shut down star formation. If the most massive galaxies at z equals 0.7 are three to four times heavier than previously assumed, their stellar-mass densities are three to four times higher, their star-formation histories had to peak earlier, and the gas reservoirs that fed them had to be correspondingly larger. As the Leiden press release puts it, “models of galaxy formation must now explain how such enormous numbers of stars could have formed so early in the history of the Universe.”

The figure shows the nine JWST-IMFERNO galaxies as a 3-by-3 mosaic. Each panel is a postage stamp of one galaxy, with the characteristic yellow-red colour of an old, massive, quiescent stellar population. The visual sameness is part of the point: these are ordinary ancestors of today’s cluster ellipticals, and they share the bottom-heavy signature.

A single JWST program has now turned the most uncertain part of an extragalactic mass measurement (the contribution of stars too faint to see) from an assumption into a measurement. For nine massive galaxies at z roughly 0.7, the IMF is not the Milky Way’s. The two oldest galaxies in the sample are three to four times heavier than the old calculations said. The next JWST cycles will extend IMFERNO to higher redshifts, fainter galaxies, and galaxies with different star-formation histories. If the bottom-heavy signature persists, the textbook mass functions of early galaxies will be redrawn, and the timeline by which the universe assembled its first massive galaxies will be shorter than any current model predicts.


A deep Gemini North image of interstellar comet 3I/ATLAS, showing the fuzzy white coma surrounding a bright central nucleus against a background of distant stars. Image: NOIRLab / Gemini Observatory / NSF.


A heavy-water signature in the third interstellar visitor on record is rewriting what astronomers thought they knew about how comets form in other planetary systems. The comet 3I/ATLAS, which swept past the Sun in late 2025 on an unbound hyperbolic trajectory, carries roughly one deuterium atom for every hundred hydrogen atoms in its water ice. That is several times the ratio measured in any comet born in our own solar system, and it sits in territory that astronomers have struggled to explain with models tuned to the chemistry of nearby star-forming regions. A new analysis by a team led by Kenji Furuya of the RIKEN Pioneering Research Institute shows that the heavy-water fingerprint fits a comet that condensed out of a metal-poor molecular cloud, one older and more pristine than the cloud that gave the Sun its comets.

Why this matters goes beyond a single visitor’s biography. Interstellar objects are the only samples of other planetary systems that pass through the inner solar system on timescales short enough to study in detail. ʻOumuamua, discovered in 2017, was too faint and too dry to give up much of its chemistry. Borisov, the second confirmed visitor in 2019, was active enough to reveal carbon-based molecules but stayed below the brightness threshold for the most demanding isotopic work. 3I/ATLAS, the third confirmed interstellar object, found by the ATLAS survey on 1 July 2025, was bright enough to feed both the Very Large Telescope’s UVES spectrograph on Cerro Paranal and the James Webb Space Telescope, producing the first carbon, nitrogen, and water isotopic ratios measured in an interstellar comet. Those three numbers together, especially in a comet that has now left the inner solar system, are the closest astronomers will get to handling material from a protoplanetary disk around another star.

The story behind the heavy-water result runs back through several papers and one stubborn measurement. Earlier in 2026, Opitom and colleagues used UVES between 6 and 26 December 2025 to measure a carbon-12 to carbon-13 ratio of about 151 and a nitrogen-14 to nitrogen-15 ratio near 363 in the comet’s cyanogen (CN) gas, both well above the values typical of solar system comets. The carbon-12 to carbon-13 ratio sits closer to what models predict for the outskirts of an old, metal-poor protoplanetary disk. The JWST measurements that followed returned the heavy-water ratio itself, about 1% deuterium to hydrogen, which is roughly 50 times the ratio measured in a typical solar system comet and significantly higher than the values seen in nearby low-mass star-forming regions. The result was the third isotopic anomaly the comet had handed astronomers, after the carbon and nitrogen measurements, and it tied together two otherwise unrelated puzzles in a single chemical fingerprint. Furuya’s team, reporting in The Astrophysical Journal Letters, asked a deceptively simple question: can a low-metallicity origin explain both the carbon and the water isotopic signatures simultaneously? The same Opitom result was also reported by Sci.News the day the Nature Astronomy paper appeared.

The answer, from a grid of gas-ice astrochemical models spanning the cloud-to-core stages of star formation, is yes. The models vary four parameters: gas density, the strength of the interstellar ultraviolet radiation field, the cosmic-ray ionization rate, and the cloud’s metallicity (the abundance of elements heavier than helium, which astronomers treat as a proxy for how enriched the gas is by earlier generations of stars). The team tracked the chemistry of water and deuterated isotopologues from the diffuse cloud phase through the dense prestellar core, solving for the gas temperature at every step. The water D/H ratio observed in 3I/ATLAS is most readily reproduced at sub-solar metallicities, roughly half the Sun’s complement of heavy elements or less, and at relatively high cloud densities near 10,000 particles per cubic centimeter. Two of the four input parameters matter less: the ultraviolet field strength and the cosmic-ray ionization rate, provided the latter stays below about 10^-15 per second.

The deep dive into why metal-poor conditions pump up deuterium centers on a piece of interstellar chemistry that only happens in the cold. In molecular clouds at around 10 Kelvin, cosmic rays ionize molecular hydrogen and produce triatomic hydrogen ions (H3+). These ions can swap a proton for a deuteron when they collide with the common deuterated hydrogen molecule HD, producing H2D+ and ordinary H2. At cold temperatures the reverse reaction does not have enough energy to proceed, so deuterium becomes trapped in H2D+ until an electron recombines with it and frees a deuterium atom. That deuterium atom can then bond with oxygen to form HDO, heavy water, and from there normal water ice that inherits an unusually high D/H ratio. Three properties of a metal-poor environment amplify the effect. Less carbon monoxide means less H2D+ destruction, since CO readily reacts with it. Less water photodissociation by ultraviolet photons means a smaller flood of atomic hydrogen that would dilute the ratio. A modest cosmic-ray ionization rate keeps the reverse reaction from putting deuterium back into the more stable HD form. With all three effects turned on, the models produce D/H ratios near the 1% observed in 3I/ATLAS without invoking any exotic new physics. The same chemistry explains a related puzzle: the carbon-12 to carbon-13 ratio, which JWST measured earlier in 3I/ATLAS at somewhere between 123 and 191 depending on which carbon-bearing molecule was observed, is also a natural product of a metal-poor cloud. Galactic chemical evolution predicts that older stars, which formed before many supernovae had enriched the interstellar medium, should leave behind a higher ratio of carbon-12 to carbon-13 in their protoplanetary disks, simply because the heavy isotopes that would normally reset the balance had not yet been produced in large quantities.

The team’s robustness check is just as telling. They compared the D/H ratio of methane to that of water in 3I/ATLAS and in solar system comet 67P/Churyumov-Gerasimenko. The absolute deuteration of methane in 3I/ATLAS is around 3%, an order of magnitude above the 0.2% in 67P, but the ratio of methane deuteration to water deuteration stays close between the two comets. The chemistry that controls relative fractionation between water and methane is insensitive to the metallicity of the parent cloud, even when the absolute fractionation is not. That convergence is a quiet vote of confidence in the low-metallicity story.

The takeaway is specific and it sets up the next observation rather than closing the field. The carbon, nitrogen, and water isotopic ratios in 3I/ATLAS together describe a comet that condensed around a star several billion years older than the Sun, in a region of its disk where heavy elements were scarce and water ice picked up an outsized share of deuterium before the disk even began to form planets. The comet is now too faint and too distant for any current facility to repeat these measurements at higher signal-to-noise, and 3I/ATLAS’s perihelion passage on 29 October 2025 is now nearly a year in the past. The next interstellar visitor will eventually arrive, but until then, 3I/ATLAS remains the only sample astronomers have from a metal-poor protoplanetary disk, and the heavy-water ratio is the clearest handle on what that disk looked like.


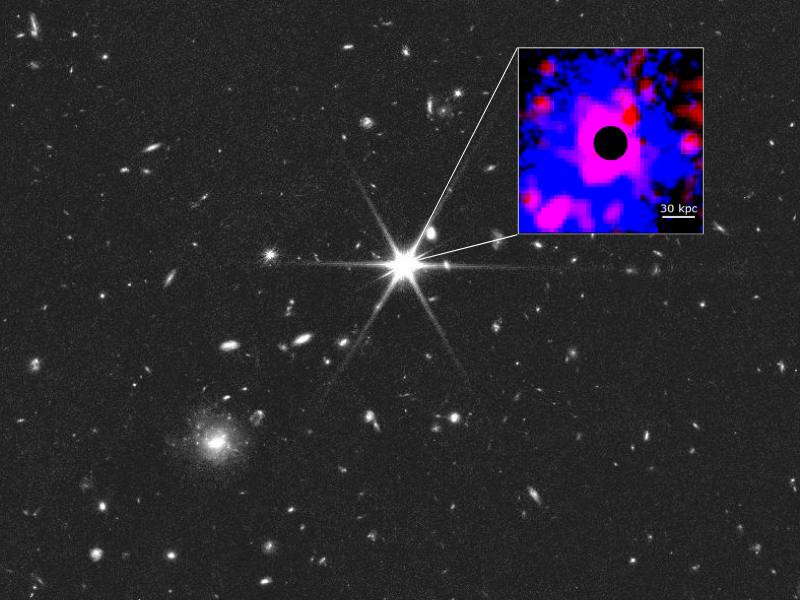
JWST F150W2 mosaic of the MQN01 protocluster with a zoom inset showing the cool Lyman-alpha nebula in blue and the new extended Chandra X-ray emission in red around the central quasar. The black disc masks the quasar itself. Source: A. Travascio (INAF) et al., A&A 2026, via INAF press release


For a brief window about 2.1 billion years after the Big Bang, a hyperluminous quasar at the centre of a still-forming galaxy cluster puffed out a halo of X-ray-bright plasma at roughly 20 million kelvin, a temperature the local universe reserves for the intracluster medium that fills mature clusters today. A 634-kilosecond (about 176 hours) Chandra observation of the protocluster MQN01, reported by Andrea Travascio, Sebastiano Cantalupo and collaborators in the second paper of their X-ray series, has now caught that halo in the act of forming. After subtracting the bright point-spread function of the central quasar, the team is left with about 66 net X-ray counts in the soft 0.5 to 2 kiloelectronvolt band, an 8-sigma detection of extended plasma reaching out to at least 30 kiloparsecs, roughly 100,000 light-years, around quasar CTS G18.01.

Mature galaxy clusters hold most of their baryons not in galaxies but in a diffuse, X-ray-glowing plasma called the intracluster medium (ICM). That plasma is what makes clusters visible to X-ray observatories and what gives cluster cores their characteristic pressures, entropies and cooling times. The unanswered question has been when, exactly, that gas first becomes hot. At redshifts above about 3, almost every extended X-ray feature that telescopes have managed to pick out around a forming cluster has come from a radio-loud galaxy, where relativistic jets launder cosmic microwave background photons into X-rays through inverse Compton scattering. The thermal hot-gas component, the one that will become the future ICM, has been the part hiding.

MQN01 is the first clean case where the hot component shows up on its own. The central quasar is radio-quiet, so there is no jet to blame. Photoionization by the quasar cannot account for the morphology or spectrum. After a long checklist of alternatives, the only model that fits is thermal emission from a hot, optically thin plasma in collisional ionisation equilibrium. The detection therefore pins down a stage of cluster evolution that theorists have been modelling but have never before measured directly: cold gas pouring into the deep potential well of a forming halo and being shock-heated to X-ray temperatures as it falls.

The MQN01 field has been on Cantalupo’s target list for almost a decade. It hosts one of the brightest Lyman-alpha nebulae known at high redshift, mapped first by Borisova et al. in 2016 and now extended across more than two arcminutes by deeper VLT/MUSE adaptive-optics pointings. The same field also contains the largest galaxy overdensity seen at z > 3 and the highest concentration of rapidly accreting supermassive black holes of any surveyed protocluster, with six X-ray-detected active galactic nuclei inside a comoving volume of about 16 square megaparsecs (paper I, arXiv 2410.03933).

To follow up on the AGN census, Cantalupo’s Cosmic Web group at the University of Milan-Bicocca obtained 634 kiloseconds of Cycle 23 Chandra ACIS-I time on the field. Paper II, published in Astronomy and Astrophysics on 27 July 2026 and distributed as arXiv 2508.20074, focuses not on the point sources but on what is left when you subtract them. The team built a careful point-spread-function model for each observation, using simulated Chandra PSFs that account for the instrument response and spectral shape of quasar CTS G18.01, and subtracted it from the merged soft-band image.

What emerged is a soft, isotropic glow that follows a classical beta-model surface density profile with a steep inner slope (beta approximately 2.1) and a core radius near 36 kiloparsecs. Joint spatial and spectral fitting pins the gas temperature at kT about 1.8 plus or minus 0.4 kiloelectronvolts, which is about 20 million kelvin. The implied virial halo mass is about 3 plus or minus 1 times 10 to the 13 solar masses, and the hot gas inside the virial radius carries about 2.6 times 10 to the 12 solar masses, roughly 56 percent of the cosmological baryon budget expected for a halo of that mass.

The INAF press release of 27 July 2026 and a German-language scinexx write-up on 20 August 2026 popularised the work as the first clear image of a forming cluster atmosphere. A Space.com piece by Robert Lea on 29 July 2026 highlighted the temperature comparison: at 36 million degrees Fahrenheit the gas is hotter in absolute terms than anything in today’s nearby clusters, while being at an earlier point in its cooling life.

The detection method is the conceptual heart of the paper. Quasar CTS G18.01 dumps most of its 0.5 to 2 keV photons into a single pixel region, but a few percent leak into the surrounding 2- to 4-arcsecond annulus, which at z = 3.25 corresponds to about 15 to 30 kiloparsecs in projected distance. The team’s approach is borrowed from studies of local Seyfert galaxies: build a high-fidelity PSF from CIAO’s simulate_psf tool, weighted by the per-observation exposure and spectral shape, subtract it from the data, and look at what is left. The annulus holds 172 total counts in the 0.5 to 10 keV band and 96 in the soft band. After PSF subtraction, about 66 net counts remain, a significance near 8 sigma.

The spectral and spatial fits are performed jointly with an MCMC walk using emcee. The thermal component is modelled with xsmekal, a plasma code that includes bremsstrahlung, recombination continuum and line emission for highly ionised species in collisional ionisation equilibrium. Metallicity and temperature are tied across four concentric radial bins, while the normalisations scale with the surface density of a beta-model profile. The best fit yields kT approximately 1.8 plus or minus 0.4 keV and a hot gas mass fraction inside the virial radius of about 8 percent of the dynamical mass, or 56 percent of the available cosmological baryon budget.

The pressures and densities implied by that fit are one to two orders of magnitude above today’s clusters. Cooling times in the inner 15 to 30 kiloparsecs sit between 1 and 10 times the local free-fall time, which means the gas would be locally unstable if there were no heating source. The team argues that gravitational shocking, cool gas dropping into the halo’s deep potential well and being heated by the accretion shock, is enough to do the work. Quasar feedback cannot be ruled out, but the soft X-ray spectrum and the lack of any excess in the hard band make a feedback-dominated scenario hard to sustain.

The same field carries a 200-kiloparsec Lyman-alpha nebula mapped by Borisova et al. 2016 and recently extended with MUSE AO mosaics. The soft X-ray emission sits inside the inner 6 times 10 to the minus 18 erg per second per square centimetre per square arcsecond contour of that nebula, suggesting that the hot phase coexists with the cold phase rather than displacing it. The thermal pressure of the X-ray-emitting plasma is high enough to confine the cold clumps that produce the Lyman-alpha emission, which is one of the better pieces of evidence yet that the multiphase circumgalactic medium at cosmic noon can be pressure-confined rather than radiation-confined.

The combined view pairs the wide-field F150W2 mosaic of the protocluster with a zoom panel in which the Lyman-alpha nebula mapped by Borisova et al. 2016 appears in blue and the new soft-X-ray halo appears in red. The black disc in the zoom masks the quasar itself.

A radio-quiet quasar 11 billion light-years away has given astronomers the first direct look at hot, X-ray-bright plasma in the act of becoming the intracluster medium. The Chandra data show about 100,000 light-years of 20-million-kelvin gas around the quasar, with the pressure and density expected for a halo that is still accreting cool gas through gravitational shocks. Whether MQN01 is a typical waypoint for protoclusters or an unusually bright outlier is the open question; the team is working through archival X-ray data on hundreds of additional high-redshift quasars and has Atacama Large Millimeter/submillimeter Array time queued to test the gas conditions independently. If the picture holds up across a larger sample, the textbook story of how cluster atmospheres form will finally have a measurement at the epoch where it begins.


October 5, 2026

The galaxy our galaxy ate

Posted by


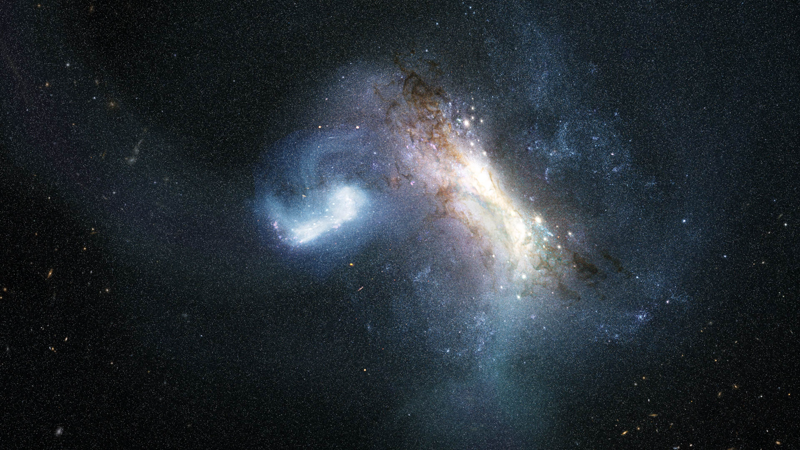
Artist's concept of the LKH merger: a large tilted spiral galaxy at right with a bright yellow-white core and mottled brown dust lanes, and a smaller blue-white galaxy at left drawn out into a curved hook by gravity, with a broad pale bridge of gas and stars stretching between them against a dark star field. Credit: NASA, ESA, Joseph Olmsted (STScI), via the ESA/Hubble image page.


There is a version of our galaxy’s biography in which the Milky Way built itself quietly out of its own gas, and only later began collecting debris from smaller neighbours. That version is now much harder to defend.

On 17 August 2026, a team led by Davide Massari of the Astrophysics and Space Science Observatory of Bologna published evidence in Nature Astronomy that the young Milky Way absorbed a dwarf galaxy roughly 11.8 billion years ago, about two billion years after the Big Bang. The dwarf itself is gone, torn apart and mixed into the inner galaxy long before Earth existed. What survives is a set of globular clusters, dense balls of tens of thousands to a few million stars, whose ages and chemical compositions do not match anything the Milky Way could have made on its own.

The team named the vanished progenitor Low-energy-Kraken-Heracles, or LKH, a name that stitches together three separate strands of earlier work that had each argued for an early merger without being able to date it. As the ESA/Hubble release puts it, the result extends the firm merger history of our galaxy 1.8 billion years farther back than it reached before.

Galaxies in the standard picture grow hierarchically. Small systems fall together under gravity, the larger one strips the smaller apart, and the victim’s stars are redistributed through the survivor. The stars keep their chemical fingerprints and, to a degree, their orbits, so a galaxy carries a fossil record of everything it has eaten. That idea is not new, but confirming it in our own galaxy took decades of survey work: the 2026 Kavli Prize in Astrophysics went to Vasily Belokurov, Amina Helmi and Rodrigo Ibata for exactly this, uncovering the fossil evidence that the Milky Way was built through hierarchical accretion.

Until now the confident part of that record stopped around 10 billion years ago, at the merger with the dwarf galaxy Gaia-Sausage-Enceladus (GSE), which rearranged the structure of the galactic disk. The most recent large merger, with the Sagittarius dwarf, began more than 6 billion years ago and is still in progress. Earlier than GSE, the picture went soft. When the Milky Way was young it was small, so an incoming galaxy was not a minor satellite but a comparable building block, and the collisions were correspondingly messy. Signatures from that era have had billions of years to be smeared out.

That is the epoch where galaxy formation is currently most interesting and least constrained. The James Webb Space Telescope can image galaxies as they looked more than 12 billion years ago, but rarely resolves their individual stars. Galactic archaeology works the other way around, examining surviving stars in exquisite detail without ever seeing the galaxy they came from. Sven Buder of the Australian National University framed the pairing neatly in The Conversation: distant astronomy gives snapshots of young galaxies, galactic archaeology gives their fossils.

The team analysed Hubble observations of 39 globular clusters within the inner 20,000 light-years of the galaxy, the region where traces of the most ancient mergers should still be sitting. Going in, they expected two families: clusters that formed inside the young Milky Way, and clusters delivered by GSE about 10 billion years ago.

They found three. Plotting each cluster’s precise age against its metallicity, the abundance of elements heavier than helium, produced three separate age-metallicity sequences rather than two. One tracks the Milky Way’s own progenitor. One tracks GSE. Between them sits a third sequence whose clusters are consistently older than the GSE group and younger than the clusters born in place, regardless of their metal content.

An intermediate sequence is not an ambiguous result. Two overlapping populations can blur together, but a distinct third track implies a distinct chemical history, which means a distinct galaxy. From the sequence’s position the team estimated that the merger happened about 1.8 billion years before GSE, and that the incoming system carried roughly 500 million times the Sun’s mass in stars, comparable in stellar mass to GSE itself. Most of that material was deposited within the inner 6 kiloparsecs, which is why the evidence shows up in the bulge region rather than the outer halo.

“Our home is the Milky Way galaxy, but we do not know how our house was built,” Massari said in the NASA release. “In this paper we discover where the first significant batch of bricks came from: a dwarf galaxy that we call LKH.”

The naming is a deliberate act of bookkeeping. Previous work had identified a “Kraken” merger, a bulge population called “Heracles”, and a low-energy group of globular clusters, all pointing at an early accretion event from different directions and all difficult to reconcile with each other. By folding the three labels into one, the authors are arguing that the earlier claims were describing the same object with different instruments, and that the debate over whether such an event happened can now close.

Co-author Chiara Zerbinati of the University of Bologna credited the instrument pairing. High resolution and deep Hubble imaging gave the ages and metal content at unprecedented precision, she said, and combining that with Gaia measurements made it possible to separate one population of clusters from the rest.

The measurement rests on a specific and unglamorous piece of stellar astrophysics. A globular cluster’s stars formed at roughly the same time from the same gas, so on a colour-magnitude diagram they trace a single main sequence with a turnoff point where the most massive surviving stars are just exhausting their core hydrogen. The luminosity of that turnoff drops as the cluster ages, which makes it a clock. Reading it in absolute terms is hard, because the answer depends on distance, reddening by intervening dust, and the physics inside stellar models. Reading it in relative terms across many clusters observed by the same instrument in the same filters is considerably more robust, because the systematic errors largely cancel.

That is the leverage here. The absolute age of any one cluster still carries substantial model uncertainty, but the ordering of clusters relative to each other can be pinned down far more tightly, and ordering is what separates two age-metallicity sequences that overlap in metallicity. Hubble’s stable, well-characterised photometry over decades of archival imaging is what makes the relative comparison possible at all.

Metallicity supplies the second axis. A galaxy enriches its own gas as generations of stars produce heavier elements and die, so within a single galaxy age and metallicity climb together along a characteristic curve. A small galaxy enriches slowly and at low metallicity; a massive one runs the sequence faster and further. The shape of a sequence therefore encodes the progenitor’s mass, which is how a 500-million-solar-mass estimate comes out of a set of star cluster ages.

Gaia contributes the dynamics. Orbital energies and angular momenta computed from its astrometry let clusters be sorted by where they sit in the galactic potential, and the low-energy, tightly bound population is precisely the one expected from a merger that dumped its mass into the inner galaxy.

The limits are honest ones. Globular clusters are an incomplete census, since some early galaxies made few and others lost the ones they had, and turning a sequence into a progenitor mass requires models.

The concrete claim is narrow and testable: three sequences, 39 clusters, one merger dated 1.8 billion years before GSE, one progenitor mass near 5 x 10^8 solar masses. Fernando Aguado-Agelet of the University of Vigo and the University of La Laguna noted that Hubble is now observing globular clusters that have never been studied before, which is the obvious way to test whether a fourth sequence is hiding in the sample. The team’s stated goal is to characterise every massive merger in the galaxy’s history by this method.

The broader consequence lands on an argument about the first two billion years. Some earlier work held that the Milky Way’s earliest phase was defined by stars born in place. If a galaxy of GSE’s stellar mass arrived at 11.8 billion years ago, then accreted stars were part of the inner galaxy from nearly the beginning, and any model of the bulge that assumes purely local formation is missing a component that was there before the disk settled.


Stylized illustration of the krypton-88 neutron-capture reaction: a free neutron (single red sphere) joins a krypton-88 nucleus (the larger red-and-blue cluster on the left) to form krypton-89 (the cluster on the right), which then emits gamma rays (the wavy arrows). The word "Strontium" sits below on a faint periodic-table strip, with krypton and strontium positions highlighted.


Astronomers who study the oldest stars in the Milky Way spend a lot of time reading chemical barcodes. When those stars formed, the universe had not yet built up much beyond hydrogen, helium, and a thin seasoning of lithium, so almost every heavier element in their atmospheres had to be made inside an earlier generation of stars and then scattered. The relative amounts of those elements tell you which stellar process actually did the forging, and one element in particular, strontium, has refused to behave. New measurements of a nuclear reaction on a related element, krypton-88, now narrow the gap between what the models predict and what the oldest stars show, and the result, published in Communications Physics on 8 June 2026 by Caley Harris, Artemis Spyrou, and a team of collaborators from twelve institutions in the United States, Canada, and Europe, was carried out at the Facility for Rare Isotope Beams (FRIB) at Michigan State University and the ATLAS accelerator at Argonne National Laboratory (FRIB newsroom; Nature paper). What made the experiment possible was a workaround for one of the hardest problems in nuclear astrophysics: most of the reactions that matter for stellar chemistry happen too rarely, and on too short-lived an isotope, to fire a beam straight at a target and count the products. The team measured a different isotope instead and worked backwards.

Why strontium is interesting starts with the fact that the periodic table heavier than iron cannot be built by normal stellar burning. Iron sits at the bottom of the curve of binding energy per nucleon, so fusing more nuclei releases less energy than it costs, and stellar cores cannot climb back up that hill. The solution, laid out in a famous 1957 review by Burbidge, Burbidge, Fowler, and Hoyle, was neutron capture. If a stellar environment can flood a seed nucleus with neutrons fast enough, the nucleus swallows them one at a time and walks up the chart before it has time to beta-decay. That framework identified two regimes: the slow neutron-capture process, or s-process, which works at relatively low neutron densities on long timescales, and the rapid neutron-capture process, or r-process, which runs at extreme neutron densities during, for example, neutron star mergers. Together, those two accounted for nearly everything heavier than iron. By the 1990s, however, surveys of metal-poor halo stars started turning up abundance patterns that neither the s-process nor the r-process could reproduce. Some of those stars had roughly solar amounts of strontium, yet barely any of the heavier elements that should have come along with it under either classical process. In between the two regimes sits a third option, the intermediate neutron-capture process, or i-process, with neutron densities around 10^13 to 10^15 neutrons per cubic centimeter and timescales measured in minutes rather than years. i-process models explain many of these strange patterns, but they consistently come up short on strontium, by factors of several, compared to what the old stars actually show, and modelers had flagged one specific reaction, the neutron capture on krypton-88, as the largest single uncertainty.

The team installed FRIB’s Summing NaI detector, called SuN, at the ATLAS facility to make that measurement. They fired a beam at a target to produce krypton-89, which is krypton-88 with one extra neutron glued on, then watched the gamma rays that krypton-89 emits as it relaxes. Those gamma-ray energies and intensities carry information about the structure of the nucleus and, crucially, about how readily krypton-88 would absorb a neutron in the first place. It is the same logic doctors use when they infer blood chemistry from a downstream signal rather than a direct needle stick: the measurement is indirect, but the inference is solid if the underlying physics is well understood. The result was not what theory had predicted. The measured krypton-88 neutron-capture rate came in consistently lower than the values most nuclear-theory calculations had been using, in some temperature regimes by nearly an order of magnitude. In parallel, the team’s reaction-rate uncertainty dropped from at least a factor of eight down to about a factor of three, which is still wide but no longer the dominant term in the strontium calculation. When the team plugged the new rate into three different i-process models, all of them produced more strontium than before, and the agreement with the stellar observations improved in every case.

The deeper question is what is happening inside the krypton-88 nucleus to slow down the neutron capture. Neutron-capture cross sections depend on the density and spacing of the nuclear energy levels just above the neutron separation energy. If those levels happen to be sparse or have the wrong parity, the incoming neutron has a hard time finding a resonance to grab onto, and the reaction rate drops. Direct measurements are impossible because krypton-88 itself is unstable, so the team turned to its more stable neighbor krypton-89 and used the Oslo method, a well-established technique that extracts level densities and gamma-ray strength functions from a single set of gamma-ray spectra. The SuN detector’s whole purpose is to capture those spectra efficiently; ATLAS provides a clean krypton-89 beam; together the two facilities make the indirect measurement practical. The takeaway is that nuclear structure details in one isotope can shift stellar predictions by a factor of two or more, and the only way to know which way the shift goes is to measure.

It is worth pausing on why strontium specifically shows up so much in this story. Strontium is the lightest element whose production has historically been a clean observational test of which neutron-capture process was active. Heavier elements like barium or lead have so many overlapping production paths that the signatures blur, but strontium sits near the edge of the s-process distribution and far from the r-process peak, so its abundance is sensitive to whatever process is producing the seeds in the middle neutron-density regime. Old stars with strong carbon and slow-neutron features but unusual strontium-to-barium ratios are exactly the kind of objects the i-process was invented to explain, and the FRIB result is the first time an experiment has directly tested the nuclear physics input rather than relying on theoretical estimates. What happens next is mostly back in the hands of the modelers, as Falk Herwig, a co-author at the University of Victoria, framed it in the press release: with the main nuclear uncertainty addressed, the i-process community can turn to the astrophysics, the neutron densities, the timing of the burning episodes inside candidate stars, and the conditions needed to match what the oldest stars actually show. Candidate i-process sites include very low-metallicity asymptotic giant branch stars, post-AGB stars, rapidly accreting white dwarfs, and the helium core flash in low-mass stars, and the new measurement gives all of them a more honest set of inputs to work with. The paper does not claim to have closed the strontium question, only to have removed the single largest nuclear physics unknown behind it. The remaining gap is astrophysical, and that is what the field will spend the next several years tightening.