OrbitalHub

Where curiosity reaches escape velocity.

Domain is for sale. $50,000,000.00 USD. Direct any inquiries to contact@orbitalhub.com.


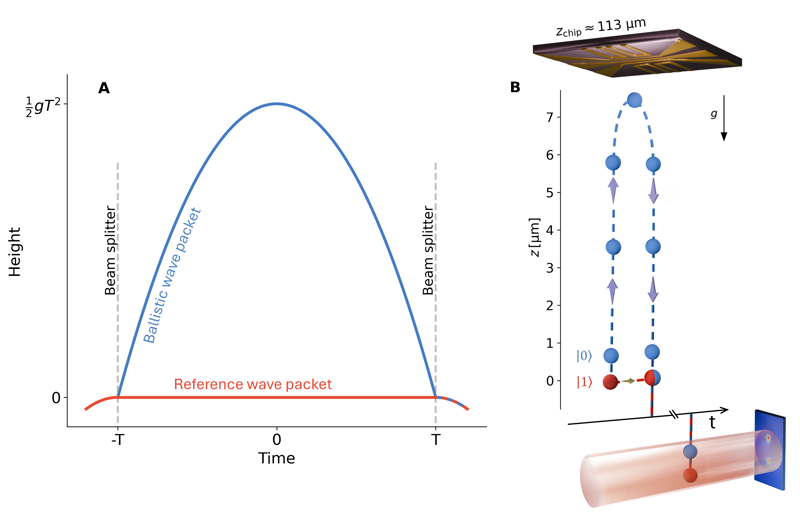
A scientific schematic of the Quantum Galileo Interferometer showing the spacetime trajectories of two wave packets in panel A and the vertical geometry of the atom chip, atom cloud and glass cell in panel B.


In a basement lab at Ben-Gurion University of the Negev, a cloud of about 20,000 rubidium atoms has just answered a question physicists have been asking for nearly a century. Cooled to a few nanokelvin above absolute zero and held still by microscopic wires on a fingernail-sized chip, the atoms were nudged into a quantum superposition in which one half of the cloud rose a few micrometres and fell back under gravity while the other half stayed put. When the two halves were brought back together, the interference pattern between them showed a clean phase shift, and that phase shift matched Einstein’s prediction to within 2.5 percent.

The result, published in Science Advances on 2 September 2026 by Dobkowski, Folman, Penrose, Vedral, Schleich and a dozen other collaborators, is the first direct measurement of the quantum phase accumulated by a freely falling particle. It is also a fresh check on Einstein’s equivalence principle, the assumption that gravity disappears for an observer in free fall. The principle works fine for billiard balls and spacecraft. Until now, no one had checked whether it still works when the falling object is in a quantum superposition of two places at once, which is what the Ben-Gurion group, along with partners at Oxford and Ulm, set out to do. That the check matters at all is because general relativity and quantum mechanics describe the universe with completely different mathematical machinery, and they have resisted every attempt to combine them for almost a century. Most attempts to unify the two assume, implicitly, that the equivalence principle still applies at quantum scales, and this result is the first empirical reason to believe that assumption is correct.

Building the right kind of interferometer took the Folman group years. Ordinary atom interferometers, which have existed since the early 1990s, can compare two paths that both involve motion, one slightly higher than the other or one slightly accelerated with respect to the other. What they cannot do is compare a path that is genuinely free of forces against a path that is held artificially still, which is exactly the situation an equivalence-principle test requires, as Ars Technica reported on 11 September 2026. The team called the new device the Quantum Galileo Interferometer, or QGI, in honour of Galileo’s original observations of free fall, and the underlying method is laid out in detail on arXiv.

Inside a glass cell held under vacuum, a few micrograms of rubidium-87 gas is cooled into a Bose-Einstein condensate, a quantum state in which all the atoms share a single wave function. The condensate floats about 113 micrometres beneath an atom chip, a flat substrate etched with microscopic current-carrying wires that paint the surrounding space with carefully shaped magnetic fields. The chip itself is mounted upside down, with the wires facing the atoms, so the magnetic gradient can levitate the condensate in place. The whole apparatus is small enough to fit on a desk, which is part of why a single lab group could afford to spend years getting it to work, but the measurement it produces has implications for the largest questions in fundamental physics.

The reason it took so long is that interference, the property the experiment depends on, is fragile. Interference only appears when there is no way, even in principle, to tell which path a particle took; any measurement that distinguishes the two paths destroys the quantum superposition and forces the particle to behave like a localised classical object. Wave packets that have fallen under gravity are moving fast, while stationary wave packets are not, and that difference in speed is itself information about the path, so a naive setup would never produce an interference pattern at all. Folman and his colleagues had to design a sequence of pulses that cancels the path information without cancelling the phase information they actually wanted to measure.

Once the atoms are ready, the experiment unfolds in four microwave and magnetic pulses, summarised in Figure 1 of the arXiv preprint. The first pulse puts every atom into a superposition of two spin states: one that feels the magnetic field and one that does not. A magnetic pulse then kicks the magnetically sensitive state upward, launching it on a ballistic arc, while the insensitive state stays put. A second microwave pulse swaps the roles: the rising atom becomes magnetically insensitive and falls freely under gravity, while the stationary atom becomes magnetically sensitive and is held hovering by a field tuned to exactly cancel its weight. A final magnetic pulse acts as a parachute, gently braking the falling atom so it lands back where it started, where the two halves of each atom can interfere. At their farthest apart, the two trajectories were about 7.5 micrometres apart and the longest free-fall time was about two milliseconds. The interference pattern at the end of each run depends on the phase that the falling path accumulated during its trip. The longer the fall, the more phase, and the chirp in those oscillations is the signature the theory predicts. As the team lengthened the fall duration, the measured phase grew in proportion to gT squared, exactly as general relativity predicts for a classical trajectory and as the equivalence principle predicts for a quantum one.

The interpretation is the part that makes the result satisfying rather than just technical. From the perspective of the falling atom, there is no gravity at all: it is in free fall, the way an astronaut is in orbit, and its wave should pick up no extra phase. From the perspective of the laboratory, the same atom is being pulled downward at 9.81 metres per second squared, and its wave should accumulate a phase proportional to gT squared. The two views should agree, and Einstein’s equivalence principle says they do. The QGI measures the lab-frame phase directly and shows that, to within the experiment’s precision, the falling quantum wave accumulates exactly the phase that gravity predicts. As The Brighter Side reported, the measurement is a checkpoint on the boundary between two theories that physicists are still trying to merge. The result does not say which, if either, will eventually have to give way, but it sets a baseline that future versions of the experiment will sharpen.

A first upgrade is already under construction at Ben-Gurion. The next-generation QGI is being designed to put nanodiamonds, particles roughly ten orders of magnitude heavier than rubidium atoms, into the same kind of superposition. Nanodiamonds sit in a mass range where several competing quantum-gravity models and collapse theories make different, falsifiable predictions, and putting a nanodiamond in superposition for any usable time has not yet been achieved. Folman told Ars Technica that his lab is already working on a design that he hopes will let the heavier experiment run within the next four or five years, though he was clear that it is “a very, very challenging project.” If it works, the team would have a direct laboratory test of the boundary between quantum mechanics and gravity in a regime where competing theories actually disagree.

In the meantime, the September result establishes something that has been assumed but not shown. When an atom falls, the quantum phase it picks up is the phase that gravity, applied classically, would predict. The equivalence principle, written down by Einstein in 1907 and tested for classical masses by Galileo, Newton, Bessel and Eötvös, has now been demonstrated, in a single careful experiment, for a particle that is in two places at once. The result does not resolve the long-standing tension between general relativity and quantum mechanics, but it removes one of the most reasonable doubts about how the two might eventually be unified: that the equivalence principle, which is foundational to general relativity, might quietly break at quantum scales. It does not appear to.
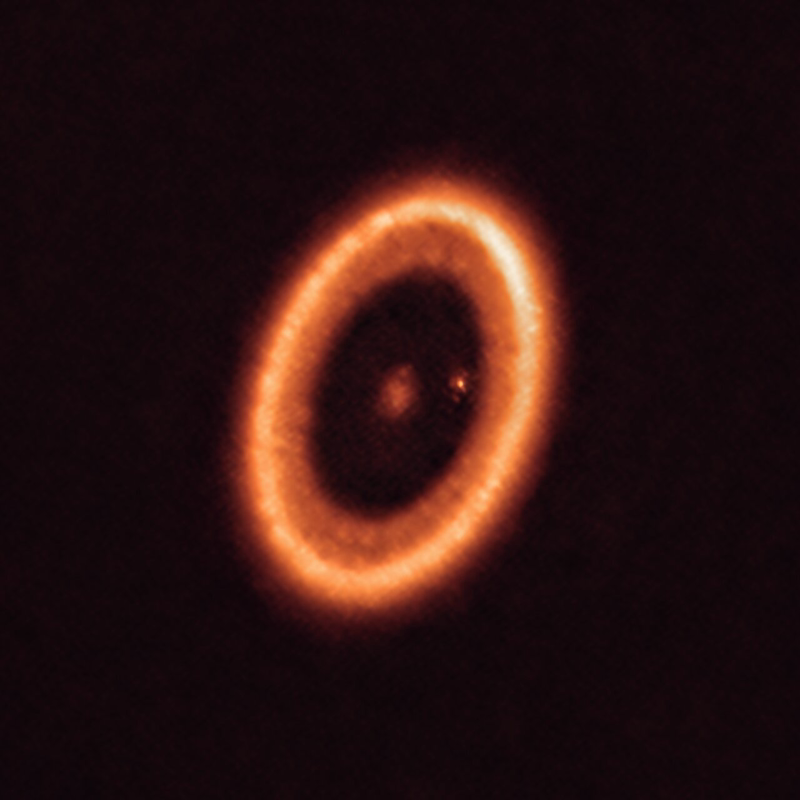


The PDS 70 protoplanetary disk as seen by ALMA, showing the bright orange dust ring and the dark gap carved out by the two forming gas giants PDS 70 b and c, which are visible as small spots inside the gap. The disk's inner regions are where JWST detected water vapor and where the new study suggests exocomets may be delivering additional volatiles. Image: ALMA (ESO/NAOJ/NRAO), via ESO.


The two planets still growing inside the disk of PDS 70 have been some of the most photographed protoplanets in astronomy since the European Southern Observatory’s Very Large Telescope first imaged them in 2018 and 2019. Now the same system is offering up a second story, one that may explain where the water inside that disk came from. A team led by Aline Novais, a post-doctoral researcher in the Department of Physics at Lund University, reports in Nature Communications that PDS 70 shows variable sodium-line absorption matching the spectroscopic fingerprint of icy bodies sublimating as they swing past their star. The result, the authors say, makes PDS 70 the youngest known system in which exocomet activity has been proposed, and the first such case around a star whose temperature is close to the Sun’s. The story has been picked up by Universe Today and The Brighter Side of News.

PDS 70 sits about 370 light-years away in the constellation Centaurus. It is a K7 T Tauri star, slightly cooler and less massive than the Sun, and at roughly 5.4 million years old it has not yet settled onto the main sequence. Its surrounding protoplanetary disk is split by a wide gap, and inside that gap two gas giants, PDS 70 b at about 20.6 astronomical units and PDS 70 c at about 34.5 astronomical units, are still accreting material. The two planets were the first protoplanets ever directly imaged, and they have become a benchmark for what planet formation looks like while it is still happening. The ALMA image of the system, reproduced below, shows the bright orange dust ring and the dark gap carved out by the two forming gas giants (see the ESO image page for full credit and dimensions; the ESO artist animation shows the system in motion). The novelty in the new paper is not about the planets themselves but about what may be moving through the system alongside them, and what those moving bodies might be carrying inward.

The argument hinges on archival spectra. Novais and her co-author Alexandra Stockwell Murphy, also at Lund, went back to 52 high-resolution spectra of PDS 70 taken with the High Accuracy Radial velocity Planet Searcher (HARPS) on ESO’s 3.6-metre telescope at La Silla in Chile. The observations span 22 nights spread across 2018, 2019, and 2020. Most of the action is in 2018, when HARPS collected 18 epochs of data. Across those 18 nights, the team identified 43 variable neutral-sodium (Na I) absorption components moving at radial velocities from roughly minus 25 to minus 115 kilometres per second relative to the star. The lines were clumpy rather than uniform, sometimes covering only a fraction of the stellar disk, and they changed amplitude, number, and velocity from one night to the next. None of those properties fits a stable, smooth disk wind. All of them fit a stream of small bodies releasing sodium-bearing gas as they swing past the star and heat up.

That spectroscopic pattern is the same one astronomers have been cataloguing for decades around Beta Pictoris, the well-known A-type star surrounded by a debris disk where thousands of exocomet transits have been inferred from variable absorption lines. Beta Pictoris is hot, several times more massive than the Sun, and old enough that its inner system has long since been cleared. PDS 70 is young, cool, and still embedded in a gas-rich disk. The new result extends the exocomet phenomenon to a regime where the surrounding architecture is still being built.

The authors are careful about the word “evidence.” The variable Na I lines are consistent with sublimating planetesimals on highly eccentric orbits, but PDS 70 is also known to drive disk winds, and a sufficiently clumpy wind could in principle produce similar absorption. Novais and her colleagues ran a simple wind model and found that the sodium mass in the lines was substantially higher than the wind model predicted, that the velocity changes from night to night were too rapid for a steady outflow, and that the partial-disk coverage required a spatially confined source. The wind scenario could not be ruled out completely, because the star’s mass-loss rate and accretion properties are not well known. The exocomet scenario remains the preferred interpretation but is not yet confirmed. The authors also note that new observations taken in 2026 with the Ultraviolet and Visual Echelle Spectrograph (UVES, programme ID 0116.C-0329, PI A. Novais) show the activity is continuing, and a detailed analysis of that follow-up dataset is in preparation.

If exocomets are the right explanation, the second question is whether they can physically reach the inner disk at the rate the data implies. To test that, the team ran N-body simulations of planetesimals interacting gravitationally with the two known gas giants, and with a hypothetical third planet in a more distant orbit. In the two-planet case, on average 0.47 percent of the test particles crossed the planetary gap into the inner disk per million years; in the three-planet case, the figure rose to 2.9 percent. Translated into a flux, the simulations suggest that for every 10 Earth masses of planetesimals stored beyond the planets, between about 0.047 and 0.29 Earth masses of icy material could be crossing the gap per million years under the assumed configurations. That is a small fraction, but the inner disk has had millions of years to accumulate it.

The water question is what gives the result its broader reach. JWST’s Mid-Infrared Instrument (MIRI) had previously detected spectroscopic emission from gaseous water close to the star, inside the planetary gap. The origin of that water was not clear. Pure gas-phase synthesis in the disk is possible but slow, and the disk is also cool enough in its outer regions for water ice to be abundant on small bodies. The exocomet scenario links the two: comets perturbed inward by the giant planets sublimate as they pass through the inner disk, releasing water and other volatiles. “Our study suggests that comets may be responsible for transporting water to the inner parts of the planetary system, where planets can form, in the same way as in the early Solar System,” Novais said in a press release accompanying the paper. “It is reminiscent of a possible process in the early Solar System, in which comets may have helped to deliver water to the young Earth,” added Stockwell Murphy.

The comparison to the early Solar System is the point that resonates beyond this one system. The leading explanations for Earth’s water include late accretion of water-bearing asteroids, contributions from icy comets, and outgassing from the planet’s interior. None of those channels is easy to observe in action, because they happened more than four billion years ago. PDS 70 is young enough that the same channels may be operating now, and the planets are still growing, so the inner disk’s water reservoir is still being filled. If a Sun-like star can build a wet inner disk by shepherding icy bodies inward, the same process could have operated around the young Sun, and the question of where Earth’s water came from shifts from “which bodies delivered it” to “how much of it was cometary in the first place.”

The authors are clear that the next step is confirmation. The UVES follow-up is one avenue. Another is the ESO Extremely Large Telescope, now under construction in Chile, which will be able to image structures in the PDS 70 disk at much higher spatial resolution and look for individual transiting comets directly. If those observations find the same sodium clouds on the same highly eccentric trajectories, the exocomet interpretation will harden into a detection. For now, the result is a working hypothesis with strong circumstantial support: variable sodium in HARPS, an inner-disk water reservoir seen by JWST, and a dynamical simulation that says yes, the icy bodies in the outer disk can get there. PDS 70 may not be a complete answer to where Earth’s water came from, but it is the first place astronomers have caught the process plausibly underway in a system that looks, in temperature and architecture, uncomfortably like a very young copy of our own.


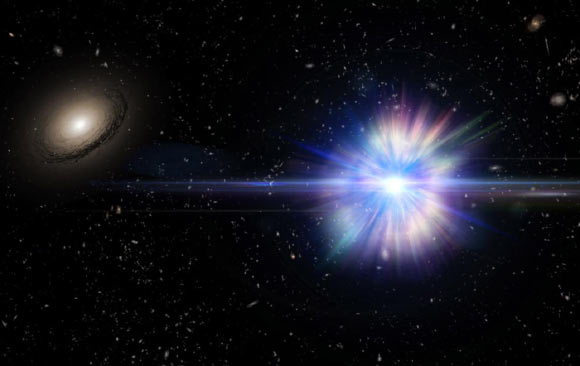
An artist's concept of a Type Ia supernova exploding in the intergalactic space between galaxies within a galactic cluster, used by supernova cosmology programs to standardise the brightness of these explosions across cosmic time. Image credit: Alex Parker / NASA / SDSS.


A decade after Type Ia supernovae earned half of the 2011 Nobel Prize in Physics for revealing that the expansion of the universe is accelerating, the same class of explosion is now driving the sharpest empirical challenge yet to the explanation behind that acceleration. In two companion papers posted to arXiv on 2 September 2026, a team led by University of Queensland PhD candidate Ryan Camilleri has stitched together 2,884 Type Ia supernovae drawn from the Pantheon+ and Dark Energy Survey five-year samples into a single, internally consistent compilation called Unite. When Unite is combined with cosmic microwave background and baryon acoustic oscillation data, the best-fit cosmology is no longer one with a constant dark-energy density. It is a flat universe whose dark-energy equation of state evolves with cosmic time, parameterised by today’s value w0 = -0.86 and a running slope wa = -0.60. That combination fits the combined data noticeably better than the cosmological constant, and the second paper reports that the host-galaxy mass corrections that make the sample consistent push the significance for time-evolving dark energy from 3.4 to 4.0 sigma relative to the older Pantheon+ result.

Why this matters is the size of the cosmological constant in the standard model and the conspicuous lack of a physical explanation for it. The standard Lambda-CDM picture of cosmology, described in detail in the Wikipedia dark-energy entry, treats dark energy as a fixed energy density, the cosmological constant, that fills space uniformly and does not change with cosmic time. That assumption has held up against every supernova sample, every galaxy-cluster count, and every CMB map for nearly three decades. It is also the assumption under which the accelerating expansion discovered in 1998 won a Nobel Prize. A growing body of independent probes, including the Dark Energy Spectroscopic Instrument’s measurement of the sound horizon from over six million galaxies and the second data release of the Dark Energy Survey, has begun to show small but coherent deviations from that picture. A w0-wa cosmology, in which the dark-energy density changes with the epoch, was long considered an unlikely complication that would die with more data. The Unite compilation is the first dataset large and internally consistent enough to push that complication past the four-sigma mark by combining supernovae with the CMB and baryon acoustic oscillations, two of the most precise cosmological probes available.

The story behind Unite runs back through the major supernova cosmology programs of the last fifteen years. Pantheon+ is the spectroscopic Hubble diagram assembled by Scolnic and collaborators from the PanSTARRS, Sloan, SNLS, and several earlier samples, totalling roughly 1,500 light curves; it became the workhorse sample for supernova cosmology after the original Pantheon release in 2018. DES-SN5YR is the Dark Energy Survey’s five-year photometric supernova program, which has now grown to be the largest homogeneous sample of Type Ia light curves from a single survey, with around 1,800 light curves of its own. Camilleri’s group combines the two into a single Hubble diagram by reanalysing Pantheon+ with the methodology that DES had already validated on its own data, then running both through the same bias corrections and selection cuts. The combined sample is 2,884 events with a consistent treatment of light-curve shape, colour, and host-galaxy stellar mass, and the team also redetermines host-galaxy stellar masses on a common framework that covers 98% of the sample. The earlier DES analysis of just the DES sample, reported in 2024, had already shown hints of a time-varying dark-energy equation of state. Unite shows the same hint pointing in a slightly different direction, and at a stronger significance when combined with the other probes. As Tamara Davis, the University of Queensland professor who oversaw the work, put it, two independent measurements now point in the same direction, which is what one looks for when the standard model starts to creak.

The deep dive into why supernova systematics matter so much centres on the host-galaxy mass step. Once a Type Ia supernova’s light curve has been standardised by its shape and colour, its peak brightness still depends, at the level of a few hundredths of a magnitude, on the stellar mass of the galaxy that hosted it. Brighter supernovae prefer galaxies with younger stellar populations, while fainter ones tend to land in older, more massive hosts. If that dependence is ignored, the standardised brightness comes out wrong, and the cosmological fit drifts. Earlier work by Vincenzi and collaborators compared the host-mass estimates used in Pantheon+ and DES-SN5YR, and showed that the choice of host-mass measurement alone contributes enough to the standardised magnitudes to flip the supernova-vs-CMB tension on or off. Lee and colleagues re-measure host masses for almost every supernova in Unite using aperture photometry and SED fitting on a single framework. Their masses differ from the values Pantheon+ released, partly because of a redshift-dependent internal inconsistency inside Pantheon+ that the new measurements expose. When the Pantheon+ subset of Unite is combined with baryon acoustic oscillations and the CMB, swapping in the new masses moves the significance for evolving dark energy from 3.4 sigma to 4.0 sigma. The same pair of papers also incorporates gravitational lensing magnification corrections, which slightly blur the standardisation but do not erase the deviation from a constant dark-energy density.

The combination itself is now decisive in a way that earlier work was not. For a flat universe with a constant equation of state, the SN-only fit returns a matter density of Omega_m = 0.310, very close to the standard value. For a flat universe in which the dark-energy equation of state evolves linearly with redshift (the so-called CPL parameterisation), the combined fit to supernovae, the CMB, and BAO returns Omega_m = 0.305, w0 = -0.86, and wa = -0.60, with a dark-energy figure of merit of 315. That value of w0 is less than -1, which means the dark-energy density was higher in the past than it is today. Wa is also negative, which means the dark-energy density is falling faster than the cosmological constant would imply. The combined dataset prefers this picture at the four-sigma level, and the paper’s own figure of merit shows a roughly 30% reduction in the w0-wa confidence region compared with Pantheon+ alone.

The takeaway is that the supernova case for evolving dark energy is now strong enough to be taken seriously, and the question is what kind of evolving. A dark-energy density that decreases with cosmic time is not the same as modified gravity, a quintessence field, or any of the more exotic options the literature considers, but it is no longer the cosmological constant either. The two independent DESI and supernova measurements, one based on sound waves in the early universe and one based on the brightness of stellar explosions in the late universe, now agree on the direction of the deviation, and the supernova side has just gotten both bigger and more internally consistent. The next year or two of data, from the still-pending third year of DES-SN5YR and from the rest of DESI’s first five-year BAO program, will tell whether the deviation grows or shrinks. If it grows, the 2011 textbook picture of dark energy is going to need a rewrite.


Multi-wavelength imaging of J1450-0144 (top row) and J1429-0104 (bottom row) showing JWST/NIRSpec acquisition images, Subaru/HSC z and y bands, ALMA [C II] 158 micrometre moment-0 maps, and ALMA dust continuum. J1429-0104 shows a clear offset between UV and [C II] emission. Image: Yang et al. 2026, Figure 9.


The two brightest objects a wide-field optical survey can pick out at the cosmic dawn are not always what they appear to be. In a paper posted on 18 August 2026, a team led by Daming Yang of Leiden University reports that two sources originally classified as faint quasars in the Subaru High-z Exploration of Low-Luminosity Quasars (SHELLQs) catalogue are instead extremely UV-luminous galaxies, and that the only stellar populations able to reproduce their spectra contain stars heavier than about 225 solar masses each Yang et al. 2026 preprint on arXiv. The finding lands in a regime where galaxy and quasar brightness functions overlap, and the result means that source classifications, and the inferred demographics of both galaxies and quasars in this crossover regime, need revisiting.

The confusion zone sits at the extreme bright end of the ultraviolet galaxy luminosity function during the epoch of reionisation. Galaxies and quasars both produce blue ultraviolet continuum, and at absolute magnitudes around M_UV ≈ -23.5, the faintest quasars and the brightest starbursts are visually similar in a ground-based photometric catalogue. SHELLQs, a long-running campaign using the 8.2-metre Subaru telescope and the Hyper Suprime-Cam wide-field imager, has spent a decade picking out candidate high-redshift quasars from the Subaru Strategic Program imaging and confirming them spectroscopically Matsuoka et al. 2020 SHELLQs IX paper. Its sixteenth data release added 69 confirmed quasars at redshifts between 5.8 and 7.0 Matsuoka et al. 2021 SHELLQs XVI paper. Two sources in that wider sample, J1450-0144 at redshift 6.627 and J1429-0104 at redshift 6.796, looked like faint quasars in the discovery spectra from GTC/OSIRIS and Subaru/FOCAS, and they were catalogued as such.

JWST changed the picture. Yang and colleagues obtained near-infrared spectroscopy with NIRSpec using the G140H and G235H gratings, which together cover rest-frame wavelengths from about 1200 to 4000 angstroms in these high-redshift targets. The new spectra reveal three spectral signatures that the original discovery spectra could not resolve: narrow nebular emission lines including the [O II] doublet at 3727/3730 angstroms and [Ne III] at 3870/3969 angstroms, which are produced by interstellar gas ionised by hot stars rather than by an accreting black hole; broad He II 1640 emission with rest-frame equivalent widths of 8.8 plus or minus 1.2 angstroms in J1450 and 3.7 plus or minus 1.1 angstroms in J1429, a feature too strong for any AGN-powered continuum at this redshift; and prominent P Cygni profiles in the high-ionisation resonance lines N V 1240, Si IV 1400, and C IV 1550, the spectroscopic fingerprints of fast stellar winds driven by the hottest, most luminous stars.

The follow-up ALMA Band-6 observations add the second piece of evidence. ALMA detected luminous [C II] 158 micrometre emission in both systems, with line luminosities of about 0.8 times 10 to the 9 solar luminosities for J1450 and 4.1 times 10 to the 9 solar luminosities for J1429. J1429 additionally shows bright dust continuum, and the [C II] and dust peaks are offset by about 5.4 kiloparsecs from the rest-frame UV emission seen by NIRSpec and Subaru/HSC. The offset is a structural clue: it shows that J1429 is not a single point-like accretion disk masquerading as a galaxy, but a spatially resolved system with cold gas and dust that have decoupled from the hot stellar light, which is exactly the geometry of an extreme starburst rather than a quasar.

The interpretation hinges on a population-synthesis fit. The authors tested two classes of models against the new spectra. The first, BPASS (Binary Population and Spectral Synthesis) with standard upper-mass cutoffs around 100 solar masses, fails to simultaneously reproduce the broad He II 1640 emission and the strong wind profiles in N V, Si IV, and C IV. The second class, BPASS extended with a dedicated prescription for very massive stars above 100 solar masses, succeeds. Under the VMS models, the equivalent-width diagnostics imply an upper-mass cutoff above 225 solar masses for J1429, while J1450 lies beyond even the 475-solar-mass endpoint of the model grid. The star-formation durations are short: 2 to 4 million years for J1450, with a broader allowed range for J1429. Stellar masses come out at log(M_star/M_sun) between about 9.2 and 9.9, with star-formation rates of roughly 300 to 540 solar masses per year.

The reference spectrum in the model grid comes from R136, the central cluster of the Tarantula Nebula in the Large Magellanic Cloud Crowther et al. 2016 R136 massive-star census. HST/STIS spectroscopy of R136 has established that the cluster hosts individual stars well above the 150-solar-mass conventional upper limit. When the team plots the JWST/NIRSpec spectra of J1450 and J1429 against the stacked spectrum of the seven most massive stars in R136, initial masses between about 100 and 300 solar masses, the wind profiles and He II emission match almost feature for feature. The reionisation-era galaxies look, at high-ionisation wavelengths, like a cosmological-scale version of a local starburst cluster.

The result has direct implications for the demographics of the early Universe. Bright-end UV luminosity function measurements during reionisation have historically assumed that anything more luminous than a threshold around M_UV = -23 is dominated by quasars; the faintest “quasar” bin is then used to constrain the AGN duty cycle at early times. If a non-trivial fraction of that bin is instead powered by VMS-driven starburst galaxies, the inferred quasar space density drops, the inferred galaxy space density rises, and the contribution of early galaxies to reionising the intergalactic medium grows. The paper notes explicitly that the inferred demographics of both galaxies and quasars in the crossover regime need revisiting.

The story is also a methodological lesson in spectroscopic re-classification. SHELLQs selected these sources on the basis of photometric dropout signatures and broad-line spectral markers visible at low signal-to-noise in 8-metre-class spectra. JWST/NIRSpec at higher resolution and sensitivity shows that the broad lines were real stellar wind profiles, not the broad permitted lines of an accretion disk, and that the narrow nebular lines, which were below the discovery spectra’s noise floor, are decisive for reclassifying the sources as galaxies rather than quasars. Crossover-regime classification at cosmic dawn is now an empirical problem rather than a photometric one, and ALMA’s structural imaging (the 5.4-kpc UV/[C II] offset in J1429) provides the second confirming axis.

The paper is a preprint, resubmitted to Nature Astronomy on 20 July 2026 according to the arXiv metadata, so the model grids and equivalent-width fits will be re-examined through peer review. The next observational test is straightforward: more JWST/NIRSpec spectra of SHELLQs candidates in this brightness range, paired with ALMA [C II] imaging to look for the same offset geometry. If even a third of the M_UV around -23.5 bin turns out to be VMS-driven starbursts rather than faint quasars, the early-Universe census shifts noticeably, and R136 stops being a peculiar local object and starts being a representative sample of how the first massive stellar populations lit up their galaxies.


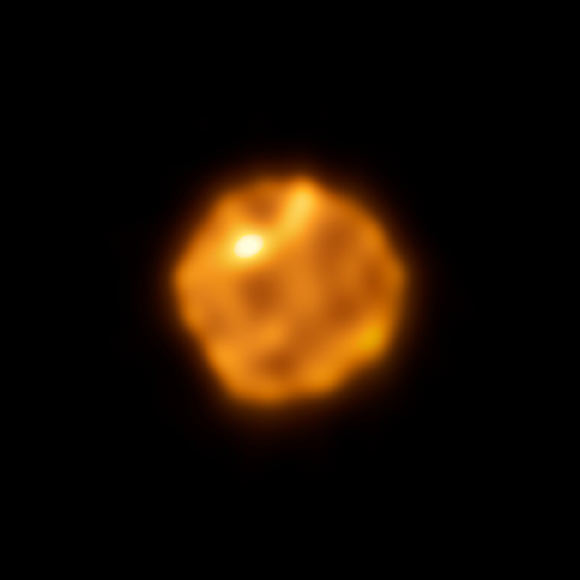
ALMA image of Betelgeuse showing the orange, asymmetric photosphere with a brighter region to the upper-left and a second warm patch to the right, taken at the longest ALMA baselines in August 2023. Source: ALMA Betelgeuse image, ALMA / ESO / NAOJ / NRAO / Dent et al.


Astronomers using the Atacama Large Millimeter/submillimeter Array have resolved the surface of Betelgeuse closely enough to see two hot patches on its outer shell, one of them about 800 kelvin warmer than the surrounding gas, and the brighter one has not moved in seven years. That kind of stability matters because the standard picture of a red supergiant is a churning ball of plasma whose outer layers roil with bubbles rising and falling on timescales of months to a few years. A feature that survives for at least seven years without drifting or fading is a different class of object than a single convective plume, and the new ALMA images are forcing stellar physicists to redraw how a supergiant’s surface organizes itself.

The observations were taken in August 2023 using ALMA’s longest-baseline configuration, which gave the team angular resolution down to about 7 milliarcseconds at the shortest wavelengths. That is sharp enough to resolve structure at roughly 1.1 to 1.3 stellar radii, the inner part of the photosphere where most of the millimeter-wave light originates. Compared against a comparable 2015 dataset, the new view shows that Betelgeuse is not just irregular but persistently irregular, with a stable geometry that convection models have to reproduce.

Betelgeuse is the closest red supergiant to Earth that is bright enough to be imaged in this detail, and it is the prototype for an entire class of massive evolved stars that seed the interstellar medium with heavy elements when they explode. Anything we learn about how its surface is structured carries over to every other red supergiant we can see in nearby galaxies, and to how those stars shed mass in the centuries before they go supernova.

Until recently, the main puzzles about Betelgeuse were its brightness, which had an unexplained dip in late 2019 and early 2020, and the possibility that it might be hiding a smaller companion star, which a separate VLT team reported in July 2026. Surface structure is a third puzzle, and arguably the more physically interesting one, because the photospheric pattern tells you how mass is being transported from the deep interior out into space. If convection organizes itself into stable polar plumes, the mass-loss geometry of the entire star follows from that pattern. The new ALMA data show the NE hot patch sitting near one of the proposed rotation poles, which suggests convection may be funneled along the polar axis rather than scattered randomly across the surface.

For stellar physics, this is the first time anyone has tracked a hot patch on a red supergiant for as long as seven years and shown that it does not rotate with the surface the way sunspots do. That is a measurable signal that large-scale convection in these stars is anchored to something deeper than the photosphere, and the natural candidate is the rotation axis itself.

The new paper, ALMA high resolution observations of Betelgeuse: Persistent structure spanning the inner atmosphere by Bill Dent and colleagues at ESO and several partner institutions, was posted to arXiv on 19 August 2026 and accepted for publication in Astronomy & Astrophysics. The team’s lead author, Bill Dent, is an ESO astronomer who has worked on ALMA instrumentation since its commissioning era, and the paper combines a fresh long-baseline dataset with archival 2015 observations taken at the same wavelength and similar resolution.

Both datasets image Betelgeuse in millimeter-wave continuum light, where the emission comes from an optically thick shell of gas at the star’s effective surface. The 2023 run reached a synthesized beamwidth down to about 7 milliarcseconds at 0.6 millimeters and observed multiple molecular lines, including silicon monoxide and carbon monoxide isotopologues, that trace gas out to about 2.5 stellar radii. By comparing the two epochs, the team could measure how stable each feature was on a seven-year baseline, something earlier work could not do because no comparable 2015 image existed at this resolution.

The headline result is that the brightest hot patch, located to the northeast of the star’s center, is essentially unchanged in both position and intensity across the seven-year gap. A second, cooler patch to the southwest has held its position too, although its intensity is closer to the surrounding photosphere and harder to distinguish in single-epoch images. Beyond these hot regions, the team found radial corrugations in the apparent stellar radius of up to plus-or-minus 6%, concentrated in one sector, indicating that the star’s surface ripples gently rather than ballooning out uniformly. None of these features show the kind of rotation signature that a sunspot would, which is the part that surprised the team.

The physics underneath these images is the same convection problem that has occupied red-supergiant theorists for decades, and the new data let the team test specific models rather than argue from a single snapshot. In a typical convection simulation for a star of Betelgeuse’s mass and luminosity, the largest convective cells span roughly a third of the stellar radius and have lifetimes of months to a few years. A patch that survives for seven years is longer-lived than the deepest such cell in current simulations, which is one of the reasons the team is careful to call the features “persistent” rather than “stationary.”

The millimeter continuum emission that ALMA detects is sensitive to gas temperature near 2300K in Betelgeuse’s atmosphere. That is cooler than the visible photosphere at around 3600K, but it sits in a region where the gas is still optically thick, so the millimeter image effectively maps a shell slightly above the visible surface. The 800K enhancement in the NE hot spot, on top of a 2300K baseline, corresponds to a roughly 35% increase in local gas temperature, which is well outside the noise floor of the new observations and consistent between 2015 and 2023.

The second surprise is the orientation. Earlier interferometric work, including VLTI observations at infrared wavelengths, had constrained Betelgeuse’s rotation axis to lie roughly along a particular line on the sky. The NE hot patch sits close to one of the proposed poles, which suggests that polar convection in a rapidly rotating massive star may be more stable than equatorial convection. This idea has been around in theoretical work, but the new ALMA images are the first clean observational handle on it.

For the engineering side, the result is also a vindication of ALMA’s long-baseline capability. The longest baselines, stretching across the Chajnantor plateau at up to 16 kilometers, are what give ALMA its 7-milliarcsecond beam at submillimeter wavelengths. Most ALMA science is done at more compact configurations, where the resolution is much coarser and a feature like the NE hot patch would simply smear out. The team used the most extended configuration specifically to resolve structure at one to two stellar radii, and the fact that the same configuration was used in 2015 and 2023 is what makes the seven-year stability comparison possible.

The clearest single fact to take away from this paper is that Betelgeuse’s photosphere is not a uniform, churning surface: it has structure that has held its position for at least seven years, and the most prominent feature sits about 800K hotter than its surroundings. That is enough to update the textbook picture of a red supergiant from “uneven and roiling” to “uneven, roiling on short timescales, but with a small number of long-lived anchored features near the rotation poles.”

What comes next is a finer-grained temporal sampling. The 2015 and 2023 epochs bracket a seven-year gap that is much longer than the expected convective turnover time, so the team cannot yet say whether the hot patches are perfectly stable or drifting slowly. A second long-baseline observation in 2027 or 2028 would catch the star near the next seasonal alignment and tighten the upper bound on drift to a fraction of a stellar radius. That would let the team test whether polar convection in Betelgeuse is locked to the rotation axis over decades, or whether the patches are simply long-lived plumes whose anchoring is statistical rather than rigid.

The wider significance for stellar astrophysics is that millimeter-wave interferometry has now joined optical and infrared interferometry as a tool for resolving supergiant surfaces, and the combination is starting to produce constraints on the deep interior that no single technique could supply alone.


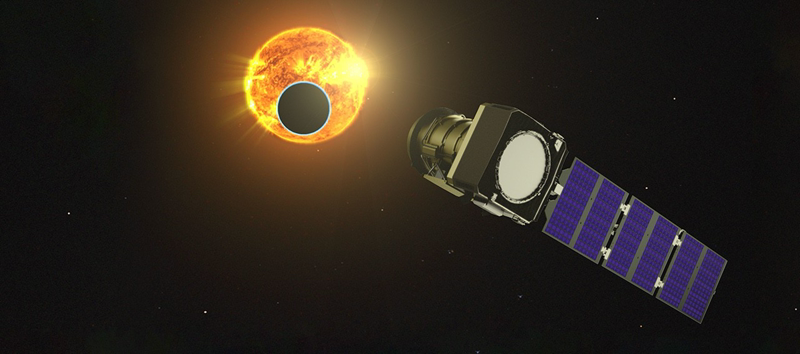
Artist's concept of the Pandora spacecraft observing a transiting exoplanet, with the dark disk of the planet visible against its bright host star and the spacecraft's solar arrays and telescope aperture on the right. Source image: NASA SVS Pandora_peers_at_a_transit_alt.jpg.


A NASA SmallSat called Pandora finished its commissioning campaign in mid-August and started routine science observations this week, becoming the first spacecraft ever launched under NASA’s Astrophysics Pioneers program to begin returning data. The mission’s job is unglamorous and foundational: stare at known transiting exoplanets for 24 hours at a time, in visible and near-infrared light together, and work out how much of the signal that astronomers have been calling “the planet’s atmosphere” is actually the star’s surface talking back. Over its year-long primary mission, Pandora will repeat that pattern at least 10 times each on at least 20 different worlds (NASA Science, Aug 25, 2026).

Pandora is not a flagship-class observatory. It is a 45-centimeter telescope in a small-satellite bus, launched on January 11, 2026, with a cost cap closer to a university instrument than to a NASA great observatory. The trade is that the mission gives up raw sensitivity and trades it for time: it can spend full days on a single target, something James Webb Space Telescope, Hubble, or any of the other big telescopes simply cannot afford to do, because their schedules are filled with hundreds of competing requests (NASA Science mission page).

Transit spectroscopy is the dominant way the field measures exoplanet atmospheres today. When a planet crosses in front of its star, a thin sliver of starlight passes through the planet’s atmosphere on its way to Earth, and the wavelength-by-wavelength absorption of that light is supposed to encode the composition of the atmosphere. Water, methane, carbon dioxide, hazes and clouds all leave fingerprints at characteristic wavelengths, and a community of thousands of papers since 2002 has built up an enormous catalog of “detected” molecules on this premise.

The premise has a quiet problem. Stars are not uniform disks. Their surfaces host hotter, brighter patches called faculae and cooler, darker patches analogous to sunspots, and those patches grow, shrink, and rotate across the star’s face on timescales of hours to weeks. When the planet transits, the starlight that grazes the planet’s atmosphere is the light coming from the exact patch of the star covered by the planet at that moment. If that patch happens to be a facula, the recorded spectrum is biased bright; if it is a starspot, the spectrum is biased dark. Both biases can mimic or erase molecular features that the atmosphere alone would have produced.

This contamination problem has been written about for years, most concretely in a 2018 paper by Benjamin Rackham (then at Harvard, now at MIT) and Daniel Apai, which showed that starspot and facula crossings could fake the entire water feature in an Earth-sized planet’s transit spectrum, with the implication that several claimed habitable-zone water detections needed re-evaluation (NASA Science, Aug 25, 2026). Rackham is now on the Pandora team. The mission is, in a real sense, a purpose-built response to the contamination question his paper raised. That response has implications for how the next decade of Webb and Ariel spectra should be interpreted.

Pandora is the first mission under NASA’s Astrophysics Pioneers program, a line that NASA created in 2020 to fund astrophysics SmallSats at roughly $20 million each, with a higher-than-usual tolerance for risk. Pioneers missions are meant to answer focused scientific questions with focused instruments, on short timelines and modest budgets, and to give early-career principal investigators a path to flying a mission. Pandora was selected in the inaugural 2021 call (NASA Science mission page).

The principal investigator is Elisa Quintana at NASA’s Goddard Space Flight Center, with project management and engineering at Lawrence Livermore National Laboratory. The telescope itself was a joint development between Livermore and Corning Incorporated: an all-aluminum 18-inch (45 cm) primary, chosen for its thermal stability over a long stare. The detectors are the heart of the instrument, and the near-infrared one is a Teledyne HxRG part originally built and qualified as a flight spare for the James Webb Space Telescope (NASA Science, Aug 25, 2026). The bus was built by Blue Canyon Technologies, which also handled spacecraft assembly, integration, and environmental testing, and which provides ongoing mission operations support. The University of Arizona leads mission operations, and NASA’s Ames Research Center performs the data processing.

Pandora launched on January 11, 2026, into low Earth orbit. The commissioning campaign that followed took roughly seven months, longer than the four-to-six months NASA’s SmallSat missions often need, mostly because of the precision pointing required to hold the telescope on a star and not drift during a 24-hour exposure. By mid-August, deputy project manager Jordan Karburn of Lawrence Livermore was ready to call it: the spacecraft is healthy and all the instruments are performing as well as the team had hoped. Routine science observations began on August 25, 2026 (NASA Science, Aug 25, 2026).

The instrument’s central trick is the simultaneous visible and near-infrared stare. When Pandora points at a star that is hosting a transit, both detectors record photons at the same time. The visible detector measures the brightness of the star across the stellar surface, including the changing pattern of spots and faculae as the star rotates. The near-infrared detector measures the transit spectrum itself, where the planet’s atmospheric absorption lives.

To turn those two measurements into a contamination-free planet spectrum, the team uses the pattern of brightening and dimming in the visible band to model what the star was doing during the transit in the infrared. They subtract the inferred stellar component from the observed infrared spectrum, leaving the planet’s absorption as the residual. That is the same general technique the field has applied to individual Hubble and Spitzer observations, but applied across a whole program at a depth and time coverage those missions could never match.

The visible detector alone does not give you a clean stellar surface map, because the planet is also blocking part of the star during the transit. Pandora solves that by spending 24 hours on each target, with the transit landing somewhere inside that window. The 20 hours outside the transit capture the stellar rotation signature cleanly, and the 4-hour transit window captures the planet’s absorption while the stellar pattern is still being monitored in the visible.

The 20-target, 10-observation, 24-hour-stare program is calibrated against a smaller list of well-characterized exoplanet host stars that other observatories have already studied in detail. The plan is that Pandora will first nail down the stellar contamination correction on those targets, where independent Webb and Hubble spectra exist for cross-checking, and then apply the validated correction to more challenging targets further out.

The Pandora team’s claim, made by project scientist Knicole Colón at NASA Goddard, is that combining Pandora’s many-hour stares with shorter Webb snapshots will give the community the first set of planet spectra that are demonstrably free of the starspot/facula confusion that has plagued the field. That is a specific, testable claim, and the year-long primary mission is sized to deliver it (NASA Science, Aug 25, 2026).

Pandora is a quiet mission by NASA’s standards, and that is the point. The Astrophysics Pioneers line was created to fund focused science that flagship missions cannot deliver, on the argument that some questions need dozens of hours per target rather than a single snapshot. Pandora’s question is the one that underlies every transit-spectroscopy result published since 2002: how much of what we attribute to a planet’s atmosphere is actually the star’s surface?

The mission is now collecting data. The first peer-reviewed results are likely to land in late 2027 or early 2028, when the team has had time to reduce the first 12 to 18 months of stares and compare them against the existing Webb and Hubble baseline. If the contamination correction works as advertised on the well-characterized stars first, the team will extend the technique to the more interesting targets, including small cool stars whose habitable zones fall in the Sweet Spot for atmospheric characterization.

The broader programmatic test is whether Pioneers as a line can deliver the science per dollar that the 2020 decadal review committee hoped for. Pandora is the first example the field will judge.