OrbitalHub

Where curiosity reaches escape velocity.

Domain is for sale. $50,000,000.00 USD. Direct any inquiries to contact@orbitalhub.com.

September 21, 2026

A fresh Type Ia supernova in NGC 7331

Posted by


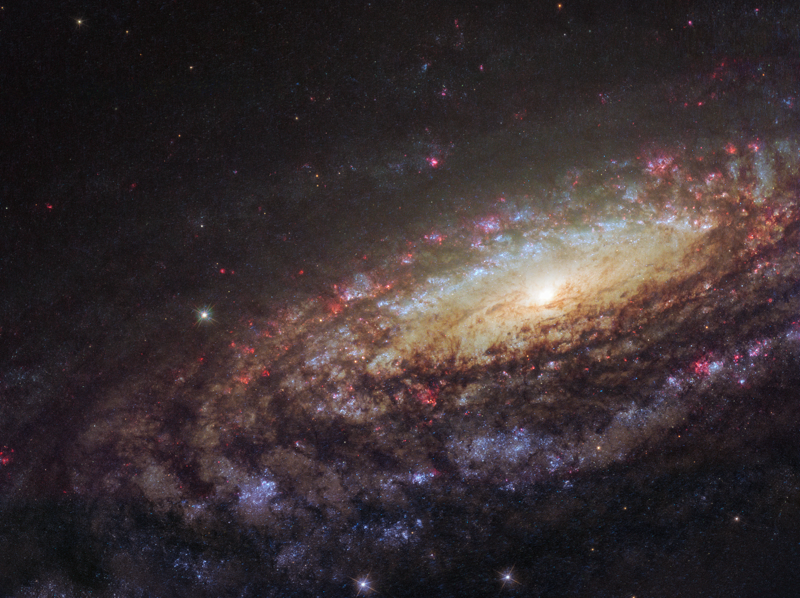
A fresh Type Ia supernova in NGC 7331. Image: 2026 09 13 sn 2026aaiv ngc 7331 supernova.


On the evening of 1 September 2026, a 0.5-meter telescope on Maui logged a new dot of light next to the core of a spiral galaxy in Pegasus. The Transient Name Server now calls it SN 2026aaiv, and the galaxy it landed in is NGC 7331, the same one that has been used for two centuries as a stand-in for the Milky Way. The supernova is a Type Ia, the kind that turns a stellar cinder the size of Earth into something brighter than the hundreds of billions of stars around it.

What makes this one different is timing. The same survey that found it is built to catch asteroids days before they hit Earth, and the supernova classification certificate arrived in the TNS inbox before most of the world knew NGC 7331 had a transient in it. The event is also still rising. By 11 September it sat at magnitude 15.7, dim to the eye but bright enough for a backyard telescope with a small CCD, and amateur observers were already reporting spectra that show the telltale silicon absorption line at 6355 angstroms moving at roughly 10,500 kilometers per second. If the light curve behaves the way most Type Ia light curves do, the supernova should peak somewhere between magnitude 11 and 12 in the next two weeks, visible through modest amateur instruments under a dark sky.

The host galaxy does most of the work in this story. NGC 7331 sits about 43.8 million light-years away in the constellation Pegasus and is one of the brighter galaxies Charles Messier left out of his 18th-century catalog. The galaxy is unbarred, which separates it from the barred spiral we now think the Milky Way is, and its central bulge rotates in the opposite direction to its disk, an arrangement that has kept astronomers arguing about it since the 1990s. It hosts a similar number of stars, a comparable central supermassive black hole, and a similar star-formation rate to our own galaxy. When the Hubble Caldwell catalog entry for Caldwell 30 calls it an analog to the Milky Way, that is the comparison it means.

A Type Ia supernova is a different animal from the core-collapse explosions that mark the deaths of massive stars. The progenitor is a white dwarf, the dense leftover of a sun-like star that has shed its outer layers and is now sitting at roughly the radius of Earth with about 1.4 times the mass of the Sun. Alone, a white dwarf just cools. Add a companion star in a tight orbit and the dwarf’s gravity becomes a siphon, pulling gas off the neighbor until the white dwarf crosses a mass threshold that ignites its carbon core in a runaway thermonuclear burn. The whole star detonates in roughly a second, and the explosion reaches a peak brightness that is remarkably uniform from event to event. That uniformity is the property that turned Type Ia supernovae into standard candles and powered the 1998 discovery of the accelerating expansion of the universe.

The uniformity has a price. Because every Type Ia reaches roughly the same peak luminosity, the Phillips relationship lets astronomers correct small differences in peak brightness back to a common value and use them to measure distances to around seven percent accuracy. The underlying physics still has open questions, including whether every Type Ia reaches the canonical 1.4-solar-mass Chandrasekhar limit before detonating, but the practical distance ladder has held up across three decades of cosmology.

The survey that found SN 2026aaiv is the Asteroid Terrestrial-impact Last Alert System, a NASA-funded robotic network run by the University of Hawaii’s Institute for Astronomy. ATLAS began observations in 2015 with one telescope at Haleakala; it now operates five 0.5-meter units across Hawaii, Chile, South Africa, and, as of February 2025, Spain. Each telescope surveys one quarter of the observable sky four times per clear night, and the addition of the southern and Spanish stations pushed ATLAS from every-other-night coverage to nightly coverage of the entire dark sky. Its primary job is to give one day’s warning for a 30-kiloton town-killer asteroid and several weeks’ warning for smaller regional impactors, but the same wide-field optical survey turns up a steady stream of supernovae, variable stars, and other transients. SN 2026aaiv is one of those byproducts.

The TNS classification certificate was filed by Claudio Balcon of the Belluno Astronomical Observatory on 2 September at 22:54:58 UTC, using a spectrum taken with the BL41 telescope’s FOSC-E spectrograph at low resolution. The classification software (GELATO and SNID-SAGE) matched the spectrum against a library of Type Ia templates and concluded that the new transient looks like a normal thermonuclear explosion. The redshift came out at 0.003, almost identical to NGC 7331’s recessional velocity, which is how the survey knew within hours that the candidate sat inside the galaxy rather than far behind it.

The image above is the 2018 ESA/Hubble view of NGC 7331, taken with the Wide Field Camera 3 during follow-up of a different supernova, SN 2014C, which still appears as a small red dot near the galaxy’s central yellow core in the original frame. The galaxy’s disk is inclined to our line of sight, so the spiral arms wrap around the core in a way that gives the long-exposure view a strong sense of depth. SN 2026aaiv is a new transient on top of the same spiral-arm structure; the position listed on the WISeREP page puts it within NGC 7331’s bright central regions, at right ascension 22:37:05.618 and declination +34:24:35.37.

For anyone with a small telescope in the northern hemisphere, the next two weeks are the window. NGC 7331 transits the local meridian late in the evening at this time of year, climbs to a usable altitude from mid-northern latitudes, and is bright enough at magnitude 10.4 to find with a finderscope. Independent observers have already posted imaging runs with smart telescopes that show the supernova as a new dot superimposed on the galaxy’s bulge. The follow-up spectroscopy that will pin down whether SN 2026aaiv is a normal Type Ia or one of the over-luminous peculiar variants depends on amateur spectroscopists mailing in their calibration files as the light curve climbs.

The most likely outcome is the boring one. SN 2026aaiv will brighten, peak somewhere between magnitude 11 and 12, and then fade over the following months. The value of catching it in real time is not the supernova itself but the cross-check it provides against the standard-candle distance scale. A well-observed Type Ia in a galaxy whose distance is already pinned down by Cepheid variables and the Tully-Fisher relation lets cosmologists test whether the peak-luminosity corrections that go into every Hubble constant measurement still hold for the next generation of telescopes. NGC 7331 has been used as a Milky Way analog for two and a half centuries. For the next few weeks, it is also a working physics laboratory, and the lights are on.
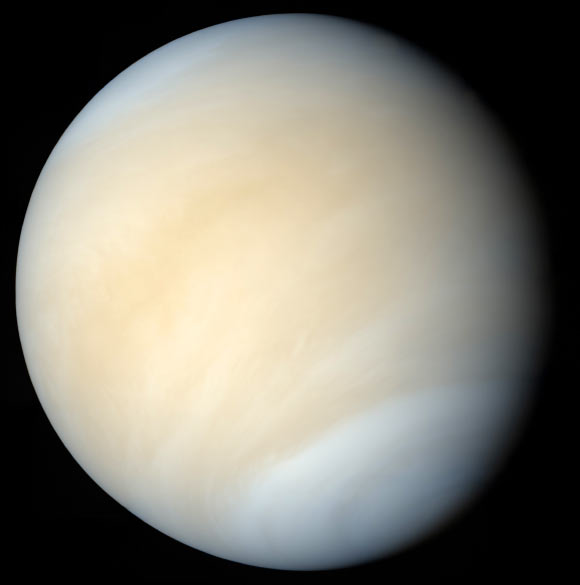


Venus in real colors, processed from Mariner 10 images, showing the pale yellow cloud deck with subtle banding. Source: NASA / Mattias Malmer / Mariner 10 imagery, via sci.news rehost


Venus looks like a smooth yellow disc through any backyard telescope. Point an ultraviolet camera at it, and the same clouds darken into a patchwork of bright and dim regions that has been tracked, named, and puzzled over since the 1920s. The dark patches are not shadows. They are absorbers, real material mixed into the sulfuric acid droplets of Venus’s upper cloud deck, and they soak up enough short-wavelength sunlight to change the planet’s appearance at wavelengths the human eye cannot see.

A new analysis from the Foundation for Applied Molecular Evolution puts a sharp quantitative number on how strong that absorption has to be. The team, led by Jan Spacek with collaborators Yeon Joo Lee of South Korea’s Institute for Basic Science, Janusz Petkowski of the Wroclaw University of Science and Technology, and Paul Rimmer of Cambridge, ran Venus’s observed UV reflectance through a radiative-transfer model that removes the contribution of cloud-droplet scattering and leaves behind a pure absorption coefficient for the liquid inside the droplets. The reported value at 375 nanometers is about 1,278 per centimeter in decadic units, Sci.News writeup of Spacek et al. 2026. That is roughly the absorption strength of a moderately concentrated dye, and it is the kind of number a lab spectroscopist can compare directly against a candidate molecule in a cuvette.

Every Venus mission proposal for the last forty years has, somewhere in its science case, a paragraph about the unknown UV absorber. The substance controls how much sunlight reaches the cloud tops, which sets the upper atmosphere’s energy budget, which feeds back into the superrotation that whips the cloud deck around the planet every four days. If we cannot identify it, every model of Venus’s climate is operating with a free parameter that has been tuned rather than measured. There is also a deeper reason the absorber matters: the cloud deck sits between roughly 50 and 70 kilometers altitude, with pressures and temperatures that on Earth would not be ruled out as a habitat for some kind of microbial life, and the phosphine debate of 2020 was in effect a debate about what kind of chemistry the clouds could host. A clean identification of the absorber would not settle that question, but it would remove one of the major unknowns. The paper was published in Astrobiology on August 25, 2026.

Astronomers have known about Venus’s UV markings since the late 1920s, when ultraviolet-sensitive photographic plates showed the planet as a mottled disc rather than the bland yellow ball it appears at visible wavelengths. The Pioneer Venus Orbiter in the late 1970s, Venus Express from 2006 to 2014, and Akatsuki since 2015 have all mapped the markings in detail. They track the four-day superrotation of the upper cloud deck, which is itself a puzzle: the atmosphere rotates about sixty times faster than the solid planet below. The markings brighten, dim, and re-form over timescales of days to years, and they do not correlate cleanly with any single altitude or temperature layer.

The candidate list is long. Sulfur allotropes, ferrous chloride, hematite, several organic compounds, even microorganisms have all been proposed at various points. None of them, on their own, match all the observational constraints at once: the right absorption strength, the right wavelength dependence, the right behavior over time, and chemical survival in a cloud environment that is mostly concentrated sulfuric acid with traces of water. The Spacek et al. paper takes a different approach. Instead of asking which molecule fits, the team asks how strong the absorption in the bulk cloud liquid has to be, in units a lab spectroscopist recognizes.

They start from spacecraft measurements of Venus’s reflectance between 365 and 455 nanometers and feed those measurements into a radiative-transfer model that treats the cloud droplets as Mie scatterers and accounts for multiple scattering by atmospheric molecules above the cloud deck. The output is the absorption coefficient of the bulk cloud liquid, the same quantity you would get from putting a sample in a cuvette and running a UV-visible spectrometer.

The peak comes out at about 1,278 per centimeter at 375 nanometers. To put that in concrete terms, porphyrin-type pigments in the lab, used here only as familiar examples of efficient absorbers rather than as biological claims, would need to be present at concentrations on the order of 10 grams per liter to hit that coefficient. Many of the inorganic candidates proposed over the years would need to be present at concentrations that strain chemical plausibility in a sulfuric acid aerosol.

A second result is just as important. The spectrum is steep. Between 365 and 455 nanometers, the inferred absorption drops sharply. That rules out the broad, brown, tar-like absorption that simple organics tend to develop when soaked in concentrated sulfuric acid over time. Whatever the absorber is, it resists being converted into that messy mixture. In Spacek’s words, the relatively sharp absorption profile is consistent with a chemically defined absorber that resists conversion into the tar-like mixture. The shape of the spectrum is now a constraint any future candidate has to satisfy.

The radiative-transfer step is the heart of the result and worth a closer look. Venus’s clouds are optically thick, with optical depths well above unity at UV wavelengths, so a photon entering the cloud deck is likely to scatter many times before it is absorbed or reflected back. From orbit, you see a planet that is darker than the underlying absorption alone would suggest, because each scattering event lengthens the photon’s path through the absorbing medium.

Spacek’s group accounts for that with a two-stream treatment, separating the cloud droplet’s scattering cross section from its absorption cross section. The droplet’s bulk refractive index at the relevant wavelengths is the standard sulfuric acid value. The atmospheric path above the cloud deck, mostly carbon dioxide with sulfur dioxide, is treated as a Rayleigh-scattering layer with a small but non-negligible contribution. The model then inverts the observed reflectance to recover the absorption coefficient of the bulk liquid.

The choice of wavelength window matters. Below 365 nanometers, Venus’s atmosphere starts to absorb strongly on its own, mainly through sulfur dioxide bands, and the cloud signal gets harder to disentangle from the gas signal. Above 455 nanometers, the absorber is less active, and the signal-to-noise ratio on the recovered absorption coefficient drops. The 365 to 455 nanometer window is the cleanest band where the absorption is dominated by the cloud droplet’s liquid content.

The 1,278 per centimeter number is a decadic absorption coefficient, the base-10 version of the natural absorption coefficient. In spectroscopy, a value around 1,000 per centimeter in a one-centimeter path length corresponds to roughly 90 percent absorption. That is an aggressive target for any single-component absorber at the concentrations likely in a Venusian cloud droplet, which is why the paper frames its conclusion in terms of either very high concentration, very efficient molecules, or both. The porphyrin-class example is used precisely because porphyrins are exceptionally efficient absorbers per molecule.

A subtler point: the constraint applies to the bulk liquid absorption, not to a single molecule’s molar extinction. A mixture of moderately efficient absorbers at high enough concentration can also produce a bulk coefficient of 1,278 per centimeter, and the paper’s framing does not distinguish between the two cases.

Spacek et al. have not identified the absorber. They have done something arguably more useful: they have turned a planetary-science puzzle into a laboratory measurement with a specific number. A bulk liquid absorption coefficient of about 1,278 per centimeter at 375 nanometers, with a steep roll-off toward 455 nanometers, is now the constraint any candidate has to hit.

The next steps are clearer for it. Lab spectroscopy can screen proposed compounds against this number without flying anything to Venus. Atmospheric modelers can use the tight constraint to reduce the free parameters in their climate simulations. And mission planners designing future Venus cloud-sampling platforms, whether they are looking for chemistry or for the more speculative question of cloud-borne biology, now have a sharper target list to test.


September 20, 2026

McGetchin, the Moon’s newest crater

Posted by


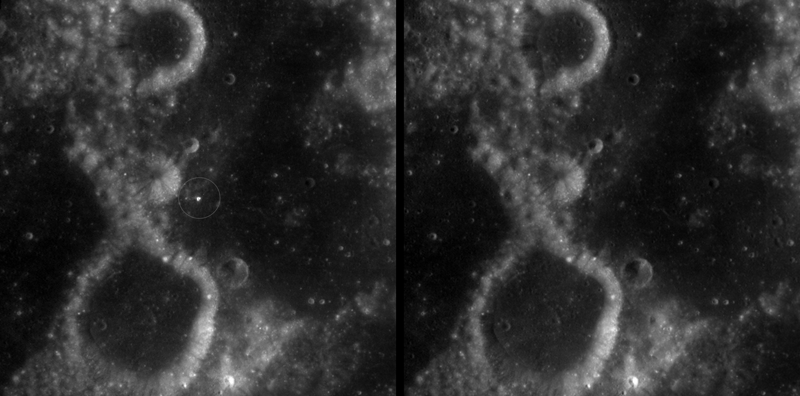
Two side-by-side black-and-white panels of the lunar surface captured by LRO's Wide-Angle Camera. The left panel shows a thin white circle around a small bright spot just right of center; the right panel shows the same area before the impact with no circled feature. The stacked-frame difference image is what tipped off Robert Wagner to the new crater.


On October 24, 2025, Robert Wagner sat down at his computer for a routine data-quality check and found a hole in the Moon that no one knew was there. The bright pixel he traced to the lunar eastern limb has now been confirmed as McGetchin crater, a 222-meter bowl carved into the surface by an impact that hit sometime between April 11 and May 22, 2024. Two papers in Science Advances on September 16, 2026 announce the find and describe what the impact did to the ground around it, and the LROC team has named the feature for Tom McGetchin, the Apollo-era field geologist who helped figure out how impact melts behave. The crater itself is roughly the length of two American football fields across and about 43 meters deep, three times the diameter of the previous record-holding fresh lunar crater spotted from LRO a decade ago.

Why this matters is that the Moon keeps taking hits, and almost no one sees them happen. There is no atmosphere to slow incoming rocks, so a small comet or asteroid fragment the size of a three- to six-story building reaches the surface essentially intact, and the only evidence it leaves is what the next orbital pass can resolve. NASA has been chasing these fresh craters with LRO since the spacecraft reached lunar orbit in June 2009 (NASA Science), and the mission has catalogued at least one thousand new impact craters and flagged a hundred thousand more surface changes from impacts or their ejecta. McGetchin is the largest of the lot, and the find arrived not because anyone was watching for it but because Wagner stacked hundreds of Wide-Angle Camera frames from before and after the impact and let the difference stand out. That methodology turned a routine quality check into a once-per-century discovery.

The story begins with a click on a thumbnail. Wagner is an image-processing specialist who works on the LROC system through Intuitive Machines, the company that has been landing commercial spacecraft on the lunar surface. He was running his usual comparison between a freshly assembled Wide-Angle Camera global map and an older one, looking for change at scales larger than about 50 meters, the size of objects his wide-field system can actually resolve. Wide-Angle Camera pixels are roughly the size of American football fields, so to spot a new feature he has to stack many frames on top of each other and let software subtract everything that did not change. Things that stay the same turn gray, and anything new shows up bright or dark. Most of what the software flags is noise, but the gray-on-gray hack works well enough that, when Wagner scrolled to a tile on the eastern limb, a bright spot circled by a darker halo stopped him cold. “It was by far the most obvious impact debris pattern I’ve ever seen in one of these images,” he said in the NASA release.

After Wagner flagged the spot, the LROC team turned the Narrow-Angle Camera on it. That instrument images the surface at about one meter per pixel, three orders of magnitude sharper than the Wide-Angle Camera, and it gave a clean view of the bowl itself and the ray pattern flung outward by the impact. The crater is roughly circular and 222 meters across, with a clean rim and a darker interior, and the ejecta blanket around it is what registered as the bright halo Wagner had seen from a distance. Independent confirmation came from comparing LROC Narrow-Angle Camera frames acquired on December 5, 2024 and again on March 3, 2025, and from thermographic observations by LRO’s Diviner instrument. The team published its analysis of the impact and its thermal aftermath in Science Advances this week (USRA newsroom); a separate paper in the same issue models the kinetic energy and the regolith disturbance, which Diviner picked up as a roughly 4-mile-wide cold spot about 16 degrees Fahrenheit cooler at night than the surrounding terrain. A follow-up Narrow-Angle Camera pass was later rolled 51 degrees to the east, producing a dramatic oblique view of the new bowl (LROC oblique view M1527218499L,R).

The deep-dive question is what the cold spot tells us about how the surface is changing in real time. Lunar regolith is a layer of loose, jagged grains sitting on top of more coherent bedrock, and over billions of years micrometeorite gardening has ground those grains into a fairly uniform fluff. An impact like McGetchin’s dumps energy into that layer in microseconds, and the explosion excavates a bowl and throws material outward. Some of that material lands around the rim, and when it does it piles up loosely, the way a sandbox pile sits lighter than the sand you started with. Loosely piled regolith does not conduct heat as well as the more compacted original surface, so at night it cools faster and to a lower temperature. Diviner saw exactly that signature, and the cold halo around McGetchin extends about 4 miles in diameter, far past the crater itself. The regolith disturbance has implications for any future rover that drives across the lunar surface: a fluffier surface means different wheel-soil interaction, and the team flagged that directly in the Science Advances paper.

The energy numbers help frame how rare an event this is. Wikipedia), citing the research papers, puts the impact energy at roughly 6.5 × 10^10 kilojoules, and the recurrence interval at about 132 years. NASA’s release phrases it as “once in a century or even longer,” which matches within the usual uncertainty of small-body population models. Either way, the take-away is that LRO has been on station long enough to catch the rare events in the lunar impact rate distribution, not just the everyday ones, and that what Wagner found is statistically one of the largest fresh craters the modern Moon has produced. The mission has been circling the Moon for more than 17 years and has mapped the topography, surface composition, thermal environment, and radiation environment there, and that sustained archive is what made the stacking comparison possible. Without it, the bright spot Wagner spotted would have been indistinguishable from a thousand other random brightness changes in any single Wide-Angle Camera frame.

What this means going forward is that the LROC team plans to keep running these global comparisons on a multi-year cadence and follow up with Narrow-Angle Camera close-ups and Diviner thermography whenever something new shows up. The same method that found McGetchin is now calibrated against a known impact and a known regolith response, so the next rare event should land faster and with less manual work. The Moon’s eastern limb will keep taking hits; the question is whether the next large one is caught the way this one was, by a quality check that turned out to be the headline.


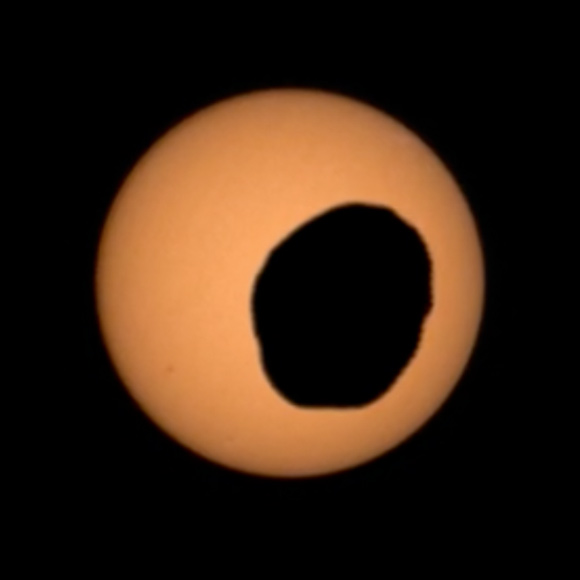
Perseverance catches Phobos slipping across the Sun on sol 1948. Image: 2026 08 26 perseverance phobos sun transit.


On 12 August 2026, on the 1,948th Martian day of its mission, NASA’s Perseverance rover stopped what it was doing for a few minutes, pointed its Mastcam-Z camera at the Sun, and watched Phobos, the inner of Mars’s two moons, slide across the solar disk. The animation that came back has been colorized to mimic what a person on the Martian surface would have seen looking up through a pair of protective eclipse glasses: a small, dark, lumpy silhouette gliding across a glowing orange Sun, never covering enough of it to qualify as a true eclipse (Sci.News).

A partial transit like this is small in the moment and large in the long run. Perseverance has been recording these crossings since it landed in Jezero crater in February 2021, and the team keeps shooting them because each one is a measurement of where Phobos is, and where it is going. By comparing the recordings taken years apart, scientists can refine the moon’s orbit, watch how the orbit is decaying under Mars’s tidal pull, and update the timeline for the day Phobos will finally break apart at the Roche limit or crash into the planet (Sci.News). The same kind of observation, applied to a star instead of a moon, was how exoplanet hunters in the Kepler and TESS era measured the size and orbital period of worlds around other stars. Phobos in front of the Sun is the equivalent demonstration, just two doors down from Earth.

The other reason the recording matters is that Phobos is one of the few Solar System bodies small and close enough that a single orbiting spacecraft can resolve its shadow path from the surface. The moon is only about 26 by 22 by 18 kilometers across, smaller than many asteroids, and orbits Mars at roughly 6,000 kilometers from the surface. That closeness is also why the transit never becomes a total eclipse: from the Martian surface, Phobos never appears large enough to cover the Sun’s disk, only to carve a moving bite out of it.

The 12 August 2026 observation was Perseverance’s most recent entry in a routine the rover has been keeping for more than four Earth years. The Mastcam-Z instrument, a pair of zoomable color cameras mounted on the rover’s remote sensing mast, has been used on multiple earlier sols to record Phobos and Deimos transits. Each observation produces a short video of frames that the team can stack, time-stamp against the rover’s onboard clock, and compare with prior sessions.

What is new with sol 1948 is mostly cosmetic. The animation was tinted on the ground to simulate the visual impression a human observer on Mars would get looking up through solar-eclipse glasses, the same orange-tinted look eclipse chasers use on Earth. The raw data is still a time series of dark silhouettes moving across a bright source. The team released the public-friendly version after running the standard calibration, and the Sci.News writeup on 24 August pulled it back into the news cycle as part of a steady drip of small Mars-science updates (Sci.News).

Behind the video is the same physics that makes a solar eclipse work on Earth: a foreground object passes between the observer and the Sun, casting a moving shadow. The differences are size and geometry. Phobos is roughly 150 times smaller than Earth’s Moon and sits about 200 times closer to Mars than the Moon does to Earth, so its angular size is far too small to cover the Sun. The Moon’s apparent diameter almost exactly matches the Sun’s during a total solar eclipse on Earth, which is the happy coincidence that makes totality possible. Phobos never gets that close to covering the Sun, so the term “transit” is the right word, with “annular eclipse” reserved for a slightly bigger blocker that still falls short of totality.

Mastcam-Z is the workhorse camera on Perseverance’s mast, sitting about two meters above the Martian surface at the eye level of a roughly 6½-foot-tall person, with the two cameras separated by about 24 centimeters to give stereo vision (NASA Mars 2020 Mastcam-Z page). It was designed primarily to study rocks and soils from a distance, with a zoom range that lets the team build topographic maps of terrain features, and it can record 1600 by 1200 pixel frames at up to about 148 megabits per sol of returned imaging.

The transit record itself is what the orbital dynamicists want. Phobos orbits Mars in 7 hours and 39 minutes, faster than any other moon in the Solar System relative to its parent planet’s rotation, and tidal drag is slowly shrinking that orbit. The standard textbook figure is that the orbital radius is decreasing at roughly two centimeters per year, or about two meters per century, and the projections for when Phobos will either break up into a ring or crash into the surface run from about 30 million to 50 million years out (Wikipedia: Phobos (moon))). Observations like the sol 1948 transit tighten the numbers behind those projections by giving the orbit a fresh astrometric fix.

The geometry also gives a measurement that is hard to get any other way: from a fixed landing site like Jezero, the exact path of Phobos across the Sun depends on where Phobos is in its orbit at a particular second. Cross-referencing that path against time, the rover team can solve for orbital elements that mass and remote sensing measurements cannot constrain.

A subtle point worth flagging is that Perseverance did not move to capture this transit. The rover was wherever it happened to be on sol 1948, and the team aimed the mast at the Sun from there. This matters because location is one of the unknowns in the orbital fit: if Jezero’s coordinates are even slightly off in the Mars-fixed reference frame, every recorded shadow path inherits that error. Years of persistent observations from the same rover at the same site cancel most of that error out.

The 12 August 2026 Phobos transit is a small piece of work by a long-running rover that has already spent more than five and a half years on Mars. The Mars 2020 mission’s headline job, caching samples for a future return mission, is well into its second decade of planning, and Mastcam-Z observations of this kind are now a small but reliable side-product that keeps adding data to the Phobos literature. Expect another of these recordings every few months from Jezero as long as the rover stays healthy, and the public versions appear in the standard NASA Mars 2020 image release channels over time. The longer-running payoff sits in the orbit itself: each transit shaves uncertainty off the prediction for the day Phobos stops being a moon.


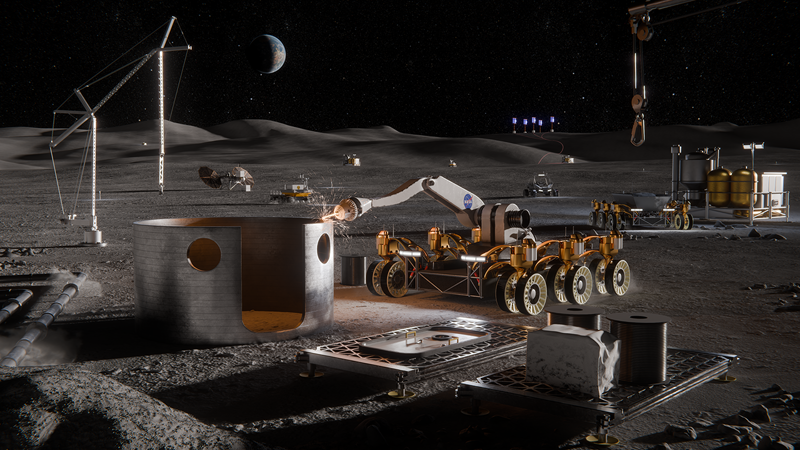
NASA seeks industry help for five Moon Base tech gaps. Image: 2026 09 11 nasa lunar surface tech call.


On September 8, 2026, NASA opened a formal industry solicitation aimed not at the rocket that gets astronauts to the Moon, but at the quiet hardware that has to keep them alive once they are there. The NextSTEP-3 Appendix A solicitation, branded the Lunar Enabling Infrastructure Accelerator, asks U.S. companies, universities, and not-for-profit teams to mature five specific technologies: vertical solar arrays, oxygen extracted from lunar regolith, radioisotope Stirling generators, in-space manufacturing, and innovative nanomaterials, areas that NASA considers the most stubborn gaps on the path to a sustained human presence near the lunar South Pole. The announcement was made under NASA news release RELEASE 26-072, “NASA Calls for Proposals to Accelerate Lunar Surface Technologies”, with proposals due back to the agency by 5 p.m. EDT on October 8, 2026.

The framing matters. NASA is not buying finished hardware with this call; it is buying the demonstrations and the data that show a competing set of approaches can reach Technology Readiness Level 5 to 6, the band where a system has been validated in a relevant environment and is ready to be bolted into a flight article. The agency’s NextSTEP-3 Appendix A program page describes the goal as “closing key technology gaps and maturing competing solutions” so that when NASA does commit to flight hardware, it can do so from a small set of demonstrated options rather than a paper study. The five capability areas named in the final solicitation are the same ones the agency laid out in its June 29, 2026 draft BAA, which followed a May 19 synopsis under procurement identifier 80GRC026R0008, a long drafting cycle by NASA’s usual standards, and a hint that the final wording reflects substantial industry feedback.

The five capability areas, named in the press release, are deliberately heterogeneous: a vertical solar array technology that can provide consistent power generation, management, distribution, and energy storage; in-situ resource utilization oxygen from regolith production to extract usable oxygen molecularly bonded to rock and dust covering the Moon’s surface; a radioisotope Stirling generator, a type of nuclear energy technology that uses heat from fissile materials to produce electric power for operating spacecraft systems in the darkest, dustiest, and most remote places; in-space advanced manufacturing to reduce reliance on resupply missions from Earth and to optimize mission flexibility and resilience on the Moon; and innovative nanomaterials production to advance the commercial availability and quality of nanomaterials that can be used in lunar exploration. Three of the five (oxygen extraction, radioisotope power, advanced manufacturing) were already on NASA’s lunar-technology roadmap before 2024; the vertical solar array and the nanomaterials line are newer entries, which signals the agency is looking outward at commercial capabilities rather than only downward at its own R&D centers.

Why this matters is the gap the announcement is trying to close. The NASA Moon Base reference page describes a near-polar outpost to be built in three phases: robotic exploration through 2029, infrastructure construction by 2032, and long-term astronaut habitation after that. Each phase rests on a different assumption about how much of the base can be supplied from Earth versus produced locally. Artemis IV, currently planned for 2028 per the Aviation Week writeup, is supposed to deliver the first pressurized surface habitat elements. Anything that arrives on that lander, however, still needs power at night, oxygen to breathe, and replacement parts when something breaks, since a single 384-hour lunar night at the pole is too long for any solar+battery architecture to survive without either massive storage mass or a complementary non-solar source. The five capability areas in this solicitation are NASA’s bets on which of those problems get solved by industry in time for the 2028-2032 build-out window.

The story behind the timing is that the broader Artemis program is under budget pressure, and this is the solicitation where NASA is trying to spend smaller amounts of money on a wider set of competing industry approaches rather than continuing to concentrate the work inside a handful of NASA centers. Greg Stover, director of NASA’s Advanced Research and Technology Division, is quoted in the release: “NASA is accelerating the development of key technologies and closing critical gaps needed for long-term human exploration at the Moon. Partnering with industry will strengthen the U.S. industrial base as we mature the capabilities and infrastructure needed for a sustainable lunar presence.” The “U.S. industrial base” phrasing is deliberate; the Appendix A announcement specifies that the solicitation “intends to cultivate U.S.-led capabilities while maintaining full and open competition among private industry, academic institutions, and not-for-profit entities, as well as international partners participating through U.S.-led teams.” International partners are allowed, but only through a U.S. prime, which is the language NASA uses when it wants to widen competition without ceding intellectual property control.

The science and engineering question underneath the solicitation is whether these five capability areas are actually independent or whether they have to mature together. They are not independent. The vertical solar array and the radioisotope Stirling generator are competing answers to the same problem (night-side power at the pole), and a base design that picks one will not need the other at full scale. In-situ oxygen extraction and in-space manufacturing share feedstock: the oxygen a regolith-processing plant pulls out of ilmenite or volcanic glass leaves behind a metal-rich slag that is, in principle, feedstock for additive manufacturing of structural parts. Innovative nanomaterials cut across all three: better cathode materials for the Stirling generator’s thermocouples, lighter radiation shielding for the habitat, higher-strength binders for the regolith-derived construction materials. The solicitation does not formally require joint proposals across areas, but the implicit pressure is on industry teams that can show how their work in one area plugs into the others. NASA may apply insights gained from the resulting contracts, the release notes, with “such as technical data, and demonstration results, to shape future acquisition strategies,” which is unusually candid agency language for “we will pick the winners in a second-round flight buy.”

The five areas also correspond to where the agency’s internal R&D has struggled the most. NASA’s in-house oxygen extraction work, dating back to the canceled Resource Prospector rover in 2018, has consistently run into the problem that the energy needed to crack oxides out of regolith exceeds what a small surface plant can deliver from solar panels alone. Pairing an oxygen plant with a Stirling generator is the obvious answer, but only if the Stirling generator’s heat source can be packaged small enough to land on a Commercial Lunar Payload Services flight. The vertical solar array is NASA trying to specify a different solution: a deployable tower that lifts panels above the dusty surface layer where direct sunlight is available for more hours per day, because traditional rover-deployed arrays have been repeatedly sandblasted by plume ejecta from nearby landings. None of these are problems the 2026 solicitation will solve, but the demonstrations the contracts buy will at least narrow the menu of credible solutions before the agency has to commit to a flight configuration for the 2030s.

The takeaway is that the September 8 solicitation is best read as a procurement shape rather than a flight milestone. NASA is not promising any of the five technologies will reach the Moon before Artemis IV, and it is not committing to a particular contractor; it is signaling that the menu of options will be wide and that the agency plans to make its architecture choices later, from the demonstrated set. Proposals are due October 8, and Aviation Week reports NASA does not plan to hold an industry day exchange, which is a hint that the agency considers the June draft and the August 20 “Responses to Industry Feedback” attachment sufficient background for offerors. If funded contracts cluster around one or two of the five capability areas, that will be the most informative signal, since it will tell observers which of the Moon Base’s hardest problems the agency now thinks an industry team can plausibly solve before the 2032 infrastructure-construction phase begins.


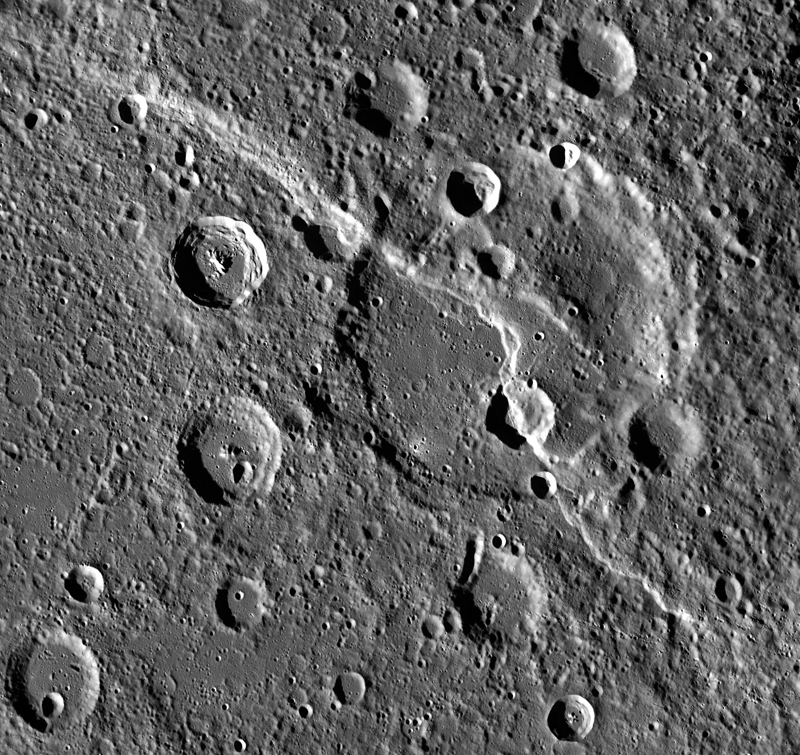
The lobate scarp Carnegie Rupes cuts across a heavily cratered plain on Mercury, with the rim of the small crater Duccio visible where the cliff slices through it. The ridge is roughly 270 kilometres long and rises several kilometres above the surrounding volcanic plain, and it formed as the planet's interior cooled and its outer shell shortened. Image: NASA / JHUAPL / Carnegie Institution, MESSENGER spacecraft, PIA19279, full resolution on Wikimedia Commons.


A fresh look at Mercury’s wrinkled face suggests the innermost planet is a tighter squeeze than anyone had measured. A team led by Gaku Nishiyama at the German Aerospace Center (DLR) reports on 10 September 2026 in Geophysical Research Letters that Mercury’s radius has shrunk by somewhere between 6.9 and 11.6 kilometres (about 4.3 to 7.2 miles) since the planet finished forming, up to 30% more shrinkage than the previous best estimate. The new number does not mean Mercury suddenly started cooling faster. It means the team has been able to count landforms that earlier surveys could not see, in places that earlier surveys did not look. (Phys.org, Space.com)

The cooling and contraction of a rocky planet are not abstract. They leave a written record on the surface. As the hot interior of a world like Mercury gives up heat to space, its iron core and silicate mantle both contract, and the cold brittle outer shell has to buckle and shorten to keep covering the smaller interior. On Mercury that shortening shows up as long curving cliffs called lobate scarps and as the smaller, bunched-up wrinkles that run across the volcanic plains. Each of those structures corresponds to a known amount of horizontal shortening, and the cumulative shortening of all of them tells you how much the planet’s radius has changed.

The problem is that some of those wrinkle ridges are buried under rubble. Mercury is the most heavily cratered surface in the Solar System besides the Moon, and each impact spreads a blanket of broken rock over a wide area. Where the surface is rough, the short scarps get masked by impact debris and are no longer visible from orbit. Earlier global surveys counted only the ridges they could see in smooth volcanic plains and used that visible population to estimate the global total. Nishiyama’s team did something different: they overlaid Mercury’s contraction-related fault map with a high-resolution surface roughness map, found that the roughest patches are systematically missing the scarps the smoother patches have, and used that correlation to estimate how much contraction the rough terrain is hiding.

The corrected total is 4.3 to 7.2 km of radial contraction, depending on how the unmapped regions are extrapolated. The upper end is about 30% larger than the previous widely cited figure, and the lower end is broadly consistent with the older estimate. Either way, the planet’s interior has gone through more total cooling than the existing record implied. That matters for what scientists think is going on inside Mercury today. A planet that has lost more heat over its lifetime is consistent with an iron core that has fewer light elements mixed into it, or with a higher starting temperature, or both. Lead author Nishiyama, in statements accompanying the paper release published via the American Geophysical Union’s media release, lays the implications out plainly: “More shrinking means Mercury could have a larger metal core, less light elements like silicon mixed into the metal core, or a higher starting temperature.” (Time)

The story behind the paper is at least as interesting as the headline number, because the data set the team used is mostly the same one that supported the earlier, smaller contraction estimate. NASA’s MESSENGER spacecraft orbited Mercury from 2011 until it ran out of fuel in 2015, and its Mercury Dual Imaging System returned the global monochrome and colour mosaics that almost every modern Mercury paper still leans on. The MESSENGER Laser Altimeter (MLA) produced a topographic map of the northern hemisphere but could not see all the way to the south. The team behind the new paper combined MESSENGER imagery with a recent roughness map derived from those same images, cross-checked with the older Byrne et al. 2014 estimate from Carnegie Institution and Smithsonian, and identified which kinds of terrain were systematically underrepresented in the historical contraction count.

The surface structures this work is about are dramatic at human scale even if they are subtle in orbit. The Wikipedia entry for Carnegie Rupes, a textbook lobate scarp in Mercury’s northern volcanic plains, describes an escarpment about 267 kilometres long with several kilometres of vertical relief. The image NASA’s MESSENGER spacecraft captured of that scarp cutting through the small crater Duccio (PIA19279, public domain, NASA / Johns Hopkins Applied Physics Laboratory / Carnegie Institution) is reproduced below. The curving bright ridge in the middle of the frame is the scarp itself. Each kilometre of vertical throw on a scarp like that one corresponds to a known amount of horizontal shortening, and the cumulative throw across thousands of such features is what gets converted, at the end, into a single radius change for the whole planet.

The instrument that will close the question is now on its way. ESA’s BepiColombo mission, launched in October 2018 and scheduled to enter orbit around Mercury in late 2026, dropped its cruising platform on 3 September 2026 after a flyby and is closing in for orbit insertion in November. It carries the BepiColombo Laser Altimeter (BELA), a German-Swiss instrument led by the same DLR group that authored the contraction paper. BELA is designed to map Mercury’s topography from the equator to the south pole at roughly ten times the vertical resolution of MESSENGER’s MLA, and Nishiyama is a member of the BepiColombo science team. He has been explicit about what the new data will buy. “Future data from laser altimetry on BepiColombo will collect more information on planetary contraction by measuring topography more precisely,” he said in the paper’s release materials, and the broader BepiColombo topographic record will let the team test whether the corrected 6.9 to 11.6 km figure is the final answer or itself an underestimate. (Phys.org)

The deeper question, beyond Mercury’s own radius, is what kind of planet Mercury is. It is the smallest planet in the Solar System by radius, the second-densest after Earth, and the only one with a fully liquid iron core that generates an active magnetic field. Its high density combined with its low mass implies an oversized metal core, and the surface contraction is one of the cleanest windows into how that core has been cooling for the past 4.5 billion years. A planet that has lost more heat than its visible faults suggest is a planet whose interior has been more efficient at giving up its primordial warmth. For models of planetary dynamos, of core composition, and of the thermal history of rocky worlds in general, that 30% revision is a meaningful step.

The lesson is also methodological. Planetary geologists working on Mars, the Moon, and the icy satellites of the outer planets face the same problem of counting only the faults that happen to be visible on the surface. Mercury’s case, where the obscuring layer is impact debris rather than vegetation or ice, is unusually clean. The team’s correlation between contraction feature density and surface roughness gives them, and anyone who follows them on other worlds, a concrete way to estimate how much of a planet’s tectonic record is hidden in plain sight. That kind of correction does not invalidate the earlier surveys; it shows that those surveys were working from the right kind of data and the right kind of reasoning, but with incomplete coverage.

By the end of November 2026, BELA will start returning the topographic map that turns Nishiyama’s 6.9 to 11.6 km range into a single number with much smaller error bars. If the BepiColombo topographic record confirms the upper end of the contraction range, the standard thermal-history models for Mercury will need to be revised in much the same way the contraction estimate itself just was. If it confirms the lower end, the new paper becomes a careful quantification of how much a single observational bias was understating a real measurement. Either way, the figure that planetary scientists will quote for Mercury’s shrinkage from now on is not the number they were quoting last week.