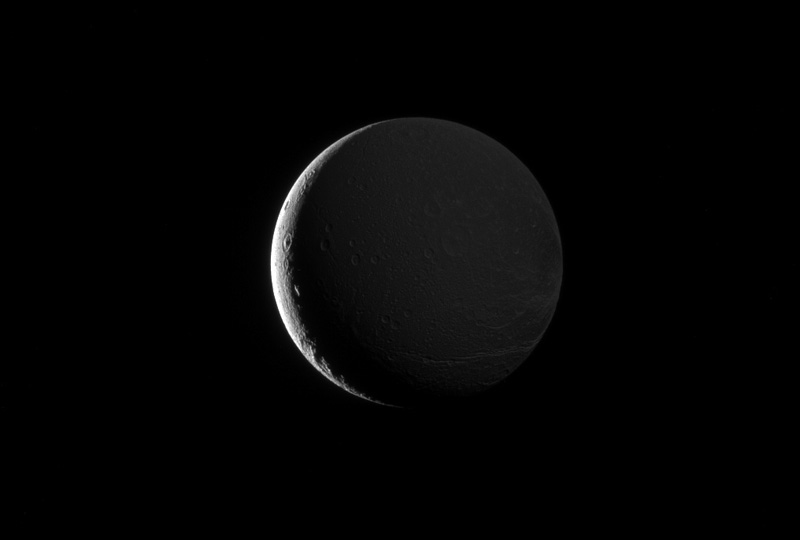
“October 23, 2016. Dione’s lit hemisphere faces away from Cassini’s camera, yet the moon’s darkened surface features are dimly illuminated in this image, due to Saturnshine. Although direct sunlight provides the best illumination for imaging, light reflected off of Saturn can do the job as well. In this image, Dione (698 miles or 1,123 kilometers across) is above Saturn’s day side, and the moon’s night side is faintly illuminated by sunlight reflected off the planet’s disk.
This view looks toward the Saturn-facing side of Dione. North on Dione is up and rotated 8 degrees to the right. The image was taken in visible light with the Cassini spacecraft narrow-angle camera. The view was obtained at a distance of approximately 313,000 miles (504,000 kilometers) from Dione. Image scale is 1.8 miles (3 kilometers) per pixel.”
Image credit: NASA/JPL-Caltech/Space Science Institute
“Nate made landfall over the weekend along the northern Gulf Coast as a Category 1 hurricane with sustained winds reported at 85 mph (~140 kph) by the National Hurricane Center (NHC) first at 7:00pm CDT on Saturday October 7th in Louisiana near the mouth of the Mississippi River then again several hours later at 12:30 a.m. CDT on Sunday October 8th near Biloxi, Mississippi before moving quickly moving northward through northern Alabama and central Tennessee.
NASA’s GPM satellite helped track Nate’s progress through the Gulf of Mexico and also captured Nate’s landfall on the north central Gulf Coast. The following animation shows instantaneous rain rate estimates from NASA’s Integrated Multi-satellitE Retrievals for GPM or IMERG product over North America and the surrounding waters beginning on Thursday October 5th when Nate first became a tropical storm near the northeast coast of Nicaragua in the western Caribbean until its eventual landfall on the northern Gulf Coast on Sunday October 8th.
IMERG estimates precipitation from a combination of space-borne passive microwave sensors, including the GMI microwave sensor on board the GPM core satellite, and geostationary IR (infrared) data. The animation shows Nate moving rapidly northward through the Gulf of Mexico on the 7th. Nate’s rapid movement from 20 to as much as 26 mph to strengthen despite being over very warm waters and in a relatively low wind shear environment. Nate reached a peak intensity of 90 mph sustained winds, which it maintained while passing over the Gulf of Mexico, but it did not intensify any further before making landfall. The animation also shows two 3-D flyby’s of Nate captured by the GPM core satellite as it overflew the storm just before landfall at 22:58 UTC (5:58 CDT) on Saturday October 7th and again at 08:42 UTC (3:42 CDT) on Sunday October 8th soon after Nate’s second landfall.
The 3-D precipitation tops (shown in blue) are from GPM’s DPR as are the vertical cross sections of precipitation intensity. The first overpass shows that Nate is a very asymmetric storm with most of the rainbands associated with Nate located north and east of the center. With it’s rapid movement, Nate was unable to fully develop and lacks the classic ring of intense thunderstorms associated a fully developed eyewall. Although overall much the same, the second overpass shows an area of deep, intense convection producing heavy rains over southwest Alabama.
Because of its rapid movement, Nate did not produce the catastrophic flooding that Harvey did. However, Nate is being blamed for 2 storm-related fatalities in the U.S. and at least 38 across Central America, most in Nicaragua and Costa Rica.
GPM is a joint mission between NASA and the Japanese space agency JAXA.”
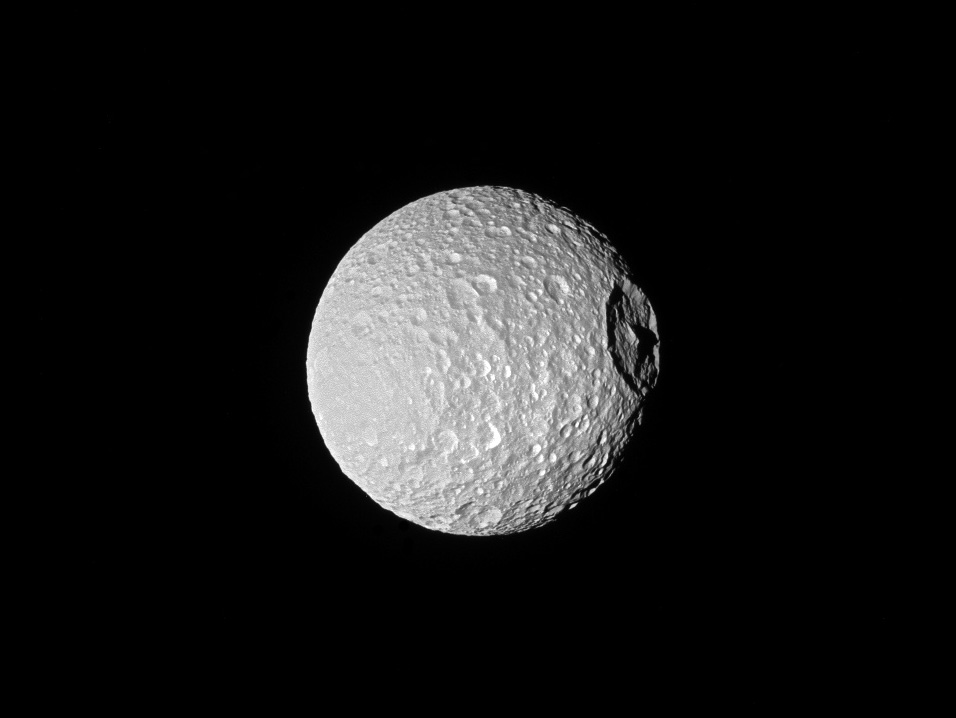
“October 22, 2016. Shadows cast across Mimas’ defining feature, Herschel Crater, provide an indication of the size of the crater’s towering walls and central peak. Named after the icy moon’s discoverer, astronomer William Herschel, the crater stretches 86 miles (139 kilometers) wide, almost one-third of the diameter of Mimas (246 miles or 396 kilometers) itself. Large impact craters often have peaks in their center. Herschel’s peak stands nearly as tall as Mount Everest on Earth.
This view looks toward the anti-Saturn hemisphere of Mimas. North on Mimas is up and rotated 21 degrees to the left. The image was taken with the Cassini spacecraft narrow-angle camera using a combination of spectral filters which preferentially admits wavelengths of ultraviolet light centered at 338 nanometers. The view was acquired at a distance of approximately 115,000 miles (185,000 kilometers) from Mimas and at a Sun-Mimas-spacecraft, or phase, angle of 20 degrees. Image scale is 3,300 feet (1 kilometer) per pixel.”
Image credit: NASA/JPL-Caltech/Space Science Institute
“Occator Crater on Ceres is home to the brightest area on the entire dwarf planet. At 57 miles (92 kilometers) wide and 2.5 miles (4 kilometers) deep, Occator displays evidence of recent geologic activity. NASA’s Dawn mission found that the bright spots may have been produced by upwelling of salt-rich liquids after the impact that formed the crater. Pan and zoom as you fly over the crater with Dawn in this 360-degree animation made with observations from the spacecraft.”
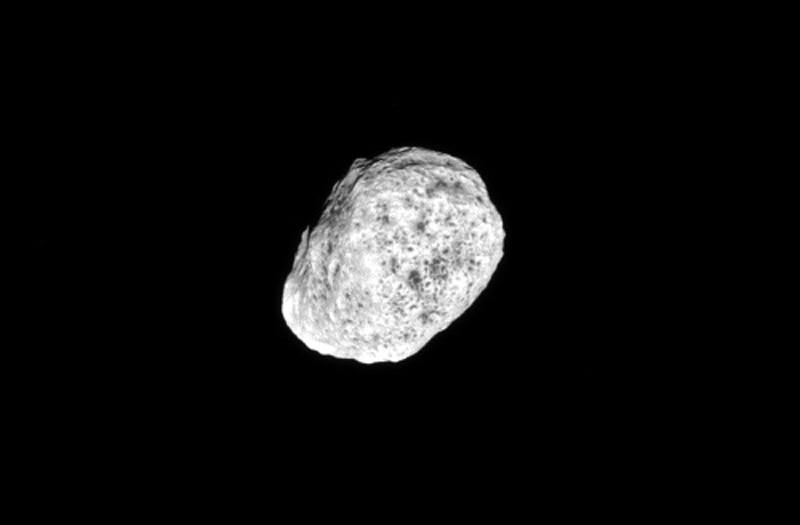
“August 22, 2016. The moon Hyperion tumbles as it orbits Saturn. Hyperion’s (168 miles or 270 kilometers across) spin axis has a chaotic orientation in time, meaning that it is essentially impossible to predict how the moon will be spinning in the future. So far, scientists only know of a few bodies with such chaotic spins. The image was taken in green light with the Cassini spacecraft narrow-angle camera.
The view was acquired at a distance of approximately 203,000 miles (326,000 kilometers) from Hyperion and at a Sun-Hyperion-spacecraft, or phase, angle of 10 degrees. Image scale is 1 mile (2 kilometers) per pixel.”
Image credit: NASA/JPL-Caltech/Space Science Institute
“As a result of a deep cracking cutting across the Larsen C ice shelf, a huge iceberg was spawned on 12 July 2017. Europe’s Copernicus Sentinel-1 mission was used to monitor the rift’s progress, a network of fractures in the ice and the calving event. Since then, the large tabular iceberg – known as A68 – has drifted about 5 km from the ice shelf. Images from Sentinel-1 also show that a cluster of more than 11 smaller icebergs have now also formed, the largest of which is over 13 km long. These ‘bergy bits’ have broken off both the giant iceberg and the remaining ice shelf.
Credits: contains modified Copernicus Sentinel data (2017), reproduced from Hogg and Gudmundsson (2017)”



 Subscribe to blog posts using RSS