


PUNCH tracks a coronal mass ejection all the way to Earth and lands within 30 minutes
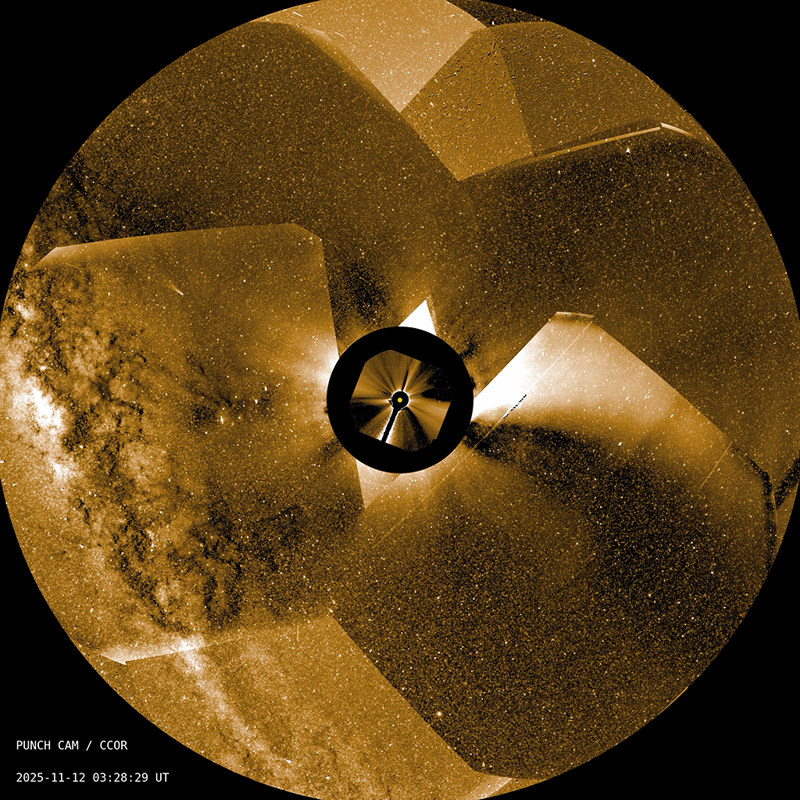
On the morning of August 4, 2026, a heliophysics team gathered at the Committee on Space Research Scientific Meeting in a windowless conference room and ran a video. The video showed a cloud of charged plasma leaving the Sun on May 31, 2025, and then kept watching it, frame by frame, as it crossed the inner solar system. Twelve hours after the eruption, a basic tracking model settled on an arrival time. Eight hours later, the cloud actually showed up. The forecast was accurate to within thirty minutes, an order of magnitude better than what operational forecasters can currently hand to a satellite operator or a power grid manager. The image stream that made it possible came from a constellation of four small NASA satellites that almost no one was talking about a year ago, called PUNCH, the Polarimeter to Unify the Corona and Heliosphere.
Solar storms are the part of space weather that hits infrastructure. A coronal mass ejection that reaches Earth compresses the magnetosphere, drives geomagnetic currents through long conductors, and can knock out high-voltage transformers, satellite electronics, and GPS-based timing. The 1989 Hydro-Québec blackout, which left six million Canadians without power for nine hours, began with a CME. The 2003 Halloween storms disrupted GPS, aviation, and the Japanese ADEOS-2 spacecraft. Satellites in low Earth orbit experience increased atmospheric drag during geomagnetic storms, and astronauts on the way to the Moon or Mars need to know when to take shelter.
The forecasting problem is that the Sun is 93 million miles away and a CME traveling at a million miles per hour takes about 15 to 18 hours to reach Earth. That is a long enough lead time to act, but only if you know when the cloud will arrive. The current operational model, called WSA-ENLIL, was put into service by NOAA’s Space Weather Prediction Center and uses a 1-to-4-day cone projection that gives a forecast window of about 5 hours. The 30-minute result from PUNCH is roughly ten times tighter, and it came from a deliberately simple model that the team describes as the “steam engine” version of what could be built on top of the same data.
PUNCH launched on March 11, 2025, from Vandenberg Space Force Base in California, sharing a Falcon 9 ride with the SPHEREx sky mapper. All five satellites separated from the same upper stage, and the four PUNCH spacecraft (three carrying Wide Field Imagers and one carrying the Narrow Field Imager) began climbing into a polar, low Earth orbit (Wikipedia: PUNCH; SwRI mission page). First light came on April 14, 2025, with the NFI and one WFI snapping their inaugural images, and the other two WFIs following two days later (NASA SVS PUNCH first-light CME images). By late May the spacecraft were returning daily mosaics wide enough to track a single CME from the corona all the way out to where Earth sits.
The team chose a specific event as their test case: a coronal mass ejection that left the Sun on May 31, 2025. The leading edge of the cloud moved through the inner solar system, and PUNCH’s three WFIs captured it every four minutes throughout the journey. The researchers fed those images into a basic forward model that had no deep learning, no physics-specific tuning, and no prior knowledge of the speed or geometry of the cloud. The model extracted the position and motion of the leading edge from the imagery and converged on an arrival time forecast roughly twelve hours after the eruption. That settled forecast was accurate to within 30 minutes of the actual arrival, a 10× improvement over the 5-hour window from the current operational approach, which uses the WSA-ENLIL cone model (NOAA SWPC WSA-ENLIL; NASA Science release).
“We thought PUNCH would be good at this, but it’s a stunning result,” said Craig DeForest, the principal investigator at Southwest Research Institute’s Solar System Science and Exploration Division in Boulder. “To put it in perspective, this could be the space weather equivalent of going from a steam engine to a modern internal combustion engine.” The model also revealed when its own estimate had stabilized, which is a useful property for forecasters because it tells them when the prediction is safe to act on.
PUNCH is built to do something the previous generation of coronagraphs could not: keep its eyes on a single coronal mass ejection for the entire Sun-to-Earth journey. The big European-NASA SOHO spacecraft, launched in 1995, carries the LASCO coronagraph that has been the workhorse of CME forecasting for three decades, but LASCO’s field of view cuts off at about 32 solar radii (NOAA SWPC CME overview). Beyond that, a CME becomes too faint and too far from the Sun’s bright disk for a coronagraph to track. The gap between LASCO’s edge and Earth is roughly 80% of the journey, and most of the guessing in the current 5-hour forecast window comes from that gap.
PUNCH’s three Wide Field Imagers extend that view out to 180 solar radii, while the Narrow Field Imager, a coronagraph similar in spirit to LASCO C3, covers 6 to 32 solar radii. Where the design is unusual is in the polarimetry: rather than just taking pictures, the WFIs measure the polarization of the sunlight scattered by free electrons in the corona and solar wind, which lets the team separate the K-corona (the part of the corona made of solar plasma) from the background starfield, zodiacal light, and Milky Way. The reduction pipeline aligns images from all four spacecraft to within 0.03 pixels of each other and produces a single 4-minute-cadence polarimetric image covering a 90° field of view centered on the Sun (NASA SVS PUNCH Instruments).
The forecasting work uses that data in a deliberately simple way. The model segments the moving leading edge of the CME, fits kinematics to its position over time, and projects the arrival by extrapolating the speed and direction. It does not currently include physics for how a CME decelerates against the ambient solar wind, rotates as it expands, or interacts with earlier ejections. The fact that a basic kinematic model still beats the operational cone model by a factor of ten is the headline: more physical realism, and more PUNCH data, will only sharpen it. DeForest’s team has also begun using the high-resolution imagery to see that CMEs are clumpier than previously thought and continue to evolve as they travel, which is itself new physics for the forecast models to absorb.
PUNCH’s first forecast result is a proof of concept rather than a finished system. The model that produced the 30-minute window is not yet integrated into NOAA’s operational forecasting pipeline, and the August 4 announcement at the Committee on Space Research Scientific Meeting is paired with a paper currently under review at the journal Space Weather (NASA Science release). The next steps are obvious and on the team’s roadmap: refine the model, run it on a larger sample of CMEs, and hand it to SWPC for testing. If the gain holds across more events, the practical effect is that satellite operators can keep a spacecraft in safe mode for a shorter window, power grid dispatchers can stand down earlier, and crewed deep-space missions can plan around tighter storm arrival predictions. The CMEs that PUNCH is now watching arrive and evolve across the inner solar system will keep teaching the team how the Sun connects to the space weather we feel on Earth.
 Subscribe to our RSS feed







There are no comments.
Add A Comment