


For decades the thermosphere, the broad band of electrically neutral gas that sits between roughly 100 and 1,000 km above the ground, has been one of the most expensive places on Earth to study. A handful of in-situ instruments on satellites like ESA’s SWARM constellation have nibbled at it one orbit at a time. Atmospheric models fill the gaps, but with rising space traffic the gaps have grown political: collision avoidance, reentry forecasting, and space-weather alerts all need accurate thermospheric density on short timescales, and the measurements feeding those models are sparse. A team at Kyoto University has now shown that the same orbital data SpaceX publishes for free to coordinate its Starlink constellation can be turned into a continent-scale thermospheric density snapshot, using a method borrowed from medical imaging. The result, published 30 July 2026 in Earth, Planets and Space, is the first latitude-by-longitude map of thermospheric density reconstructed entirely from the orbital decay of commercial broadband satellites.
The thermosphere matters because every spacecraft in low Earth orbit lives inside it. Even at 500 km altitude the gas is thin enough that an astronaut on an EVA suit would consider it vacuum, but it is dense enough that a 250-kilogram satellite experiences a steady, measurable aerodynamic drag. That drag pulls satellites down, which is why the International Space Station and thousands of debris fragments eventually reenter. It is also why precise orbit prediction is so hard: a small change in thermospheric density can shave minutes off a predicted pass, and during a geomagnetic storm a single high-speed plasma plume from the Sun can change density at satellite altitude by a factor of two in less than an hour.
The economic stakes have grown with Starlink, OneWeb, Kuiper, and the Chinese Guowang constellation. As of mid-2026 there are roughly 9,000 active satellites in low Earth orbit, with another 50,000 pieces of tracked debris larger than 10 cm. Every collision risk assessment, every conjunction warning, every debris-reentry prediction depends on knowing how dense the air is along each object’s path. Today, most operational systems rely on either accelerometer data from a few sentinel satellites or on empirical density models calibrated against historical storms, which means they tend to miss local structure in the thermosphere: the day-night asymmetry, the geomagnetic-latitude bite, the traveling atmospheric disturbances that follow a sunrise terminator around the globe.
A method that turns routine commercial satellite tracking into a near-real-time thermospheric density map would change that. It would also change what counts as “ground truth” for the physics of the upper atmosphere: the same data set that lets SpaceX coordinate its own orbital slot allocation could now be re-used by every atmospheric scientist with a Python notebook and access to a public ephemeris feed.
The Kyoto University group, led by space engineer Mamoru Yamamoto with first author Takuya Sori, had already pushed in this direction. In an earlier paper they showed that they could estimate how thermospheric density varies over time and altitude using public Two-Line Element (TLE) data, the short text records that amateur satellite trackers use to find the ISS. The technique was time-honored: a satellite in a decaying orbit loses energy at a rate set by the local air density, so inverting the decay curve gives density as a function of height and time.
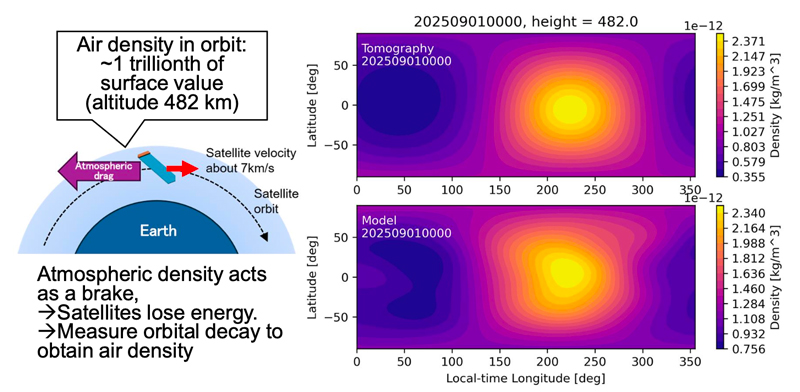
The 2026 paper takes the next step. Instead of treating each satellite as a single measurement, the team treated the constellation as a moving grid of sensors. For roughly 1,200 Starlink satellites at an altitude of 482 km, they calculated orbital energy loss from publicly broadcast ephemeris messages over a chosen interval and fed the resulting drag estimates into a tomographic inversion. Tomography, the same family of math that turns a CT scanner’s one-dimensional projections into a 3-D image, is good at reconstructing a 2-D field from many intersecting 1-D lines. Here the lines are satellite ground tracks across the globe.
The reconstruction, anchored on a single day of data from 1 September 2025, produced a full two-dimensional density map of the thermosphere at roughly 500 km altitude, with peaks over the sunlit mid-latitudes and lower density on the night side. When the Kyoto team compared their tomographic result against density profiles recorded along their tracks by the European Space Agency’s SWARM satellites, the agreement was within the noise floor of the comparison: both showed the same high-density lobes over the daytime side of the Earth, and the same minima near the dawn terminator.
The work, formally titled “Tomography of thermospheric density from Starlink Ephemeris: initial report”, appeared in Earth, Planets and Space on 30 July 2026. Kyoto University’s research news office published a press release on 4 August, and the result was picked up across space and Earth-science outlets including ScienceDaily and Phys.org. A KURENAI repository copy is available without paywall.
The “ephemeris” in the new paper is not the same thing as a TLE. A TLE is a compact orbital state vector published by the U.S. Space Force’s Space-Track catalog; it is good to roughly a kilometer of position accuracy and is updated a few times a day. SpaceX publishes a higher-precision ephemeris for each Starlink satellite, broadcast continuously over the same radio link the satellites use for internet traffic, which includes predicted position and velocity to a fraction of a meter. It is the kind of data that, until now, was treated as operational infrastructure rather than science data.
Drag at 482 km is dominated by collisions with atomic oxygen, the dominant species in the upper thermosphere. The momentum transfer rate per unit density for a satellite at typical Starlink ballistic coefficients has been measured in orbit many times; the Kyoto team leans on those calibrations rather than computing from first principles. The bigger problem is geometry. A single satellite samples density along a single line on the globe. To reconstruct a 2-D field you need many satellites crossing many different latitudes and local solar times in the same interval. With about 1,200 Starlinks in a near-polar orbit that circles the Earth every 90 minutes or so, the constellation completed more than a hundred full ground tracks during the chosen 24-hour window, which is enough to populate every 5-degree latitude-longitude cell at least a few times.
The “tomographic inversion” itself is a weighted least-squares fit with a smoothness prior. Weights come from each satellite’s expected drag uncertainty (a function of mass, frontal area, and atmospheric composition model), and the smoothness prior prevents the optimizer from inventing small-scale structure the data cannot resolve. The output is a single snapshot, not a movie. A time series would need the inversion repeated on a rolling window.
Independent validation mattered. The European Space Agency’s SWARM mission, launched in 2013, has been measuring thermospheric density along its three orbital tracks for over a decade. SWARM reads a non-gravitational acceleration directly with an onboard accelerometer, which is the gold standard for in-situ density measurements. On 1 September 2025 SWARM’s tracks happened to fall inside the latitude-longitude cells the Kyoto inversion had populated. The two density fields agreed at the level expected from SWARM’s own noise floor, plus some extra uncertainty the Kyoto team acknowledged from their assumption that every Starlink satellite has the same effective ballistic coefficient.
The remaining bottleneck is uniform ballistic coefficient. Real Starlinks vary slightly in mass and orientation, and not all of them have their ephemeris precision documented publicly. The Kyoto group flags this as the next refinement to chase.
Three numbers summarize the work: 1,200 satellites, 482 km altitude, one day of data. Together they describe the smallest possible demonstration that a global commercial broadband network can be repurposed into a free, passive, science-grade sensor for the upper atmosphere.
A near-real-time implementation would need only an automatic ephemeris ingestion pipeline and a routine inversion, something the team has indicated they are working on. If such a pipeline goes operational, atmospheric modelers will have far more ground truth on the quiet-day thermosphere than they have today, and the same data will feed directly into space-weather products that already serve satellite operators.
For now the result is a proof of concept: enough to show it works on one day, not yet a system that rewires upper-atmosphere science.
 Subscribe to our RSS feed









There are no comments.
Add A Comment